Chapter 1:
2024 in review
Record rise in renewables pushes clean power generation above 40% of global electricity
Record renewables growth helped push clean power to a new milestone. However, heatwaves contributed to high growth in electricity demand, which resulted in a small increase in fossil generation.
Renewable generation showed a record increase in 2024, driven by a surge in solar power, a rebound in hydro and moderate wind growth. Hotter temperatures than in 2023 amplified the increase in electricity demand and led to a small rise in fossil generation (+1.4%). Consequently, power sector emissions increased by 1.6%, rising to a new record high of 14.6 billion tonnes of CO2. However, fossil generation would have remained almost unchanged in the absence of hotter temperatures, as clean generation rose quickly enough to meet the non-temperature related growth in electricity demand in 2024.
Record rise in renewables, led by solar, brings clean power to a new milestone
Clean power surpasses 40% of global electricity generation
A record surge in renewables spearheaded by solar power, combined with increased nuclear output, pushed clean electricity’s share to 40.9% of global electricity in 2024, up from 39.4% in 2023. 2024 was the first year that low-carbon sources delivered more than 40% of global electricity since the 1940s, when the global electricity system was 50 times smaller than it is today.
The global share of wind (8.1%) and solar (6.9%) is rapidly increasing, together exceeding hydropower for the first time in 2024. Hydro remained the largest source of clean electricity, providing 14.3% of global electricity generation in 2024, followed by nuclear at 9.0%. Despite remaining the two largest sources of low-carbon electricity, hydro and nuclear are not increasing their share – with nuclear’s share falling to a 45-year low in 2024 – as generation has been growing more slowly than electricity demand.
Other renewables, such as bioenergy and geothermal power, contributed 2.6% of global electricity in 2024.
80 countries generated more than 50% of their electricity from clean sources in 2024, including 47 countries that reached more than 75%.
As the global share of clean sources rose, the share of fossil fuels in the electricity mix consequently fell from 60.6% in 2023 to 59.1% in 2024, dropping below 60% for the first time since the 1940s. Coal power provided 34.4% of global electricity in 2024 and gas 22%, with other fossil fuels contributing 2.8%.
Record renewables growth meets three-quarters of electricity demand growth
In 2024, renewable power sources collectively added a record 858 TWh of generation – a 49% increase over the previous record of 577 TWh set in 2022.
With the growth in solar, hydro and wind, renewables met three-quarters of the growth in electricity demand. Solar was the largest driver of new electricity growth, rising by 474 TWh (+29%) and meeting 40% of the global increase in electricity demand.
Hydropower output rose by 182 TWh in 2024, reaching a new all-time high. The growth in 2024 was a rebound from historic droughts in 2023, which constrained hydro production. Notably, China accounted for 72% of the rebound in global hydro generation in 2024, as the country was hit particularly hard by droughts in late 2022 and 2023.
However, despite the global increase in hydro generation in 2024, the capacity factor – the amount of generation per unit of capacity – of the global hydro fleet remained significantly below historical levels. The record generation in 2024 was only 2% above the previous record set in 2020, despite capacity increasing by 7% since then.
Wind generation also grew by 182 TWh (+7.9%) in 2024. While capacity additions remained high, slightly lower wind speeds in some geographies – especially in China and the EU – reduced potential generation gains. With capacity growth remaining strong across the world, generation is likely to return to higher growth in the coming years, though wind conditions will affect output from year to year.
Nuclear power increased by 69 TWh (+2.5%), rising for the second year in a row, driven largely by higher utilisation rates in France.
Together, renewables and nuclear met 79% of the demand increase. Fossil fuels met the remainder of the demand increase, which was largely caused by hotter temperatures (see more detail later in this chapter).
Record solar increase in 2024 as solar power maintains high growth rates
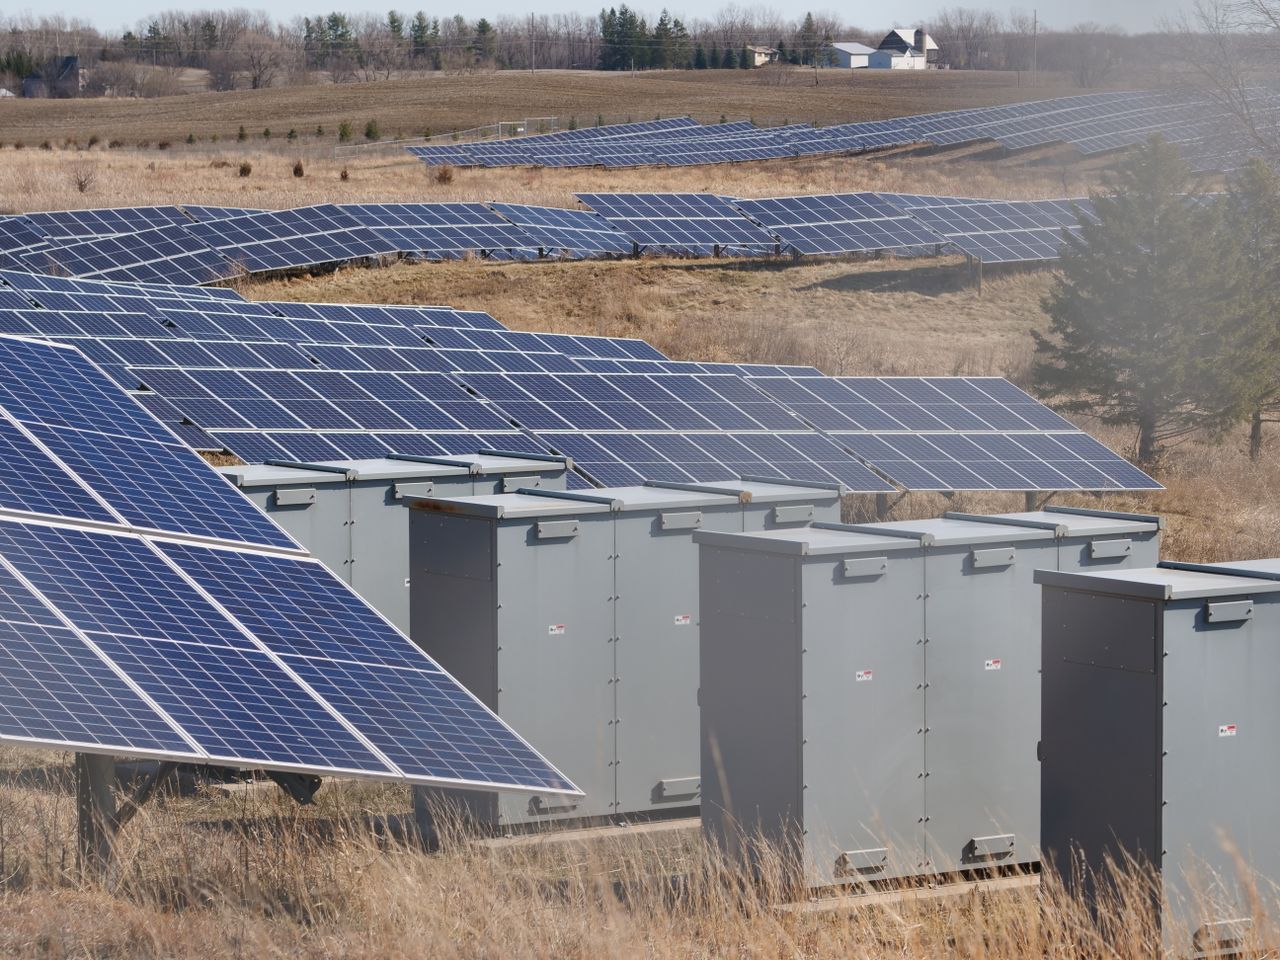
Solar power surged by a record 474 TWh in 2024, the largest annual growth ever recorded in absolute terms and the fastest increase in six years (+29%). Solar power has maintained its extraordinarily high growth rates even as the technology has become the primary driver of new electricity generation. As a result, solar generation has doubled every three years, reaching 2,131 TWh in 2024. For the third consecutive year, solar recorded the largest absolute increase of any electricity source. For the 20th year in a row, it remained the fastest-growing power source.
The surge in 2024 was driven by record solar capacity installations in 2023 and 2024. In 2023, new capacity installations jumped by 86% compared with 2022. In 2024, they increased by a further 30%, to a total of 585 GW. As capacity is installed throughout the year, a proportion of it only results in generation increases the following year.
Solar generation growth from the recent capacity boom was potentially even larger than observed, as reporting from distributed solar, such as rooftop installations, can be incomplete. Ember’s data includes rooftop solar generation where possible and includes estimates in countries with large amounts of rooftop solar where reporting is inaccurate, but some underestimation is likely.
Hotter temperatures amplify high electricity demand growth
Electricity demand grows at the third-highest level in the last decade
Global electricity demand grew by 4.0% (+1,172 TWh) in 2024, crossing 30,000 TWh total demand for the first time. 2024 represents the third-highest percentage growth in electricity demand in the last ten years.
The increase in demand in 2024 was significantly higher than in 2023 and 2022, when global demand grew by 2.6% (+758 TWh) and 2.3% (+656 TWh) respectively. Unlike the post-pandemic rebound in 2021, the increase in 2024 was not driven by an acceleration in overall economic activity. GDP data shows similar rates of growth in 2024 (+3.2%) and 2023 (+3.3%), which implies that economic growth was not the driving factor behind the surge in demand in 2024.
Heatwaves amplify higher demand growth
Electricity demand growth accelerated from 2.6% in 2023 to 4.0% in 2024. However, accounting for differences in temperatures, demand growth was the same across both years at 3.3%.
Analysing temperature impacts on electricity demand, Ember estimates that nearly a fifth of the demand increase in 2024 was temperature-related (see Methodology for more detail). 2024 surpassed 2023 as the hottest year on record, and crucially showed especially high temperatures around population centres in major economies, particularly in China, the US and India (read more in Ember’s analysis on heatwaves and electricity demand in these countries).
Higher temperatures had a twofold effect on demand in 2024. On the one hand, they increased cooling demand by 238 TWh compared to 2023. On the other hand, milder winters reduced the need for heating by 29 TWh. The net result was a temperature-related increase of 208 TWh. Had 2024 experienced the same temperature patterns as 2023, the overall electricity demand growth would have been only 3.3% (+963 TWh), rather than the 4.0% (+1,172 TWh) observed.
Recent years have shown how weather patterns affect electricity demand, leading to year-to-year variability on top of the underlying upwards trend from economic growth and electrification. In 2022, colder winters than normal in the United States created additional demand for heating, and summer heatwaves in the US and China amplified cooling demand. In 2023, there were less dramatic weather extremes, and so less demand for heating or cooling. In 2024, heatwaves led to higher demand for cooling.
Annual demand growth in both 2024 and 2023 would have been 3.3% without temperature impacts. The differences in weather patterns decreased demand growth from 2022 to 2023 by 186 TWh, reducing what would have been a rise of 3.3% down to the observed demand growth of 2.6%. In contrast, temperature impacts increased demand growth from 2023 to 2024 by 208 TWh, inflating what would have been a rise of 3.3% up to the 4.0% observed.
Even after these corrections for temperature, the underlying demand growth in 2023 and 2024 of 3.3% was higher than the ten-year average (2013-2022) of 2.5%. This is largely driven by applications such as EVs, heat pumps and data centres (see Chapter 2.2 for more analysis).
Heatwaves drive a small increase in fossil use
In 2024, global fossil generation increased by 245 TWh (+1.4%) – comparable to the increases of 246 TWh in 2023 and 201 TWh in 2022. This rise in fossil generation led to a 1.6% increase in global power sector emissions (+223 million tonnes of CO2), which reached a record high of 14.6 billion tonnes of CO2. However, Ember’s analysis shows that fossil generation rose primarily as a result of hotter temperatures compared to 2023.
Hotter temperatures the key driver of fossil power and emissions increases in 2024
Hotter temperatures compared to 2023 were a key reason behind the increase in fossil generation in 2024. Clean electricity generation surged by a record 927 TWh in 2024, which was sufficient to cover 96% of the electricity demand growth not caused by higher temperatures (+963 TWh).
However, fossil fuel generation rose to meet the additional demand increase of 208 TWh driven by high temperatures. This dynamic was especially pronounced in countries that experienced strong heatwaves, with coal rising to meet higher demand in China and India, and gas rising to meet demand in the US. On a global basis, if 2024 had experienced the same temperatures as 2023, fossil generation would have remained almost unchanged, with just a 0.2% increase.
Smaller-than-average increase in fossil generation in China and India, while the US rebounds from a fall in 2023
The world’s three largest power consumers – China, India and the US – saw an increase in fossil generation in 2024, while the world’s fourth largest, the EU, saw a decline.
China was still the country with the largest increase in fossil generation, but – despite the impacts of heatwaves – 2024’s growth of 116 TWh was less than a third of its 2023 increase (+367 TWh) and only half its average annual increase over the last five years (+218 TWh).
India’s fossil generation grew by 67 TWh in 2024, significantly lower than the 124 TWh increase recorded in 2023 and the country’s lowest increase since the rebound after the Covid-19 pandemic.
Driven by a rise in electricity demand, the US also saw an increase in fossil generation (+34 TWh) in 2024. Gas generation rose significantly, as coal saw a moderate fall. This represents a rebound from 2023 which saw a year-on-year decline in fossil generation amid falling demand. US gas generation growth was equivalent to 57% of the global increase in gas generation in 2024. Despite record clean electricity growth, the US has now recorded an increase in fossil generation in three out of the last four years.
The EU continued to see a fall in fossil generation (-75 TWh) in 2024. This happened despite a small increase in power demand and an increase in electricity exports, as clean electricity growth significantly outpaced demand growth.

Related Content