Gas share in global power mix has declined for a fifth consecutive year
Gas is losing its share in the global power mix as renewables increasingly meet rising electricity demand.
9 Jun 2026
7 Minutes Read

About
This analysis examines how the role of gas in the global power sector is changing as renewable electricity expands across major economies. It explores long-term trends in gas-fired generation globally and across key markets, including the G7, China, India and Brazil.
Gas’s role in the global power mix is declining
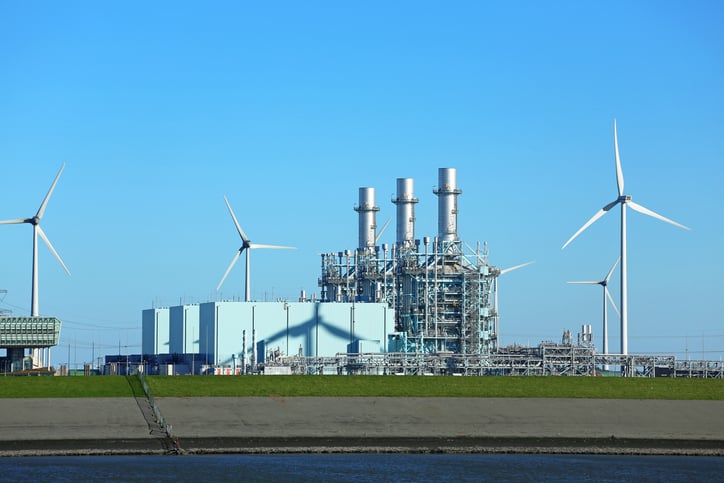
The share of gas in the global power mix declined for the fifth consecutive year in 2025, despite a small rise in absolute gas generation. Strong growth in clean power, led by solar and wind, met around 68% of global electricity demand growth over the last five years (2021-2025), reducing the need for a significant rise in gas power generation.
- 2025 was the fifth consecutive year of decline in gas share in the global power mix. Although global gas generation has not yet peaked in absolute terms, its growth has slowed sharply. Between 2021 and 2025, gas generation grew at an average annual rate of 1.6%, about half the average growth rate seen between 2016 and 2020 (2.9%). Because gas grew more slowly than electricity demand, its share of global electricity generation fell from 23.9% in 2020 to 21.8% in 2025.
- Nearly half of gas-generating economies have passed their gas power peak. By 2025, 61 out of 124 economies generating electricity from gas had passed their gas generation peak, defined in this analysis as countries where gas-fired electricity generation has remained below its historical peak for at least five consecutive years. Together, these countries accounted for around one-fifth of global gas-fired electricity generation in 2025, showing that gas declines are widespread, but the global peak still depends on a smaller group of large gas-generating economies.
- Renewables are close to overtaking gas power in the G7. The G7 accounted for 37% of global gas-fired electricity generation in 2025. Four G7 gas import-dependent economies — the UK, Germany, Italy and Japan — have remained below their historical gas generation peaks for at least five consecutive years. Across the G7 as a whole, gas has not yet peaked, but there are growing signs of a plateau. Its share fell for a second consecutive year, while generation also declined in 2025. At the same time, renewable power has grown consistently and, in 2025, generated almost as much electricity (2,544 TWh) as gas power (2,577 TWh), helping clean power overtake fossil power in the G7 electricity mix.
- Brazil, China and India are meeting rising electricity demand without turning to gas. The world’s three largest emerging economies, which accounted for 42% of global electricity demand in 2025, continue to grow while maintaining relatively low levels of gas generation in their power systems. China’s gas share remained close to 3% of the electricity mix in 2025 despite rapid demand growth. In India and Brazil, gas has already peaked and now plays a more limited balancing role.
The economics and energy security case for electricity are increasingly moving in the same direction. As renewables lower costs and reduce exposure to fuel price shocks and geopolitical disruptions, gas is steadily losing the advantages that once made it the default fuel for power system growth.
Recent geopolitical disruptions have also reinforced the downward trend in gas by exposing the price volatility and energy security risks associated with import-dependent gas systems. Russia’s invasion of Ukraine in 2022 triggered major gas supply disruptions and price spikes, accelerating renewables deployment in Europe and Asia. More recently, LNG disruptions linked to the US-Israel war with Iran in 2026 are expected to further accelerate this shift.
Together, these trends suggest that gas is increasingly shifting from a source of structural growth in the power sector towards a balancing role alongside expanding renewable electricity systems.
The world is nearing the gas power peak
2025 marked the fifth consecutive year of decline in gas share in the global electricity mix, as clean power grew faster than electricity demand, limiting the need for a significant rise in gas generation and suggesting that the world may be nearing a peak in gas-fired power.
Global electricity demand more than doubled over the last two decades, increasing from 15,279 TWh in 2000 to 31,774 TWh in 2025, driven by industrialisation, rising living standards and electrification. Historically, much of this demand growth was met by fossil fuels, including gas. However, the role of gas in meeting new electricity demand is now changing as renewable power scales up rapidly across most countries.
Global gas power growth is slowing as clean electricity meets more demand
Since 2000, gas-fired electricity generation has continued to increase globally, but its role in meeting new electricity demand has weakened. Between 2001 and 2005, gas accounted for an average 33% of growth in global electricity demand at a time when renewable deployment remained limited.
In the decade following the Paris Agreement, several advanced economies expanded gas generation as part of efforts to reduce coal use or diversify power systems. Between 2016 and 2020, gas still accounted for an average 31% of growth in new electricity demand. However, as renewables deployment accelerated globally, gas accounted for only about 11% of demand growth between 2021 and 2025.
In 2025, gas accounted for less than 5% of global electricity demand growth, increasing by only 38 TWh (+0.6%). Solar alone grew by 636 TWh (+30%), 17 times more than gas, and met around 75% of global electricity demand growth.
Because gas generation grew more slowly than demand, its share in the global power mix fell for the fifth consecutive year, from 23.9% in 2020 to 21.8% in 2025. Although global gas generation has not yet peaked in absolute terms, these trends suggest that gas power is losing momentum as a source of global growth and may be approaching a structural peak.
Geopolitical disruptions have reinforced the downward trend in gas by exposing the price volatility and energy security risks associated with import-dependent gas systems. Major economies, including Germany, India, Japan and South Korea, have been committing to faster deployment of renewable sources as a response.
Gas share in the power mix is stagnating or falling in most regions
Gas share in power mixes is stagnating or declining as new demand is increasingly met by sources other than gas, particularly renewables. This suggests that gas is no longer the primary route for meeting rising electricity demand across much of the world.
In traditionally coal-heavy regions such as Asia and Oceania, falling coal generation has not translated into a larger role for gas. Gas remained a relatively limited share of the regional power mix in 2025, accounting for 10.2% in Asia (down from 13.9% in 2015) and 15.1% in Oceania (down from 18.5% in 2015).
In Europe, gas power share peaked in 2010 at 28.4% of the electricity mix, equivalent to 1,443 TWh. Since then, generation has fallen in absolute terms to 1,212 TWh, accounting for 23.8% of the mix. Falls in gas power occurred alongside coal power’s decline as clean power scaled up.
In Latin America and the Caribbean, gas power share peaked in 2015 at 28.6% of the mix, equivalent to 460 TWh. As electricity demand continued to expand, gas power peaked in absolute terms in 2019, reaching 474 TWh or 28.2% of the mix. Since then, it has fallen to 448 TWh and 24.3% of the mix in 2025, as much of the region’s growing demand has been met by clean sources.
In contrast, gas power is rising in North America, parts of the Middle East and Africa. This is especially evident in the US and Canada, where gas remains central to the power sector due to abundant domestic resources. In parts of the Middle East, gas has been used to replace some oil-fired generation, while in North Africa and parts of West Africa, domestic gas continues to support rising electricity demand.
Nearly half of gas power-generating economies have passed their gas generation peak
By 2025, 61 of 124 economies generating electricity from gas are now below their gas-generation peaks. Together, these countries accounted for around one-fifth of global gas-fired electricity generation in 2025. This shows that gas peaks are already widespread, but most generation remains concentrated in large economies that are still growing or have not yet clearly peaked.
The largest declines since peak gas generation occurred in Japan (-127 TWh), followed by the UK (-85 TWh), India (-69 TWh), Spain (-59 TWh) and Italy (-48 TWh) — all economies exposed to imported gas or international gas prices.
Japan recorded the largest absolute fall from the peak. Gas-fired generation peaked in 2017 at 464 TWh (43% of the electricity mix) before falling to 338 TWh (33%) in 2025. The decline reflected the restart of some nuclear reactors following the Fukushima disaster in 2011, alongside rapid solar expansion and falling electricity demand.
In the UK, Spain and Italy, falling gas generation also coincided with declining coal generation and rising renewable electricity output. In the UK, the gas share fell from 176 TWh (45% of the electricity mix) in 2008 to 91 TWh (31%) in 2025, while coal was phased out completely in 2024 as offshore wind and other renewables expanded.
Post-2015 gas growth has been concentrated in a few large markets
In the decade after the Paris Agreement, gas continued to rise, but growth was concentrated. In some countries, particularly the US, gas expanded as coal declined or electricity systems diversified. In others, gas growth fell for country-specific reasons, including nuclear generation recovery and the strong growth in renewables.
The US recorded the largest increase in gas generation between 2015 and 2025, with gas-fired electricity rising by 474 TWh — equivalent to just under one-third of global gas growth over the period. In the same period, the gas share in the US electricity mix increased from 33% to 40%, while coal share halved from 33% to 16%. China recorded the second largest increase, but gas remained a relatively small share of its electricity mix. Gas generation in China rose by 167 TWh over the decade, with its share rising from 2.9% to 3.2% between 2015 and 2025.
Between 2015 and 2025, gas-fired generation in Japan fell by 80 TWh as nuclear reactors gradually restarted and solar deployment accelerated. Outside advanced economies, Viet Nam recorded one of the sharpest declines in gas reliance, where gas generation fell from 30% of the country’s electricity mix in 2015 to 6% in 2025, while both coal and renewable generation expanded rapidly to meet rising electricity demand. Other declines were spread across a diverse group of economies, including Venezuela, Brazil, Türkiye, India, the UK, Belarus, Belgium and Colombia.
Gas generation is slowing in major power markets
Renewables close to surpassing gas generation in G7
The G7 accounted for 37% of global gas-fired electricity generation in 2025, despite representing only around 10% of the world’s population. The US alone accounted for 26% of global gas power in 2025. Gas remains a significant share of the mix and has not yet reached a peak in generation, but there are growing signs of a plateau. Gas generation across the G7 expanded largely as a replacement for coal generation, particularly in the decade following the Paris Agreement.
In 2025, gas generation in the G7 fell by 50 TWh, from 2,627 TWh to 2,577 TWh, leading to a small fall in the gas share of the power mix from 34.3% in 2024 to 32.9% in 2025. That is a decline for the second year in a row, as the share in 2023 was at 34.5%.
At the same time, renewable power has grown consistently and generated almost as much electricity (2,544 TWh) as gas power (2,577 TWh) in 2025, helping clean power overtake fossil power in the G7 electricity mix.
Additionally, four G7 gas import-dependent economies — the UK, Germany, Italy and Japan — have remained below their historical gas generation peaks for at least five consecutive years.
Large emerging economies are growing with limited reliance on gas
Brazil, China and India are increasing electricity demand while maintaining relatively low levels of gas generation in their power systems. China’s gas share remained close to 3% (334 TWh) of the electricity mix in 2025, despite rapid demand growth. In India, gas power peaked in 2010 at 12.6% of the electricity mix, or 118 TWh, and has since declined to 2.3% (49 TWh) in 2025. In Brazil, the gas share peaked in 2014 at 13.7% of the mix (81 TWh), and currently stands at 7.3% (55 TWh).
All three economies rely to varying degrees on gas imports, while most new electricity demand is increasingly met by clean power. This suggests that even fast-growing electricity systems are not locked into gas reliance.
As renewable deployment accelerates alongside grid expansion, storage and other flexibility solutions, the future role of gas in the power sector is likely to become more limited, regionally uneven and increasingly shaped by energy security and economic considerations.
Supporting materials
About Ember
Ember is an independent energy think tank that aims to accelerate the clean energy transition with data and policy. Its vision is a clean, electrified energy system for all. It gathers, curates and analyses data on the global energy system, publishing this openly and accessibly. It uses data-driven insights to shift the conversation towards high impact policies and empower other advocates to do the same. Founded in 2008 as Sandbag, it formerly focused on analysing and reforming the EU carbon market, before rebranding as Ember in 2020. Its diverse team brings together energy analysts, data scientists, communicators and team-builders based around the world in over 20 countries, including Australia, Brazil, Colombia, Germany, India, Indonesia, Poland, South Africa, Türkiye, the UK and US.
Methodology
General methodology
Electricity generation data for countries, regions and the world is based on Ember’s yearly data. Data is gathered for 215 countries, with latest 2025 data for 91 countries, including national transmission system operators, statistical agencies and data aggregators such as ENTSO-E.
In some cases, published data was not available for the full reported timeframe; here, we have estimated recent years using Ember’s own generation forecasting model. Regional and world data is largely based on actual reported data, with Ember’s yearly data covering countries representing more than 90% of global electricity demand. Other countries are estimated.
A full methodology on data sources and methods is available here.
Note on electricity source classification
Bioenergy has typically been assumed (by the IPCC, the IEA and many others) to be a renewable energy source, as forest and energy crops can be regrown and replenished, unlike fossil fuels. It is included in many governmental climate targets, including EU renewable energy legislation.
Ember, therefore, includes it in “renewables” to allow easy comparison with legislated targets. However, we recognise that the IPCC-reported lifecycle carbon intensity of bioenergy is significantly higher than other renewables and nuclear, and this is incorporated into our power sector emissions estimate.
More information about Ember’s classification of electricity sources can be found in the full methodology for Ember’s monthly electricity data under “Fuel Types”.
Gas usage peak definition and caveats
If absolute gas generation remains below its peak output for at least five years since a country’s initial gas power peak, it is considered to have passed its peak.
Falls in gas generation for some economies may have been caused by external factors such as war, civil unrest or recession. For these countries, such as Ukraine or Yemen, data reporting can be limited, is largely based on estimates and has significantly lower accuracy. Some economies reported to be past a peak in gas power may have replaced domestic gas generation with electricity imports.
Acknowledgements
Ember: Richard Black, Raul Miranda, Rashmi Mishra, Dave Jones, Sarah Brown, Wilmar Suárez, Nicolas Fulghum, Libby Copsey, Lauren Orso, Muyi Yang, Neshwin Rodrigues, Ardhi Arsala Rahmani, Claire Kaelin
We thank our external reviewers: Toby Lockwood (CATF), Scott Smouse (Enerconnex Global, LLC, formerly with the US DoE), Sanjay Pande (Independent Researcher and Consultant, formerly with NTPC Limited, India)
Cover image
Canetti / Getty images
Related Content
Analysis
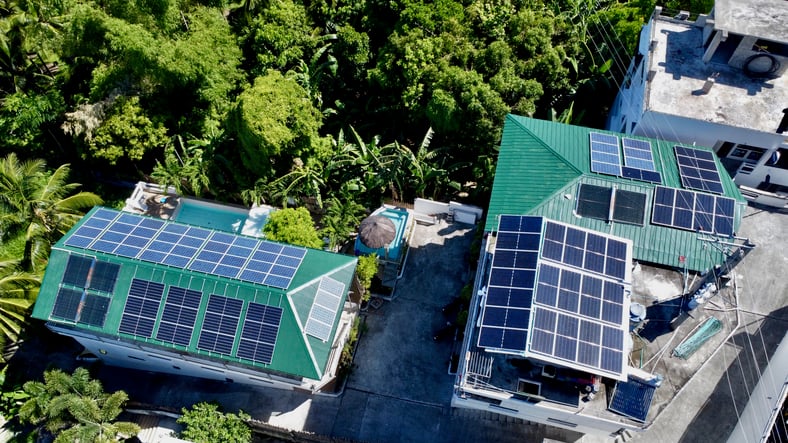
How the Philippines' rooftop solar surge can flip the energy emergency script
28 May 2026
Analysis
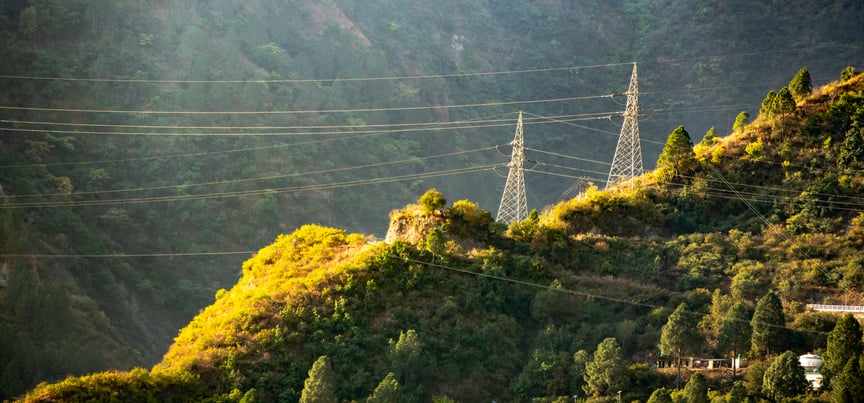
Rewiring Resilience: AI for Climate-Adaptive Power Grids in Asia-Pacific
21 May 2026
Analysis
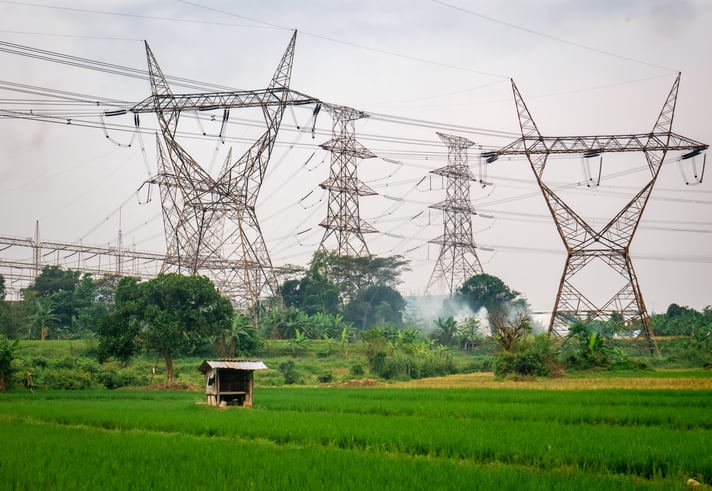
Transmission gaps are beginning to constrain India's rapid renewables integration
19 May 2026
Analysis
British power prices are increasingly independent from gas
13 May 2026