Supporting materials
Methodology
Generation and capacity
Ember sourced Indonesia’s generation and capacity data from the Handbook of Energy and Economics Statistics of Indonesia (HEESI), the latest version available from 2023. The Handbook includes on-grid generation and capacity data for all energy sources, and off-grid generation and capacity data for hydro, solar, wind and bio energy.
Explicit demand projections are only found in Cambodia, Indonesia and Singapore power development documents, while other countries are sourced from external studies.
For ASEAN, the latest generation data is projected by applying absolute changes by fuel from available annualised monthly data to historical annual values. In a few cases where a specific fuel is not available in monthly data, it is treated as showing no change in the annualised projection. As such, note that simply summing up monthly values will not produce the same results as our annual values for any given year.
Complementary energy sources
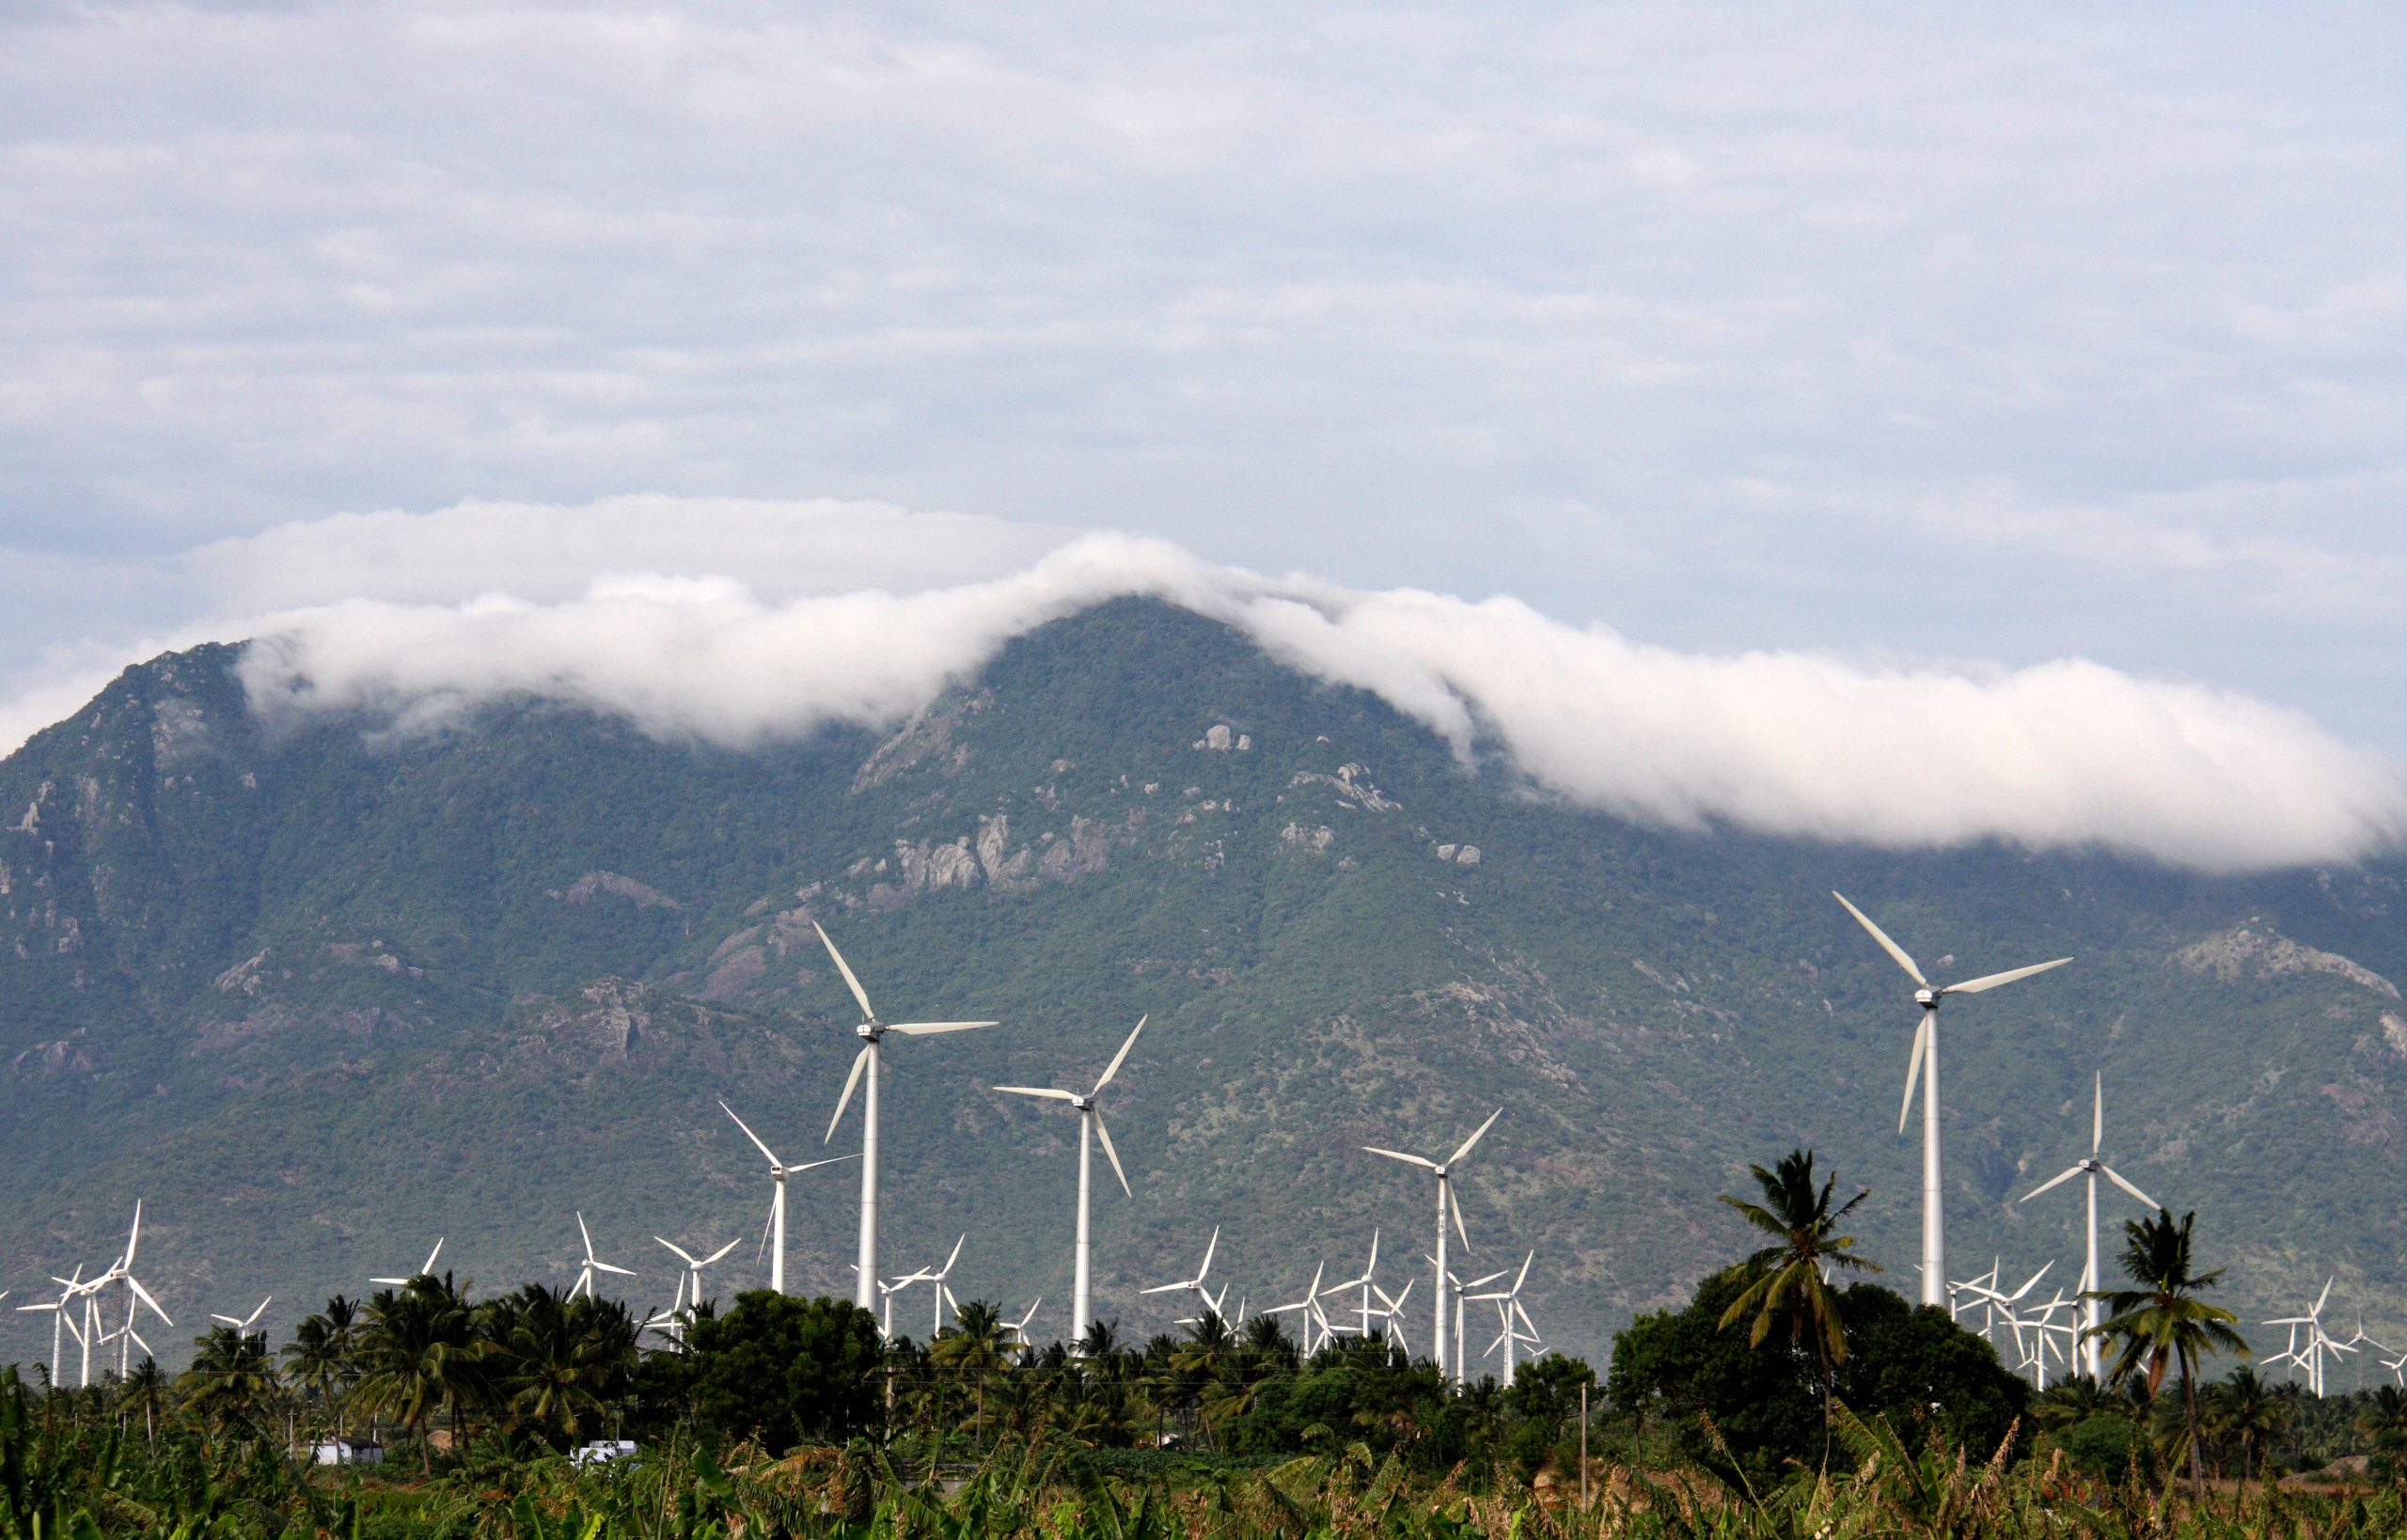
Capacity factors for wind and solar are calculated using hourly weather data from the ERA5 dataset collected from Open-Meteo. Weather data was sampled for representative locations for each of the examined regions. Wind capacity factors assume standard power curves for wind turbines using wind speeds at 100 m. Estimates for solar capacity factors are based on global tilted irradiance and temperature data in the representative locations, converted using this approach. Data for individual months comprises average monthly values for 2019-2024
The analysis locations are relatively representative of where wind and solar would be built across the countries. While actual deployment patterns could vary, this analysis serves as an approximation due to insufficient data on specific capacity build locations. Most locations used in this data are based on projects that are in operation, under construction or have been announced.
Levelized cost of energy (LCOE)
Ember calculates LCOE using NREL’s Annual Technology Baseline (ATB) 2023 Methodology. Some financial cases were taken from the ATB, and some were obtained from World Development Indicators, Climate Policy Initiatives (2023) for the cost of capital, PWC (2023) for Cambodia and NREL (2020) to reflect tailored countries’ situations and recent interest rate increases. Capacity factors for various energy technologies were adjusted using yearly historical data to better account for system degradation over its lifetime.
Emission reductions from renewable energy in ASEAN
The total registered emission reductions/carbon credits in global standards are derived from estimated annual carbon credits from projects with a status of at least “Registered” or “Certified” on Verra and Gold Standard registries, respectively.
The potential emission reductions from renewable energy power plants follow the Clean Development Mechanism (CDM) Methodology “ACM0002: Grid-connected electricity generation from renewable sources version 22.0”, where emission reductions equal baseline emissions minus project emissions. The total electricity generation per fuel per country serves the basis for this calculation due to limited generation data per plant.
Due to limited data, all hydro is assumed to be large hydropower plants in this analysis. Therefore, hydro and other technologies with more than 5% share of total installed grid capacity in each country are excluded from the calculation to maintain additionality assessment according to carbon standards criteria.
Baseline emissions are derived from electricity generation from renewables multiplied by the respective country’s grid emission factor value, as used by CDM projects based on a study by the Institute for Global Environmental Strategies (IGES).
According to the ACM0002 methodology, project emissions from most renewable energy plants are considered zero. However, acknowledging significant direct emissions from bioenergy, especially biomass power plants, an emission factor for biomass generation is assumed to be 230 g/kWh, the median value of lifecycle emissions according to IPCC.
Given limitations in power plant data, a more detailed study at the plant level is needed to calculate more accurate baseline emissions and project emissions according to the project context.
Acknowledgements
Contributors
Our sincere gratitude to Mr Souliya Sengdalavong from the Energy Policy and Planning Department of the Ministry of Energy and Mines of Lao PDR, Tharinya Supasa and Suttida Vanaphongsai from Agora Energiewende and Karolien Casaer-Diez from South Pole for their invaluable support in peer reviewing this report.
Special thanks to Rini Sucahyo for her unwavering support through editing and structuring the report, Richard Black, Aditya Lolla and Muyi Yang for their valuable comments and insights. Thank you to Nicolas Fulghum for his analysis on wind and solar complementarity and to Rio Pramudita for calculating the LCOE. A heartfelt gratitude to Oya Zaimoglu, Sam Hawkins and Chelsea Bruce-Lockhart, for their support in data validation and visualisation.
Cover image
The Nam Theun 2 power station at the foot of the Nakai Plateau escarpment in the Nam Kathang Valley, Lao PDR, uses water from a 3,500 million m³ reservoir
Credit: Rob Arnold / Alamy Stock Photo

Related Content