Chapter 2:
Research findings
Assessment on Power Sector Data Transparency in Asia
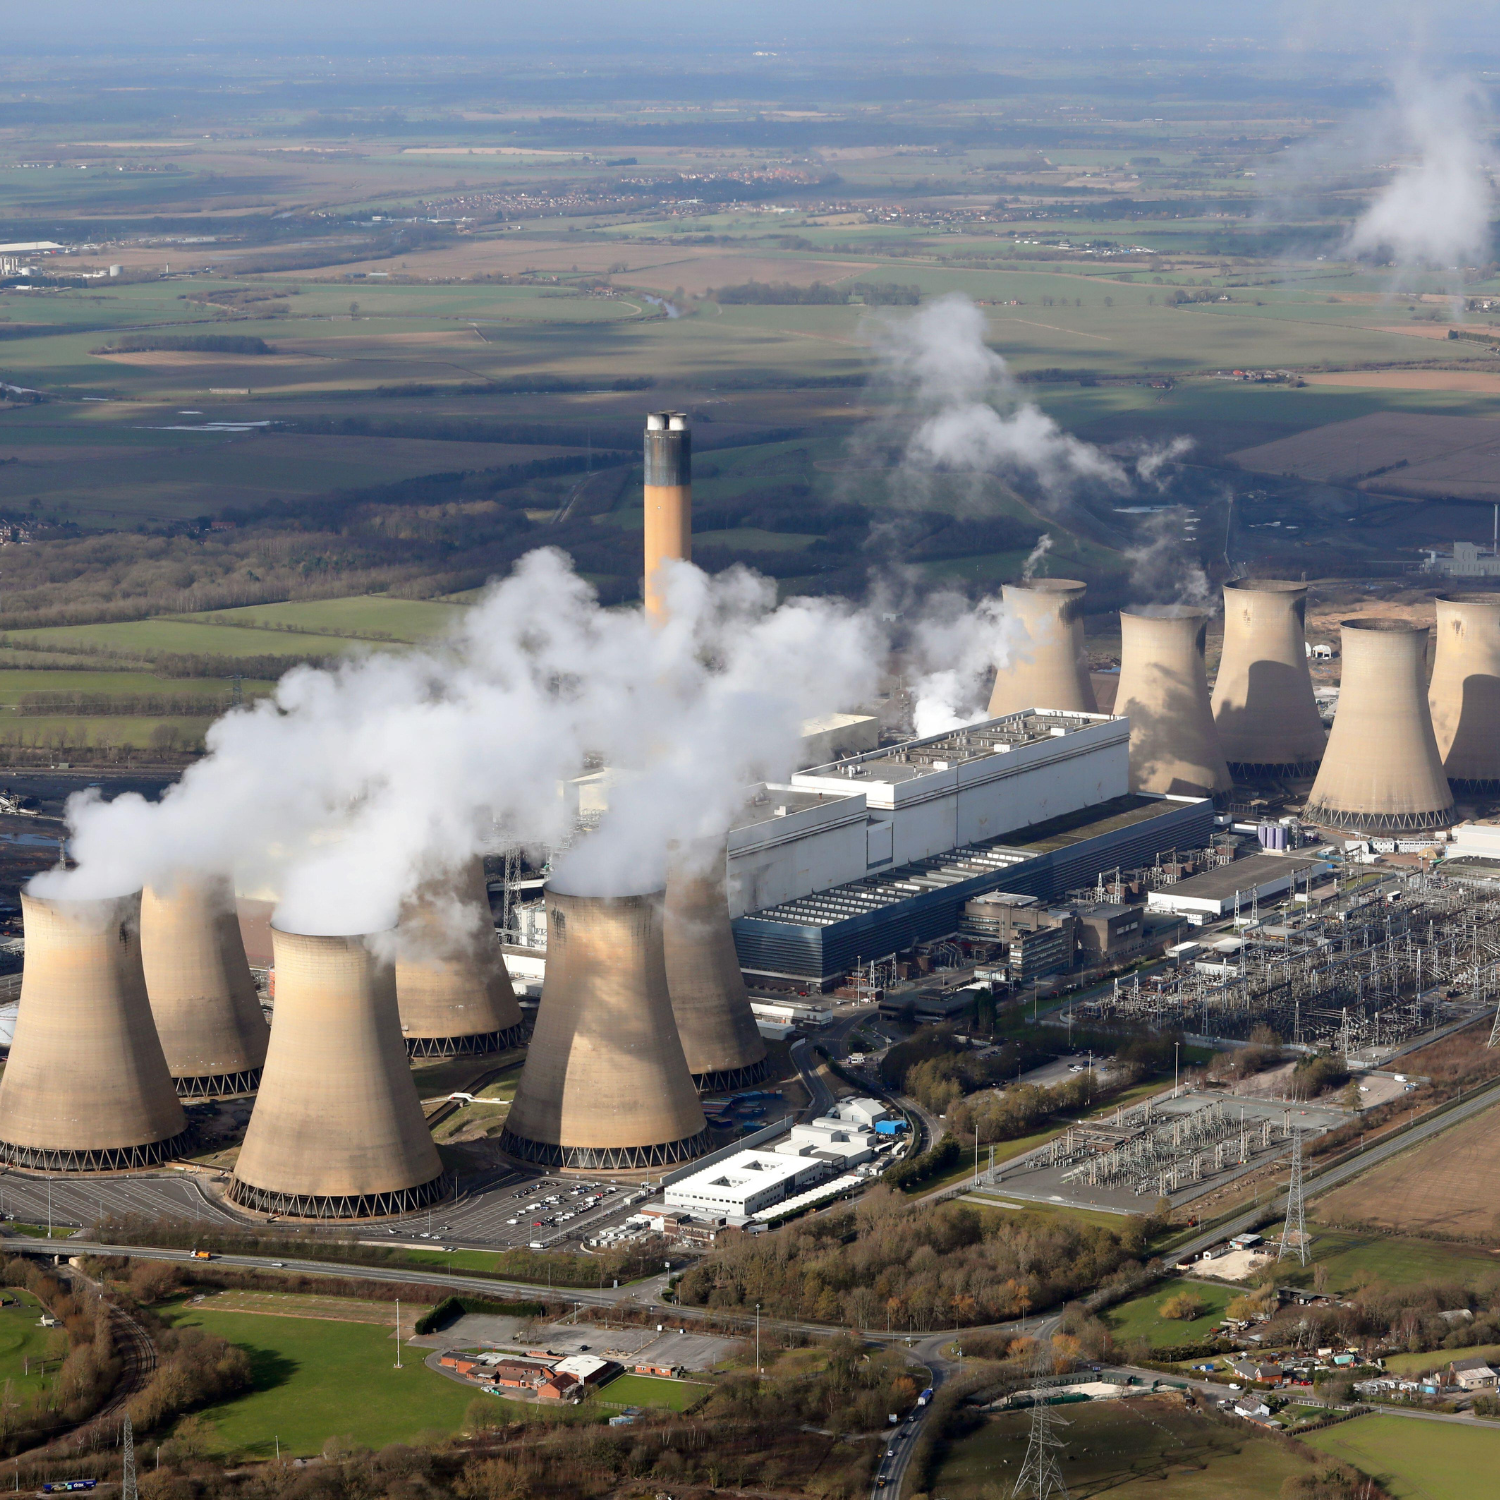
Analysis on the distribution of data transparency scores in Asia across six rating criteria reveals that there is not enough data to enable coal-to-clean electricity transition in the region.
This chapter provides a regional overview on the state of data transparency in the 39 Asian economies by income group and six rating criteria, followed by assessment of the top ten economies with the highest power demand in the region. The rest of the economy profiles can be found in the Appendix.
2.1
Regional Overview
Data transparency scores and data sharing practices vary strongly by geography, reflecting the region’s economic and political diversity. Generally, data transparency in Asia needs improvement. More than half (24 out of 39) of economies in Asia have insufficient or poor data transparency This means that there is little to no data about how the electricity needs of 684 million people are being met.
In general, higher income economies scored better than lower income economies. There is also a weak, but positive correlation between the size of power demand and overall scores. The median overall score of high-income economies is 3 (acceptable), and even higher when excluding small island nations. Lower and upper middle income economies both had a median score of 2 (insufficient). Five economies that had no data at all were spread across all income groups, although more concentrated in low to lower-middle income economies (Tajikistan, Turkmenistan, Afghanistan, Papua New Guinea, New Caledonia).
However, three lower-middle income economies like India, Bangladesh and Sri Lanka scored higher than any other upper middle income economies. The three economies have made notable progress since 2020. India has shown efforts to improve ease of access of their power sector data by creating a one-stop shop in collaboration with the private sector (more in chapter 3). Bangladesh provides daily generation data for each power plant and provides various metrics for the electricity market, including outage and day-ahead schedules through the central utility. Sri Lanka’s power generation data is even more granular at 15 minute intervals by power plant (More information in respective economy profiles).
High-income economies (South Korea, Australia and New Zealand) also stepped up in their efforts to improve data transparency. Both New Zealand and Australia scored “excellent” for their real-time, hourly generation data in addition to capacity, demand and other market data. South Korea began to provide estimates for off-grid solar, bumping up its score since 2020.
Scores on the Six Rating Criteria
Asian economies scored generally low on publishing lag, geographical granularity and time granularity criteria. Meanwhile, economies generally scored better on fuel breakdown and ease of access criteria.
1. Time granularity
Time granularity is an important aspect of data transparency for it allows deeper analysis of the power system. In particular, hourly data is required to mitigate intermittency of renewable sources by enabling various flexibility mechanisms, including demand response. Yet, only seven economies provided hourly data (Japan, Australia, Bangladesh, Singapore, New Zealand, Sri Lanka and Georgia), often with limited fuel breakdown. Half of the economies in Asia provide monthly or more time-granular data (ie. daily, hourly, 30 min interval, etc.). The most common time granularity of data was yearly (33%) and monthly (26%).
2. Publishing lag
Up-to-date data enables timely analysis of data, increasing relevance and responsiveness. However, 75% of economies do not make data available in a timely manner. Among them, fourteen economies had a time lag of more than a year. Only five economies made data available within a week (India, Australia, New Zealand, Bangladesh, Georgia). Economies that do not make up-to-date available also tend to score low on other rating criteria.
3. Geographic granularity
High geographical granularity enables system operators, analysts and researchers to understand where production is concentrated or lacking. This is crucial information in preventing grid congestion, generation forecasts and more. In particular, plant- or unit-level data are necessary to better understand changes in utilisation rates of different power plants and the overall operational status of the power system. Despite the importance, only 20% provided plant- or unit-level data. 45% of the economies made national data available. 23% provided regional generation data, some with limited data on marginalised regions.
4. Fuel breakdown
Calculating carbon intensity of the power sector requires information on the source of power generation. Generally, Asian economies scored better on this criterion. 40% of economies provided full fuel breakdown (coal, gas, hydro, nuclear, solar, wind, bioenergy, other renewables, other fossil) or more granular. 20% provided partial fuel breakdown, which requires users to estimate fuel breakdown based on arbitrary assumptions. Individual source research revealed that there are inconsistencies in the reporting depending on timescale. For example, Japan does not make thermal power generation breakdown available for hourly level data, although it is made available in their monthly reporting.
5. Ease of access
Making data easily accessible in a machine-readable format is a technical requirement for improving data transparency. Half of the economies made their dataset openly accessible in xlsx or csv files or through public API. However, one third of the economies still provided data in pdf format or even as a scanned image of a printed copy, which is difficult for users to process for their own use. There were other challenges that made the ease of access challenging. Same data points (ie. generation or capacity) are made available by ministries of respective regions or fuel. This leaves the task of data aggregation to users, adding an extra layer of challenge in accessing the data for the economy or the power sector as a whole.
6. Additional data
While this study focuses on generation data, other power sector data (capacity, demand, consumption by sector, price, etc.) are required to understand the power market as a whole. Economies that scored well on other criteria tended to score higher. India, South Korea, Taiwan, Australia, the Philippines and New Zealand provided a full suite of power market data.
2.2
Economy Profiles
This section provides detailed information on data sources of key Asian economies (China, India, Japan, South Korea, Indonesia, Australia, Viet Nam, Thailand, Malaysia, Pakistan, the Philippines, Bangladesh, Singapore, New Zealand, Myanmar, Sri Lanka). For others, please refer to the Appendix or the Asia Power Data Finder.
China
- NBS, China’s National Bureau of Statistics, is the main source of generation data. They release data in the form of monthly press releases and through a data portal which can be tricky to find with the following characteristics:
- Annual reports going back to 2000 (2012 for regional reports) and monthly reports from the past 36 months
- Data broken down into these categories for both National and Regional datasets
- thermal power, hydroelectric power, nuclear power, wind power, solar power
- Data is not downloadable without a login
- Yearly capacity data
- China Power, China’s Electricity Development Power Association provides more granular capacity data as well as original reporting on provincial data including solar generation and solar cell production figures.
- Other data sources:
India
- NPP, The National Power Portal provides daily conventional fuel generation and capacity data broken down by “Thermal,” “Nuclear,” and “Hydro.” Data is given for different regions and as a sum for all of India. These are not the same as Indian states, and are instead aggregated to Northern, Western, Southern, Eastern, and North Eastern sections.
- MERIT, Merit Order Despatch of Electricity for Rejuvenation of Income and Transparency provides daily plant-level data for most of India including a full regional breakdown. Fuel breakdown is still limited to Thermal, Gas, Nuclear, Hydro and Renewables. All data is deleted after one month (no archive is kept).
- CEA, India’s Central Electricity Authority has monthly renewable energy generation with full breakdown.
- Other data sources:
- MNRE, The Ministry of New & Renewable Energy, provides monthly RES capacity by state. Fuel breakdown varies and sometimes skips a month. They don’t archive their data either.
- GRID-India (formerly POSOCO), India’s National Grid Controller, has daily reports broken down by high level fuel type back to 2013. Has fully disaggregated capacity data but only renewable disaggregated energy data. Also has peak demand met, daily maximum demand met, and inter-regional trade.
Japan
- REI, The Renewable Energy Institute is Japan’s main source of generation data. They publish their data sporadically with usually 2-3 months time lag through a downloadable dashboard with the following characteristics:
- Hourly reports going back to 2016
- Fuel breakdown including
- Pumped Hydro (pump up and generate), Nuclear, Thermal, Hydro, Geothermal, Biomass, Wind, SolarPV.
- They also publish hourly demand alongside generation data.
- Data is broken down into regions from both Eastern (50 Hz) and Western (60 Hz) halves.
- Monthly generation data with thermal breakdown and equal renewables breakdown is available from Enecho, Japan’s Agency for Natural Resources and Energy. There however are issues with a long time lag of three plus months.
- OCCTO, The Organisation for Cross-regional Coordination of Transmission Operators, publishes quarterly reports sporadically and annual reports back to 2015.
- FEPC, The Federation of Electric Power Companies of Japan, provides historical generation and capacity data before 2013 back to 1963.
South Korea
- KEPCO, The Korea Electric Power Corporation, is South Korea’s best source of energy data. It’s monthly reports are available through Excel and pdf reports, normally with only a few months time lag, through a portal with the following characteristics:
- Monthly generation, capacity, and other market data going back to 2003
- Generation data has plant-level data
- Full fuel breakdown
- Additional financial data
- Other data sources include KPX Epsis, the Electric Power Statistics Information System. Peak demand and installed capacity is published on a daily basis in real time. They also provide annual generation on plant-level, and five-minute real time generation data without fuel breakdown.
- KESIS also provides monthly energy statistics in pdf and csv files on the energy sector as a whole.
Indonesia
- ESDM, The Ministry of Energy and Mineral Resources of the Republic of Indonesia is one of two public sources of generation data in Indonesia. Monthly generation data is collected, but not open to the public. ESDM publishes annual reports in pdf formats, often with a year or more time lag, with the following characteristics:
- Annual generation going back to 2012
- Full fuel breakdown, including geothermal
- Capacity data with full fuel breakdown
- Additional financial, demand, and consumption data
- The other source includes the Central Bureau of Statistics, which again publishes annual data with a time lag over one year. The Bureau also uses xlsx formatting for their reports, with the following characteristics:
- Annual generation going back to 1995
- No fuel breakdown
- Capacity data only with fuel breakdown
Australia
- OpenNEM, an open platform for National Electricity Market Data is Australia’s best source of generation data despite omitting the Northern Territory. It operates in real time api with downloadable csv in real time with the following characteristics:
- 5-minute real time generation for the last seven days. Daily data is available for the past year. Monthly, quarterly, and annual data goes back to 1998.
- Full fuel breakdown, including disaggregation between rooftop and utility solar, different gas power plants, and black and brown coal. Also included in the breakdown is generation from batteries discharging
- Unit level generation data through a map dashboard when a fuel type is clicked
- Capacity data at plant level is available through this same dashboard
- Additional demand and financial data is also provided on the homepage
- NTESMO, the Northern Territory Electricity System and Market Operator publishes 5-minute demand and price for Alice Springs, the second largest city, and daily demand and price data for the rest of the region. There is no fuel breakdown and no capacity information.
- Other data sources:
- AEMO, The Australian Energy Market Operator publishes Quarterly Energy Dynamics, pdf reports detailing market dynamics and trends with attached xlsx files with data from graphs and tables. Has also niche datasets for things such as rooftop solar.
- Australia’s Department of Climate Change, Energy, the Environment and Water has data on electricity generation back to 1973. It also has full fuel breakdown for the regional (State) level. Capacity data is only available at national level and without fuel breakdown.
- ABS, The Australian Bureau of Statistics also publishes a biannual report which holds data on estimates of energy assets, and physical/monetary supply and use, as well as key indicators. The next release is on 27/04/2023. Tables can be downloaded as xlsx or csv.
Viet Nam
- GSO, The Viet Nam General Statistics Office has basic generation data in xlsx format with a time lag of 1-2 months. Data is held within the Socio-economic situation reports.
- Monthly generation data going back to 2014
- No fuel breakdown
- No regional breakdown (only national-level data)
- No capacity data
- Another source is from EVN, The Vietnam Electricity Group also provides monthly generation data in the form of press releases, although the time lag varies and is sometimes greater than one year:
- The generation data within these press releases goes back to 2010
- Full fuel breakdown
- No regional breakdown (only national-level data)
- Some capacity data
- Other data sources:
- MOIT, The Ministry of Industry and Trade of the Socialist Republic of Vietnam has press releases on energy which include various capacity and generation information. Also has daily basic updates on daily output by region. The record only goes back to 2021. Also has daily basic updates on daily output by region. Statistics are only available when the language is set to Vietnamese.
Thailand
- EPPO, Thailand’s Ministry of Energy is the best source of generation data. It provides various statistical reports on energy in xlsx format with a couple months time lag with the following characteristics:
- Monthly generation data going back to 1986 is available through the report “Power Generation by Type of Fuel”. There is no regional breakdown (only national-level data is available).
- Full thermal breakdown is available, but apart from hydro, renewables data is aggregated.
- Capacity data is only available as monthly for the year of 2023, otherwise this is given yearly with regional breakdown but no fuel breakdown
- Additional demand, consumption, and import/export data is available.
- Other data sources:
- DEDE, The Department of Alternative Energy Development and Efficiency is only accessible in Thailand or via a VPN. It provides monthly energy statistics, including disaggregated renewable power generation data with a few months time lag. There is no regional breakdown.
- EGAT, The Electricity Generating Authority of Thailand provides generation and capacity data for non-renewables from 1969-2021 at yearly level. These are only available on a specific webpage located in the site map at the bottom of the page. Monthly data, found through the ‘latest statistic’ is available, but without an archive.
Malaysia
- Single Buyer Malaysia conducts electricity planning and manages electricity procurement services for Peninsula Malaysia. They provide Malaysia’s best open access generation data through an online downloadable dashboard updated in real time, but only cover Peninsula Malaysia. Occasional use of VPN to access Monthly Data is necessary depending on location. It has the following characteristics:
- Hourly generation with week and month ahead forecasts back to 2018.
- Full breakdown for Peninsula Malaysia (there are no Nuclear, or Wind power plants) including Coal, Gas, Hydro, Solar, and others.
- No capacity data is available through this resource.
- Additional real time demand data, financial data, dispatch scheduling model and 10 year outlook.
- GSO, Peninsula Malaysia’s Grid System Operator has hourly real time generation data for Peninsula Malaysia, but it is not downloadable in csv/xlsx format. It has additional levels of breakdown to Single Buyer Malaysia, including co-gen, oil, and tie-line. It also has further breakdown of solar generation by region of peninsular Malaysia. GSO also possesses capacity data under ‘system data->power station information’ with plant-level capacity data by fuel type. Additional import/export data is also available.
- MEIH, the Malaysia Energy Information Hub is Malaysia’s only public national source for national data, although it has a long time lag of over two years and only partial fuel breakdown (only thermal). Data is available in xlsx format back to 1990. Additional capacity, demand, and consumption by sector data is also available and they provide a list of all renewable energy projects in pdf format.
- ST, the Suruhanjaya Tenaga Energy Commission also provides generation and capacity by plant and fuel types for all regions (Peninsular, Sarawak and Sabah) at yearly level with over two years of time lag. There is also no breakdown for renewables, and it is not accessible from abroad.
- Finally, Sarawak Energy, Sarawak’s only utility company reports yearly generation data in their annual report in pdf format. There is also a lag here of roughly two years.
Pakistan
- NEPRA, the National Electric Power Regulatory Authority of Pakistan publishes data from their state of industry report through an online non-downloadable portal. Despite having a near one year time lag, it is Pakistan’s best source of electricity data and has the following characteristics.
- Yearly generation going back to July 2017, although newer data is sometimes made available through their press release page.
- Full plant-level breakdown including what fuel type the plant is.
- Both installed and dependable capacity data as well as plant utilisation as a percentage with complete fuel breakdown.
- Additional fuel price adjustment, economic merit order, and specific hydro generation data.
- Another data source is PBS, the Pakistan Bureau of Statistics which provides very limited energy data in tables from 2005-2015, and it no longer seems to be updated. There are annual reports covering energy generation from 2006 to 2021, but these have less structured information compared to NEPRA.
The Philippines
- NGCP, the National Grid Controller of the Philippines is the best generation data provider through an online operations summary with downloadable data in xlsx. Datasets are up to date to December 2022, and have not yet been updated to include 2023. It has the following characteristics:
- Monthly generation back to 2013
- Complete fuel breakdown is given for three islands of the Philippines, Luzon, Visayas, and Mindanao.
- Some limited capacity data, system peak demand data, energy delivery per region and hourly demand, transmission assets, and system loss.
- Other data sources include:
- IEMOP, the Independent Electricity Market Operator of the Philippines is the best source of capacity data, which provides this daily in a csv file. They also have fine minute demand data through a dashboard, which is not downloadable nor archived. Daily generation data is only provided at regional level, without any fuel breakdown.
- The Filipino Department of Energy which provided annual statistics back to 2003, although they have not been updated to 2021. They also have annual reports go back to 2016.
Bangladesh
- PGCB, the Power Grid Company of Bangladesh is the only real provider of energy data in Bangladesh. They provide generation reports as spreadsheets through the reports section of their website published in real time with the following characteristics:
- Daily generation data back to 2014 including forecast data for the next day.
- Data is disaggregated by plant and grouped by region, including Dhaka, Chattogram, Cumilla, Mymensingh, Sylhet, Khulna, Barisal, and Rajshahi.
- For each plant, its generation fuel type is given.
- There is no capacity or price data, but there is demand data.
- BERC, the Bangladesh Energy Regulatory Commission also provides data but only has annual reports as a scanned image back to 2012. These reports are only available in Bengali.
Singapore
- EMC, The Singapore Energy Market Company is the best source of generation data for Singapore. They publish data through the ‘Market Trading Reports’ section of their website with roughly one week’s time lag with the following characteristics:
- National generation data at 30-minute intervals back to 2013
- No fuel breakdown apart from high-level in 30-minute data, but does provide solar generation and other shares of generation in monthly reports
- Additional capacity by plant type, net imports, and price data
- Other sources include the EMA, Singapore’s Energy Market Authority which provides capacity, demand, emissions, generation and other power market data at various levels of temporal granularity.
New Zealand
- New Zealand’s Electricity Market Information, EMI, was one of the only sources to score a ‘5’. It publishes open access wholesale datasets each month in csv format, with less than a month’s time lag. It’s data has the following characteristics:
- Unit-level, half-hourly generation data back to 2000.
- Complete fuel breakdown including New Zealand’s geothermal energy sector.
- Additional capacity, demand and price data.
- Transpower did better than EMI to publish regional, real-time hourly generation data but is hindered by the fact it is only a dashboard, and has no archive of data. It is also missing generation from biofuels. Em6, a paid version of the service, does have an archive.
- Other sources include:
- The Ministry of Business, Innovation and Employment, MBIE which provides monthly, national electricity generation and consumption with a six month time lag back to 1974.
Myanmar
- Myanmar also had only one discoverable dataset. This was provided by the Central Statistical Organisation, CSO. It provides various electricity data through pdf reports called ‘Selected Monthly Economic Indicators’ which are available as pdf’s with a time lag of 6-8 months. These are available in both English and Burmese with the following characteristics:
- Monthly, national generation data going back to 2013
- Complete fuel breakdown including thermal, diesel, hydro, gas, and solar.
- Additional capacity, demand, and consumption by sector data.
Sri Lanka
- The Public Utilities Commission of Sri Lanka, PUCSL, was the only discoverable dataset for Sri Lanka. Through a general information page, they have dispatch and generation reports in pdf format with only a few days time lag. They have the follow characteristics:
- 15-minute plant-level generation data with an archive back to May, 2020.
- Strong level of fuel breakdown, including coal and other fossil fuels, as well as hydro, wind, solar, and biofuels.
- There is no additional data, including no capacity data.

Related Content