Chapter 1:
Headline Trends
In this chapter
EU-27 Power Sector in 2021
1.1
Electricity demand
EU-wide demand returned to pre-pandemic levels
In 2021, the impact of the Covid-19 pandemic on EU electricity demand was quite limited. This is in sharp contrast to 2020, when the pandemic’s impact on electricity demand – and subsequently on electricity production – was the major driver of EU electricity system developments. Electricity demand fell during lockdowns in 2020, especially in the first wave of the pandemic, as offices closed, factories were shuttered and people were confined to their homes.
After falling 3.5% (-100 TWh) between 2019 and 2020, electricity demand recovered nearly all of these losses in 2021, rising 3.4% (+95 TWh) year-on-year and reaching almost the same levels seen before the pandemic in 2019. Overall though, 2021 was a colder year than 2019, which would normally imply higher demand in 2021 all else equal. This indicates that underlying (weather-corrected) electricity demand has yet to fully bounce back from the pandemic.
Demand recovery varies at a national level
Despite EU-wide electricity demand returning to near pre-pandemic levels, the trends vary considerably at a national level. Electricity demand remained notably weaker than pre-pandemic levels in Spain (-2%) while it grew strongly in Poland (+3%), Sweden (+4%) and Denmark (+7%).
1.2
Fossil Fuels
Fossil fuel power grew in 2021 but remains below pre-pandemic levels
In 2021, EU-27 electricity generation from fossil fuels rose 4% (+43 TWh) year-on-year to 1069 TWh. This was primarily due to a 95 TWh (+3%) rise in electricity demand, which recovered after falling during the pandemic. Electricity generation from fossil fuels remained 6% lower (-64 TWh) than before the pandemic in 2019, as a result of continued growth in renewables (especially wind and solar) over the two-year period.
Fossil fuels still accounted for 37% of EU electricity production in 2021, down from 39% in 2019. Fossil gas power declined 8% since 2019, generating 18% of EU electricity (524 TWh). Coal generated 15% of EU electricity (436 TWh) and has fallen just 3% since 2019, compared to 29% in the two years prior.
Energy crisis made gas power more expensive than coal by mid-2021
The price of fossil fuels soared in 2021, which upended the electricity market. A combination of factors caused gas prices to rise 585%, resulting in one of the largest energy price shocks since the OPEC oil embargo of 1973. While gas was the main mover, the price of coal and carbon also increased sharply.
Consequently, the cost of generating electricity from fossil gas plants increased almost sevenfold, leading to skyrocketing electricity prices across Europe. From July, the cost of generating electricity from fossil gas was more expensive than coal. The gap widened as the year progressed, despite rising carbon prices, as the gas price exploded.
Renewables replaced gas not coal in the second half of 2021
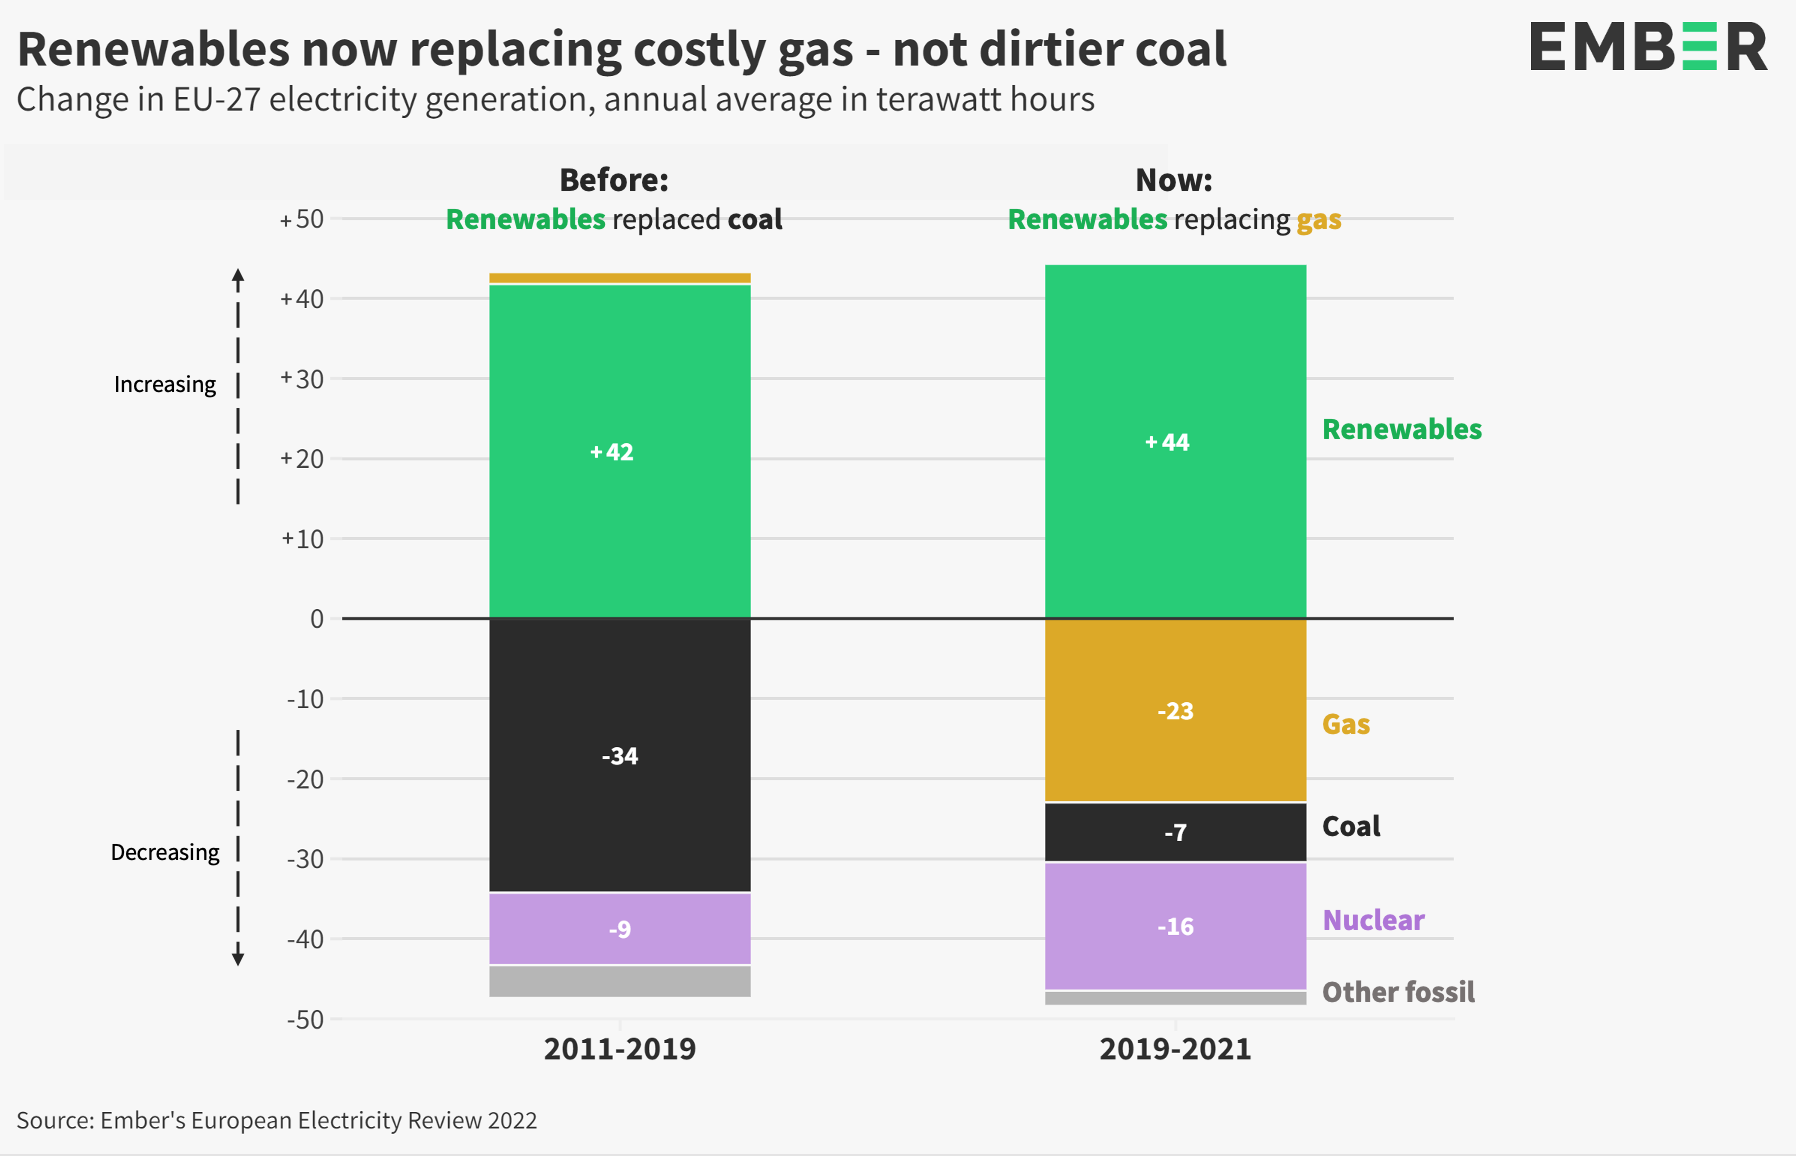
Using 2019 as the baseline, the growth in renewables output predominantly replaced coal in the first half of 2021. However, in the second half of the year, with fossil gas power more expensive than coal, new renewable output replaced fossil gas instead. Furthermore, the second half of 2021 saw some direct replacement of fossil gas with coal, equivalent to approximately 5% of total coal power generation in 2021.
Paradigm shift as new renewables replaced gas – not coal
The new pricing dynamic meant that new renewables predominately replaced expensive fossil gas instead of more emissions-intensive coal generation.
Europe’s renewable electricity continues to expand, with average annual growth of 44 TWh in the last two years. More than half (52%) of this new renewable generation since 2019 replaced gas, and a third replaced nuclear, while only a sixth replaced coal. However, prior to this, from 2011 to 2019, over 80% of new renewables replaced coal. Increased nuclear outages and plant closures since the end of 2019 also reduced the extent to which coal generation fell.
The largest falls in fossil gas compared to 2019 were seen in the Netherlands (-17 TWh / -24%) and Spain (-15 TWh / -18%), the two countries with the strongest growth in renewable generation (primarily wind and solar), but there were also notable declines in Belgium (-17%) and France (-14%).
Coal power only declined in countries that closed coal power plants
Although new wind and solar growth since 2019 has predominantly replaced fossil gas, a number of countries have managed to decrease their coal burn. Coal power output in Spain has almost halved since 2019, following the closure of 6.5GW of coal capacity – over half of the fleet – in the last two years.
It is a similar story across the other countries where coal has fallen – the declines have mostly been driven by coal plant closures. In the last two years, Czechia, Greece, Italy, Romania and Portugal all retired about 1-2GW each (including power plants retired at the end of 2019). The closures in Portugal made it only the 4th country to go completely coal-free.
Unfortunately, the impact of coal closures in some countries was mostly offset by the increased use of existing coal power stations elsewhere in the EU.
Most notably, Poland’s coal power output has increased 7% (+8 TWh) since 2019, as local production increased at the expense of imports from EU neighbours. Poland even became a net exporter of electricity from August 2021 after 53 continuous months of imports. Ireland’s coal power output also increased sharply as coal replaced gas, which was exacerbated by a string of gas plant outages.
1.3
Renewables
Renewables break new records but growth slows
In 2021, electricity generated from renewable sources in the EU reached a new high of 1068 TWh, a 1% increase (+12 TWh) year-on-year, and a 9% (+88 TWh) increase compared to 2019. Renewables accounted for 37% of EU electricity production in 2021, up from 34% in 2019.
Wind and solar power have been responsible for the majority of the renewables growth since 2019. Wind and solar output reached another new record in 2021 (547 TWh), for the first time generating more electricity than fossil gas (524 TWh). Wind and solar generated 19% of EU electricity in 2021, up from 17% in 2019.
However, year-on-year wind and solar output growth of 1% was modest, due to lower wind speeds, which were below average across the EU, most notably in Germany. 2020 was also a windy year, especially the first quarter, amplifying the difference in 2021. EU wind power output saw a small fall year-on-year (-2% / -10 TWh), but this is equivalent to just 0.3% of total EU electricity production. A 10% (+14 TWh) increase in solar output, which is booming across Europe, more than offset the decline in wind, to ensure continued growth in wind and solar.
It is not unexpected to see year-on-year variations in output from renewable sources like wind and solar. Modernised, flexible grids supported by long-term energy storage (such as green hydrogen) will ensure future energy security as the share of variable sources increases.
Installed wind and solar capacity across the EU continued to grow in 2021. Wind and solar capacity grew an estimated 8% (+15 GW) and 16% (+22GW) respectively.
Wind and solar delivered throughout the energy crisis
The electricity price crisis began in earnest in the second half of 2021, as fossil gas price rises accelerated. Despite claims to the contrary, wind and solar power have delivered throughout the crisis. EU wind and solar power output was the highest on record for each month in the second half of 2021 except September. Despite concerns raised about low wind output in particular, wind output alone grew 2% in the second half of 2021 compared to the same period in 2020.
In reality, the extraordinary rise in fossil fuel prices, especially fossil gas, is by far the largest driver of the electricity price rises seen this year.
The EU has three new engines of wind and solar power growth
Spain, the Netherlands and Greece have become the new engines of EU wind and solar power growth. In each country wind and solar power’s market share grew by about 10 percentage points in just three years, after slow to minimal growth in the previous 3 years.
Wind and solar provided a third of Spain’s electricity in 2021, and at least a quarter in the Netherlands and Greece. Together these countries have been responsible for over half of all growth in wind and solar output in the EU since 2019, despite accounting for just 16% of electricity demand.
Wind and solar growth in these countries is being driven by supportive policy frameworks, falling costs and ambitious targets. Both Spain and the Netherlands plan to provide about two-thirds of their electricity from wind and solar by 2030, with Greece targeting 50%. This is in sharp contrast to countries such as Poland and Italy, where renewables are still not expanding fast enough, or countries such as Bulgaria, Czechia and Romania which have failed to deploy almost any wind and solar.
Only modest changes for the other renewable sources
After seeing very limited growth since 2015, bioenergy grew 4% (+7 TWh) between 2019 and 2021, almost entirely driven by new biomass co-firing in coal power stations in the Netherlands. Hydro output was normal in 2021 and broadly unchanged year-on-year, but it was 9% (+28 TWh) higher than 2019 which was a relatively dry year.
Note: bioenergy is treated as a renewable energy source in EU legislation, but recent scientific evidence shows that many forms of bioenergy risk significant carbon emissions.
1.4
Nuclear
Nuclear recovers from its pandemic slump but remains in long-term decline
In 2021, nuclear power stations in the EU produced 733 TWh of electricity. This was 7% (+47 TWh) more than 2020 as French and Belgian power plant availability improved. However, nuclear output remained 4% lower (-32 TWh) than in 2019, primarily caused by the planned closure of nuclear reactors. Nuclear accounted for 26% of EU electricity production in 2021, down from 29% ten years ago.
The declines in nuclear power output since 2019 were led by France (-18 TWh), Sweden (-13 TWh) and Germany (-6 TWh). All three countries have closed at least 1.8 GW of nuclear capacity since the end of 2019. This was only partially offset by improved output in Belgium (+7 TWh).
The long-term, structural decline of nuclear power in the EU has slowed power sector decarbonisation. Some of the growth in renewables output is needed to replace lost nuclear output, slowing down the replacement of fossil fuels. This trend looks set to continue in the near future (see Emerging Trends).
1.5
Emissions
EU power sector emissions are not on track for 1.5C
According to the International Energy Agency (IEA), limiting global temperature rise to 1.5C and avoiding the worst impacts of the climate crisis, will require power sector emissions to reach zero by 2035 in advanced economies (which includes the EU). Using 2019 as the baseline (to filter out the pandemic 2020 outlier), power sector emissions would need to decline at an average annual rate of 6% per year to reach zero emissions by 2035.
Ember estimates that (direct) greenhouse gas (GHG) emissions from the EU power sector were 700 MT CO2eq in 2021, equivalent to an average annual decline of just 2.5% per year since 2019. Therefore, EU power sector emissions fell at less than half the rate needed to stay on track for 1.5C.
Emissions are not falling fast enough because clean power isn’t replacing fossil fuels fast enough. And where it is, it’s now replacing gas rather than more emissions-intensive coal, further slowing progress.
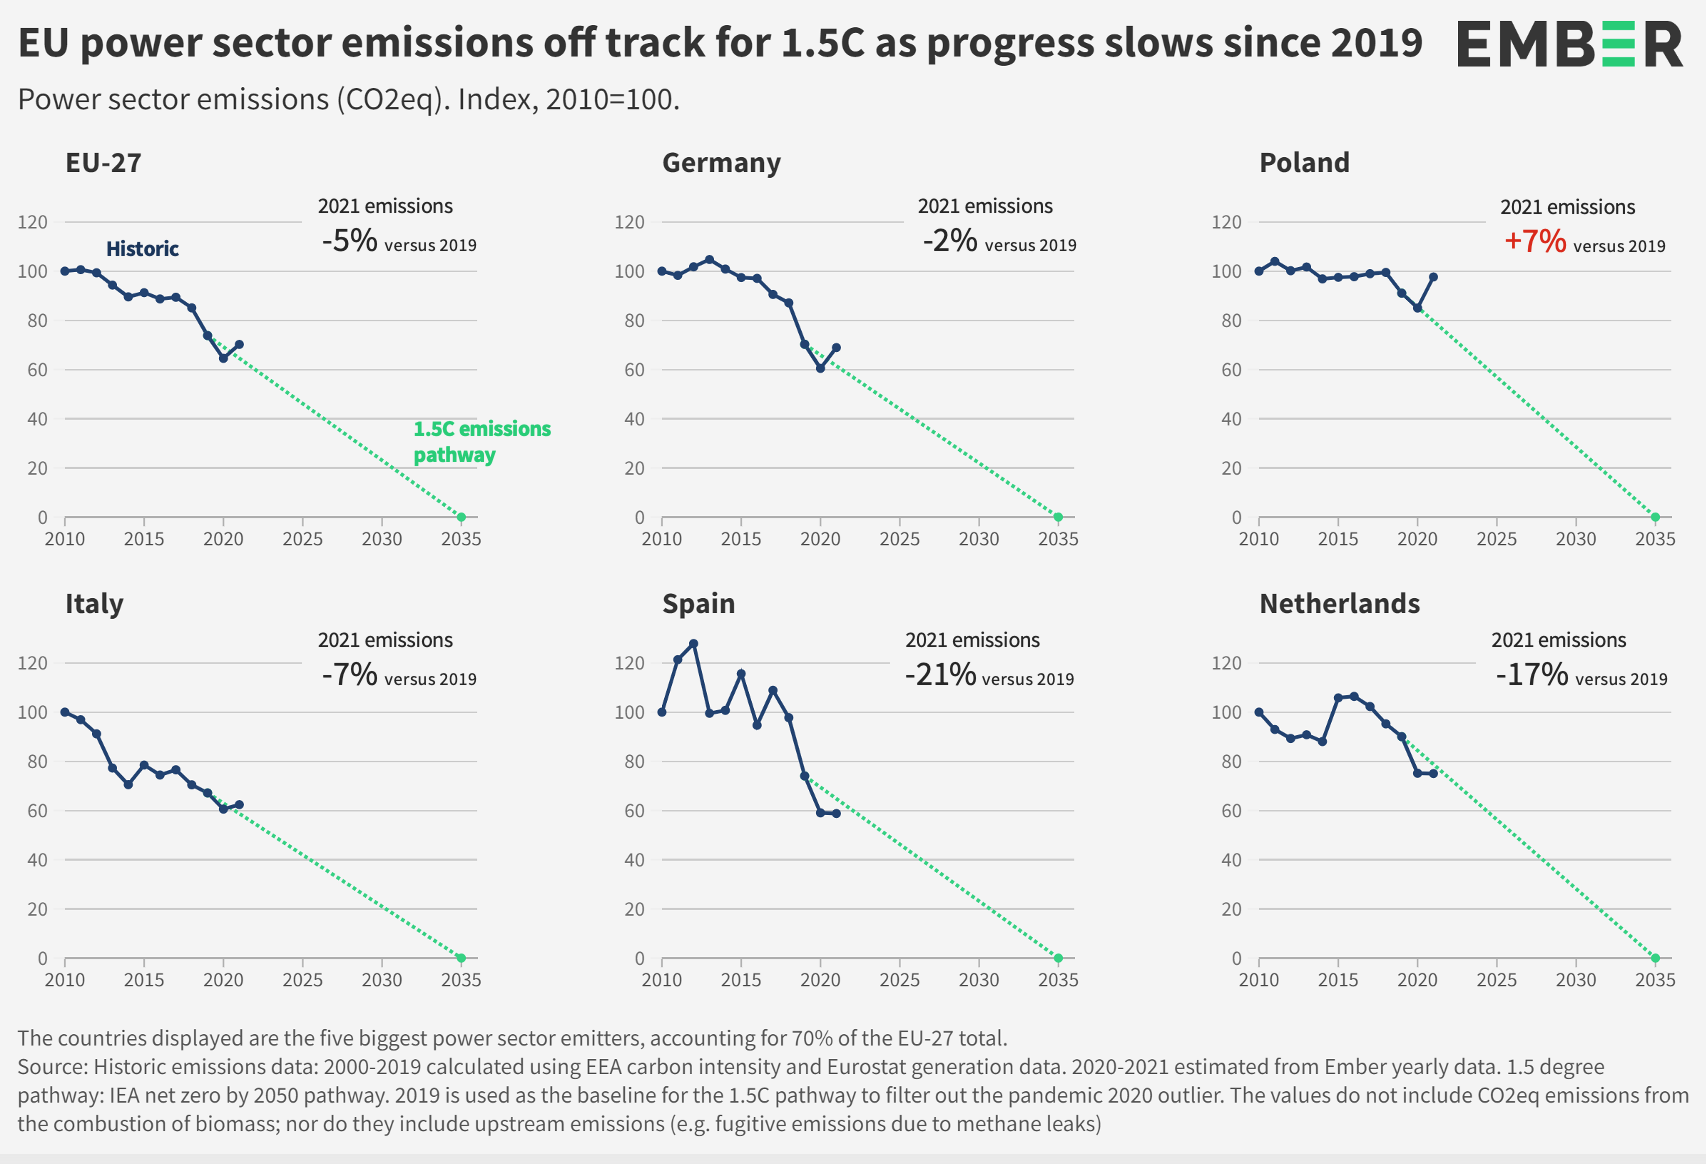
Spain was the largest contributor to EU power sector emissions reductions, and most countries saw power sector emissions declines compared to 2019. Poland was a notable exception, and was by far the largest drag on overall progress, with emissions increasing 7% compared to 2019, although Bulgaria, Denmark and Ireland all posted large emissions gains due to coal increases.
1.6
Emissions intensity
EU electricity is cleaner than 2019
The emissions intensity of EU electricity generation (the amount of GHG emitted per unit of electricity) declined from 253gCO2eq/kWh in 2019 to 241gCO2eq/kWh in 2021. There remains a huge gulf between the cleanest and dirtiest electricity grids across the EU.
Related Content
