Chapter 4:
Global Electricity Source Trends
Analysis of the different electricity sources in 2023
Data on global electricity generation from solar, wind, coal, gas, hydro, nuclear and bioenergy in 2023, with an overview of changes and trends over the last two decades alongside the role of each source in reaching net zero. We have ordered the sections according to the fastest growing sources of electricity.
4.1
Solar
Key highlights
01
02
China made up more than half of record solar growth in 2023
03
Solar added twice as much new electricity in 2023 as coal
Solar: Current status
Solar produced a record 5.5% of global electricity in 2023
Solar power produced a record 5.5% (1,631 TWh) of global electricity in 2023. As of 2023, 33 countries generated more than a tenth of their electricity from solar.
Solar provides clean power that can be deployed quickly and locally to the demand source. New solar power produces the cheapest electricity in history, according to the IEA. As such, together with wind, solar will form the backbone of the future electricity system, providing nearly 70% of global electricity by 2050.
In 2023, China generated the most electricity from solar power (584 TWh), ahead of the United States (238 TWh). China’s generation made up more than a third (36%) of global solar generation. India overtook Japan to become the third largest solar power generator in 2023 (113 TWh).
Chile continued to have the highest share of solar generation in the electricity mix, increasing to 20% in 2023, from 17% the previous year. This ranking excludes countries with less than 5 TWh of solar generation. Greece had the second highest share (19%), followed by Hungary (18%) and Netherlands (17%).
On a per capita basis, Australia produced the most electricity from solar at 1,810 kWh, while the Netherlands came in second with 1,208 kWh. Spain became the third largest solar producer on a per capita basis in 2023, after ranking fifth in 2022.
Solar: Change in 2023
China made up more than half of record solar growth in 2023
2023 saw a record absolute increase in solar generation of 307 TWh – the largest rise of any electricity source in 2023, adding more than twice as much new electricity as coal. 2023 was the eighth consecutive year of record TWh growth for global solar generation. Added total solar generation rose to a new high of 1,631 TWh. This represents a 23% rise year-on-year, only slightly lower than the 25% increase seen in 2022. The record generation increase in 2023 was the result of record solar capacity additions, particularly in China.
Solar’s share of global generation in 2023 increased from 4.6% in 2022 to 5.5%.
The record global increase in solar generation was in large part driven by China, which saw an increase of 156 TWh (+37%). Growth in China made up more than half (51%) of global growth in solar in 2023.
Major year-on-year increases in solar generation were also seen in the United States (+33 TWh, +16%), Brazil (+22 TWh, +72%) and India (+18 TWh, +19%). Brazil nearly doubled solar generation due to new regulation and feed-in tariffs. Together the top four solar growth countries accounted for 75% of growth in 2023.
The remaining solar growth was widespread, with countries outside the top ten contributing 13% (39 TWh) of global growth.
2023 saw substantial increases and new records in solar generation for every month of the year. The highest monthly generation occurs from May to August when solar irradiation is highest in the northern hemisphere, which is where most of the world’s solar installations are located.
In August 2023, a new record was set for the all-time monthly high for solar generation at 159 TWh. August’s record was 28% above generation in August 2022 and 23% above the previous record of 129 TWh in July 2022.
Solar generation in every month between March to October of 2023 was higher than any month in 2022.
Solar: Long-term trend
Solar generation in 2023 was more than six times higher than in 2015
Global solar generation has increased significantly over the last two decades, from just 1 TWh in 2000 to 1,631 TWh in 2023. In 2023, solar was the source with the largest year-on-year percentage growth for the 19th year running.
As a result, the share of solar generation has increased from just 1.1% in 2015 to 5.5% in 2023.
Most of the growth came in recent years. Solar generation in 2023 was more than six times larger than in 2015 (256 TWh). Solar still continues to accelerate and has more than doubled (+131%, +925 TWh) since 2019. Deployment of solar capacity has been rapidly increasing, in part due to costs falling by 87% from 2010 to 2020.
Many countries have seen their solar share increase. China’s share in 2023 was above the world average at 6.2% (584 TWh), up from just 0.7% (39 TWh) in 2015. Over the same period, in the US the solar share increased from 1% (39 TWh) to 5.6% (238 TWh) and in Japan from 3.4% (35 TWh) to 11% (110 TWh).
Across all regions, solar generation is playing a more prominent role in the mix.
In Latin America, Brazil saw solar rise from negligible amounts in 2015 (0.01%, 0.06 TWh) to 7.3% (52 TWh) in 2023. In Chile, solar went from 1.9% (1.4 TWh) in 2015 to 20% (17 TWh) in 2023.
Large increases also occurred across Europe. Spain saw an increase from 5% (14 TWh) in 2015 to 17% (45 TWh) in 2023. Germany saw its share double from 6% (38 TWh) in 2015 to 12% (62 TWh) in 2023.
The Middle East and Africa are still lagging behind, but countries like South Africa (1.1% in 2015 to 6.8% in 2023) and the United Arab Emirates (0.2% in 2015 to 4.5% in 2022) have seen recent increases.
Solar: Progress towards net zero
Growth in solar generation is on track for net zero targets
Global solar generation needs to grow by more than five times from the current 1,631 TWh in 2023 to 8,316 TWh in 2030, according to the IEA Net Zero Emissions scenario. This would take solar’s share of global electricity generation from 5.5% in 2023 to 22% in 2030. Solar’s trajectory in the scenario is steeper than current deployment rates, although additions have increased rapidly in the past few years.
In the IEA NZE scenario, solar continues to grow beyond 2030, making up 43% of all generation in 2050.
While solar generation will need to see a large rise across the globe, country trajectories will inevitably vary. Countries with good solar conditions like Australia, China or the US may well exceed the global average, while others will rely more on other clean sources like wind, hydro and nuclear in their power sector transition.
In 2023, solar generation rose by 23%. This was slightly below the average growth rate recorded since 2015, of 26%. However, the growth rate from 2016 to 2022 was in line with net zero targets, and as explained in Chapter 2.2 the slower growth in 2023 does not represent a structural slowdown. To align with the goal for solar generation outlined in the IEA NZE scenario, an average annual growth rate (CAGR) of 26% needs to be maintained from 2023 to 2030.
This growth rate would see larger and larger absolute increases every year. This requires additions in generation of more than 1,000 TWh per year by 2030, compared to the 314 TWh in 2023.
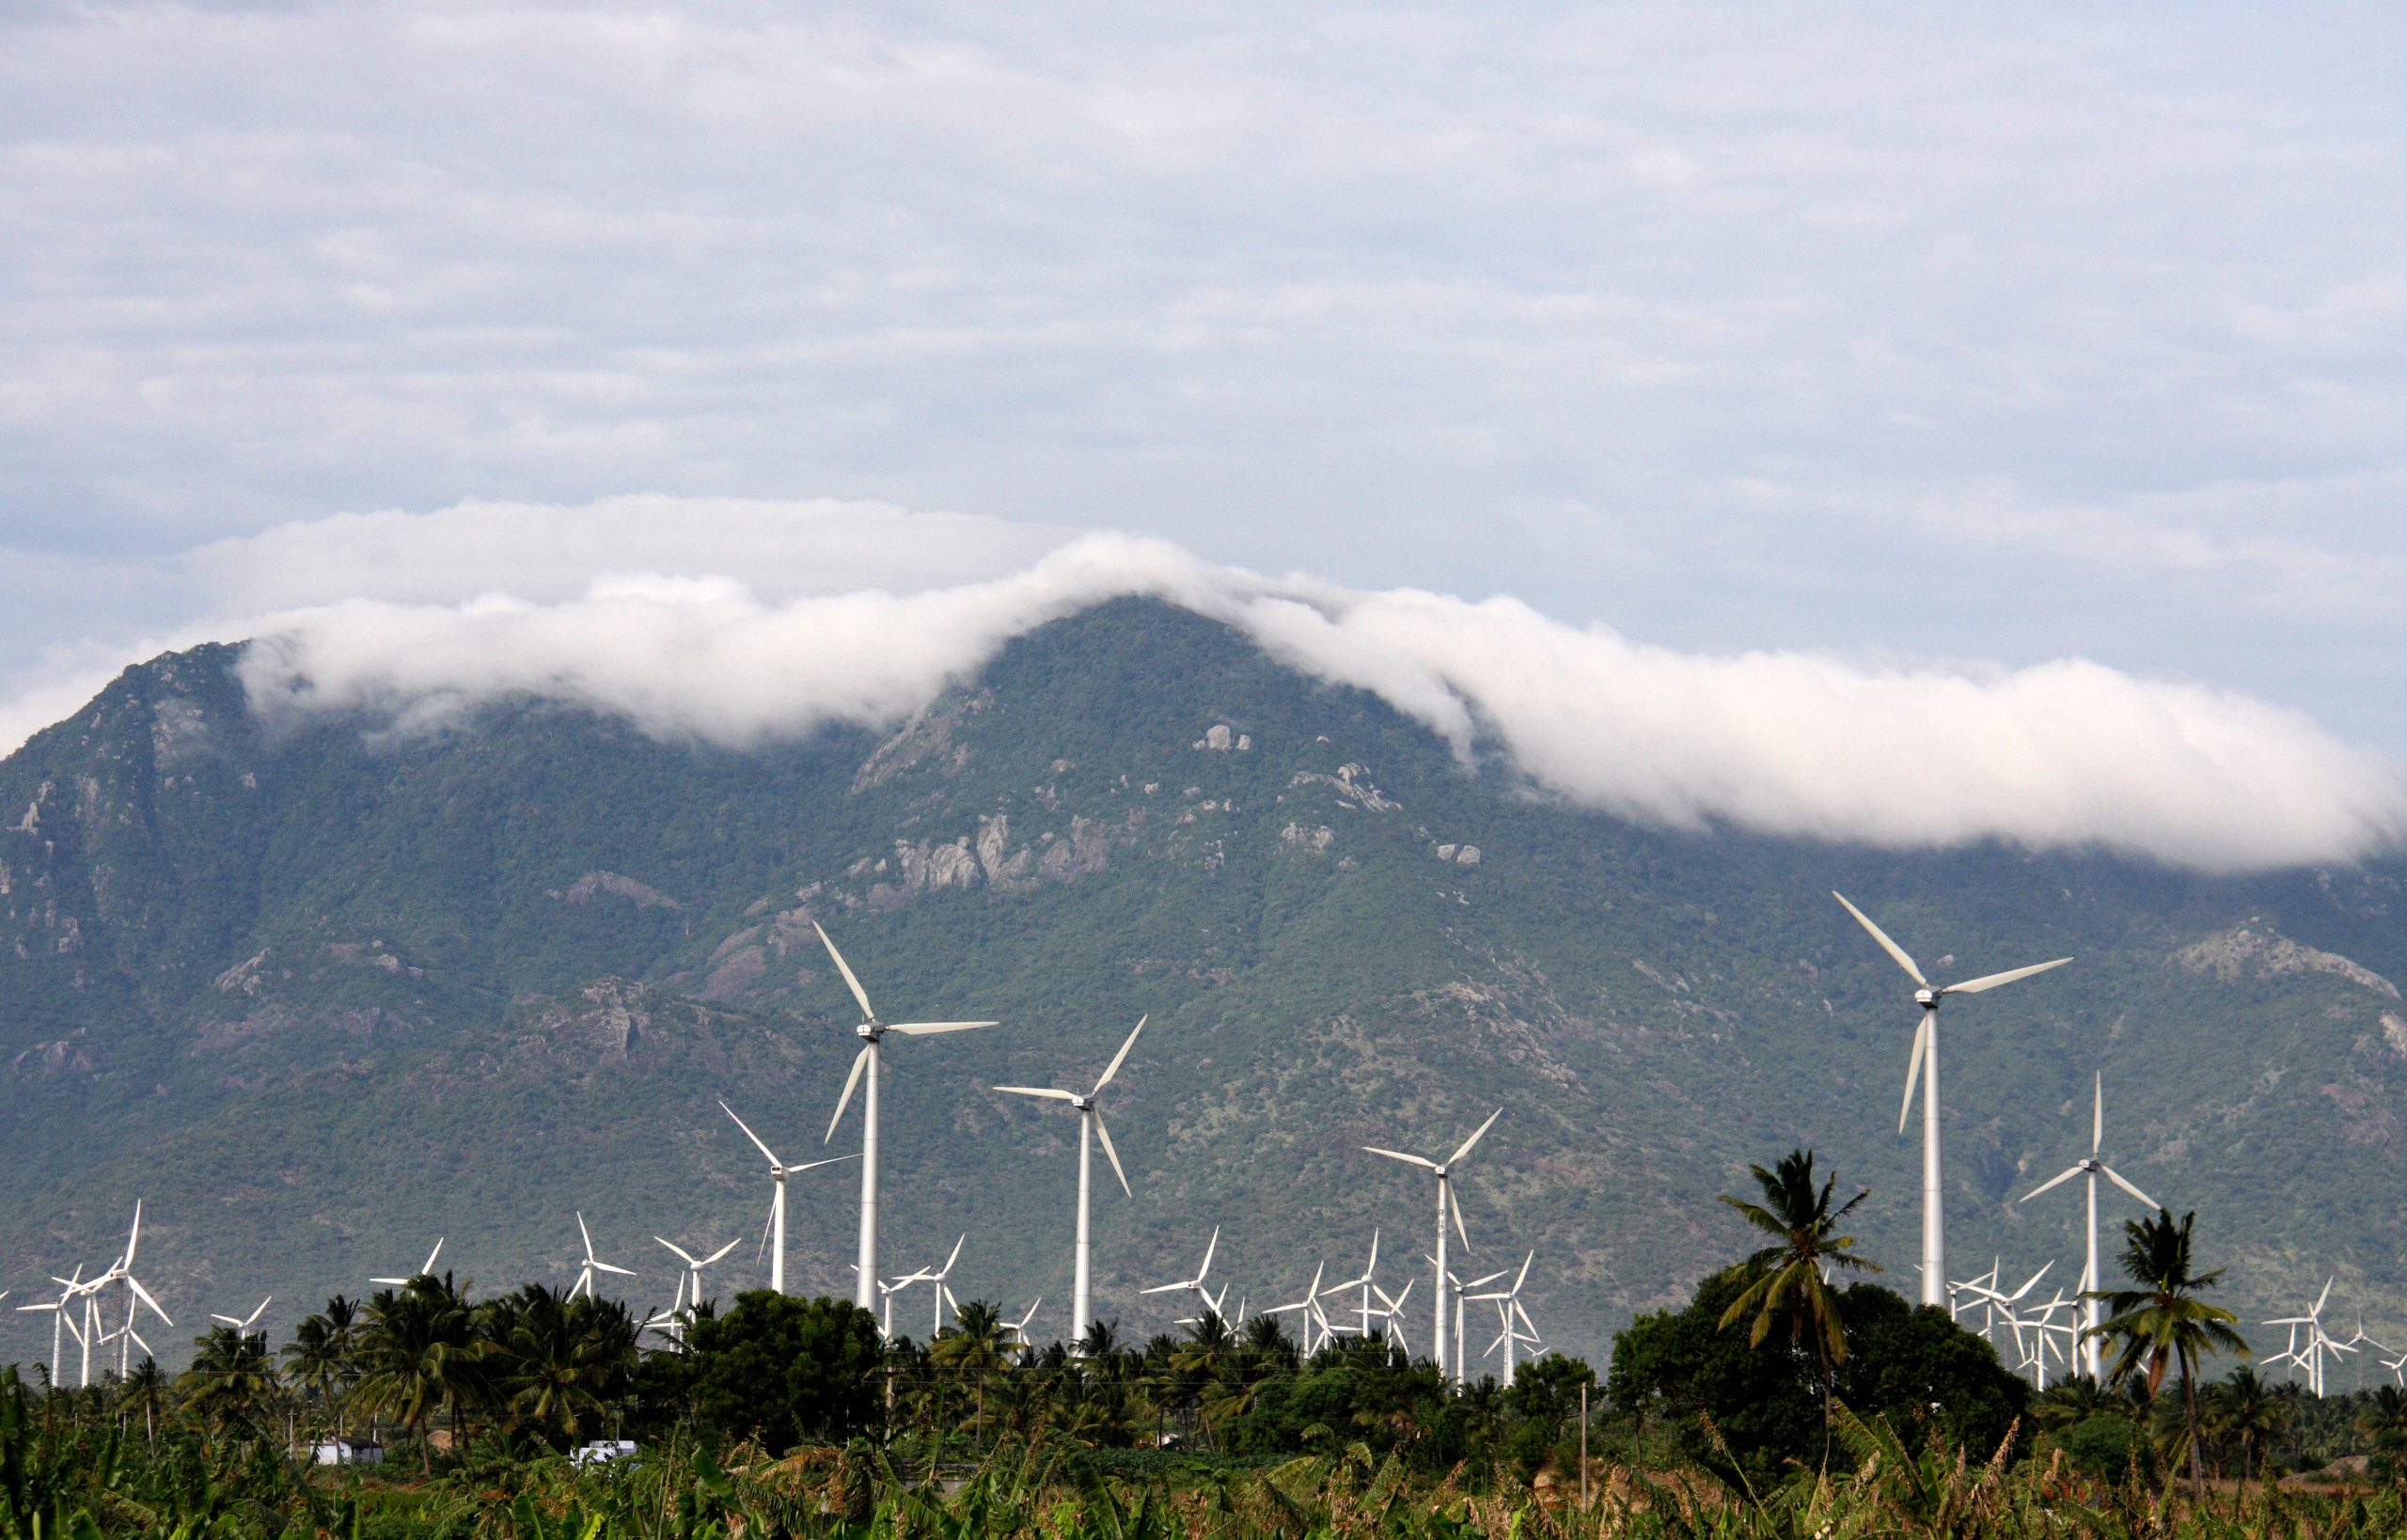
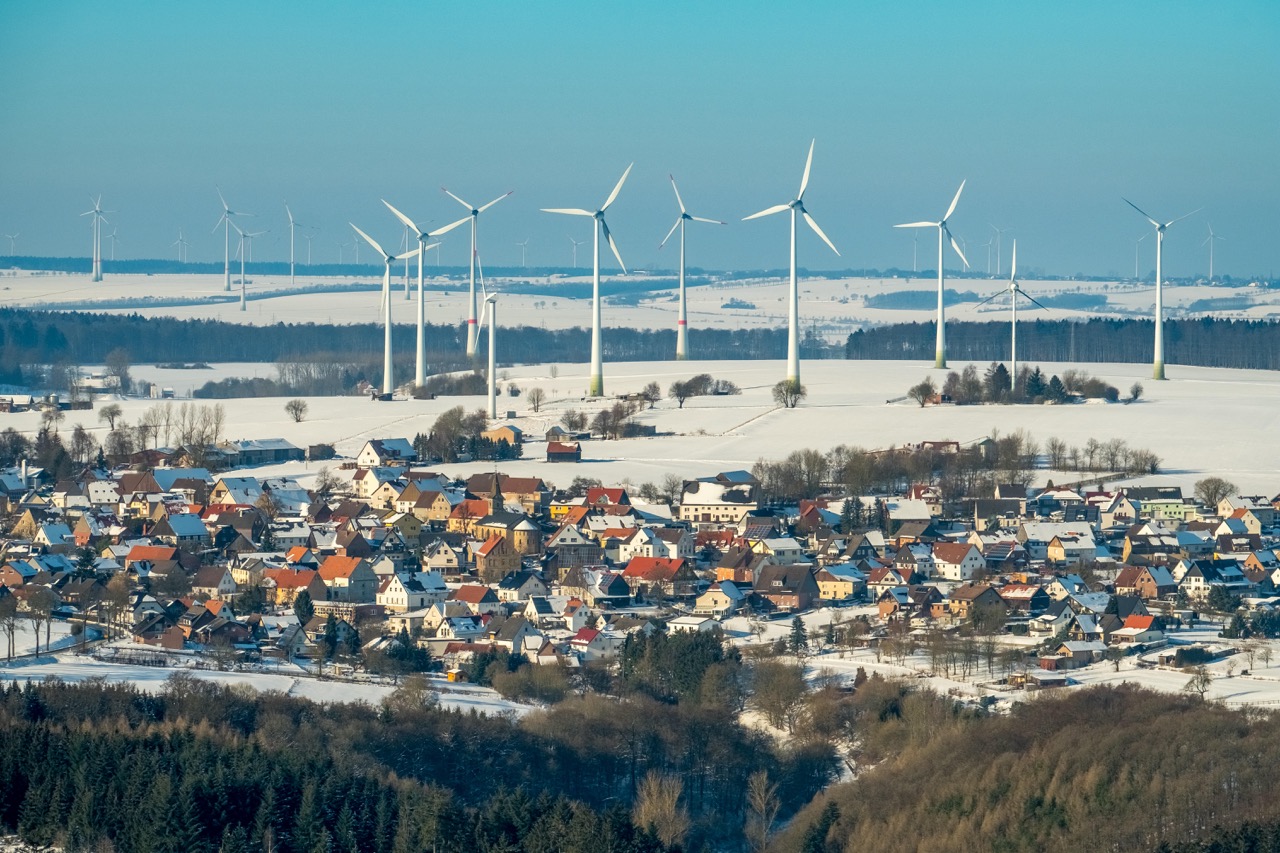
4.2
Wind
Key highlights
01
Global wind generation reached a new record high, adding enough electricity to power all of Poland
02
32 countries generated more than a tenth of their electricity from wind power in 2023
03
Wind generation has nearly tripled since 2015
Wind: Current status
32 countries generated more than a tenth of their electricity from wind power in 2023
Wind produced 7.8% (2,304 TWh) of global electricity in 2023.
Wind, alongside solar, is key to reducing emissions in the electricity sector. Both sources will form the backbone of the future electricity system by providing nearly 70% of global electricity by 2050. Therefore, rapid scale-up is required this decade.
China leads the world in wind power. It generated 886 TWh from wind in 2023, more than twice that of the United States (425 TWh) and six times that of Germany (137 TWh).
32 countries generated more than a tenth of their electricity from wind power in 2023. Denmark had the highest share of wind generation in the electricity mix at 58% in 2023, up from 54% in 2022 and setting a new record high. Ireland had the second highest share at 36%.
The Scandinavian countries of Sweden (3,317 kWh), Denmark (3,316 kWh), Norway (2,769 kWh) and Finland (2,643 kWh) lead the world in wind generation per capita.
Wind: Change in 2023
Global wind generation reached a new record high, adding enough electricity to power all of Poland
Global wind generation reached a new record high of 2,304 TWh in 2023, up 206 TWh (+9.8%) compared to 2,099 TWh in 2022. As a result, wind’s share in the global electricity mix increased from 7.3% in 2022 to 7.8% in 2023.
The growth in wind power in 2023 of 206 TWh was the third-largest addition after 2021 and 2022.
China’s wind increase of 123 TWh (+16%) accounted for 60% of global wind generation additions in 2023. It was more than eight times higher than the second-highest increase recorded in Brazil of 14 TWh (+17%).
Across the EU, wind generation grew by 50 TWh (+12%) with the largest increases in Germany, France and the Netherlands.
The US saw wind generation fall 9 TWh (-2.1%) despite capacity additions, due to unfavourable wind conditions. Generation is expected to rise again in 2024.
Throughout 2023, monthly global wind generation remained mostly above 2022 values.
December 2023 set a new all-time monthly record for wind generation with 231 TWh, a 14% increase over December 2022.
Wind generation is generally highest during the winter months in the northern hemisphere, with wind capacity currently concentrated in Europe, the US and China.
Wind: Long-term trend
Wind generation has nearly tripled since 2015
Wind and solar are currently the only two sources growing substantially in the global electricity mix. Wind generation was just 31 TWh and 0.2% of the mix in 2000. In 2015, this had grown to 830 TWh and 3.5%. In just eight years since 2015, wind generation nearly tripled to 2,304 TWh, with its share more than doubling to 7.8% in 2023.
Europe has the highest share of wind generation. This was mainly driven by increases in the EU, where the share of wind generation reached a record high of 17% in 2023 – almost double the 9% share in 2015. Over the same period, the share in the United Kingdom increased from 12% to 28%, and in Denmark, it reached a share of 58%, up from 49% in 2015.
The Americas, Asia and Oceania also saw rapid build up of wind power in some countries. In Australia, wind generation increased from 4.7% in 2015 to 12.1% in 2023. China’s share increased from 3.2% to 9.4% in the same period. Wind generation in the US increased from 4.7% in 2015 to 10% in 2023, while Brazil’s share reached 13% in 2023, up from 3.7%.
Africa and the Middle East have recently seen more wind installations, but shares still lag behind. Morocco stood out with an increase in wind generation share from 2015 to 2023 from 8.4% to 14.8%.
Wind: Progress towards net zero
To reach net zero, wind needs to grow at twice the rate it did in 2023
According to the IEA Net Zero Emissions scenario, global wind generation needs to increase to 7,070 TWh in 2030 from today’s 2,304 TWh to meet rising demand and replace fossil fuels. This would increase the share in the mix from 7.8% to 18.5%. By 2050, the IEA NZE scenario sees wind growing further to 31% of the global electricity mix.
Wind generation is not expected to rise uniformly across the world. The largest increases are expected in China, the US and Europe.
Global wind generation rose by 9.8% in 2023. This was significantly below the average annual growth of 14.2% seen between 2016 and 2022. In part this was caused by temporary weather conditions in the US. Additionally, capacity additions – while larger in absolute terms every year – are not yet growing fast enough to maintain high percentage growth rates.
To align with the IEA NZE scenario, global wind generation needs to grow at an average 16.2% every year through to 2030. This is nearly twice as fast as in 2023 and two percentage points higher than the average growth between 2015 and 2023.
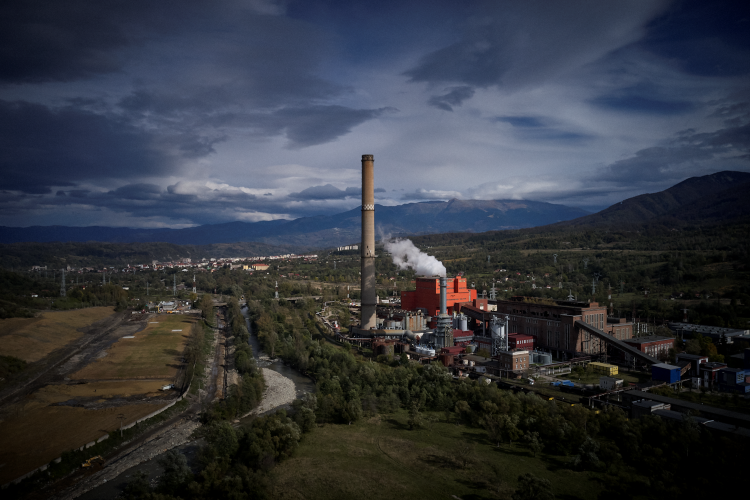
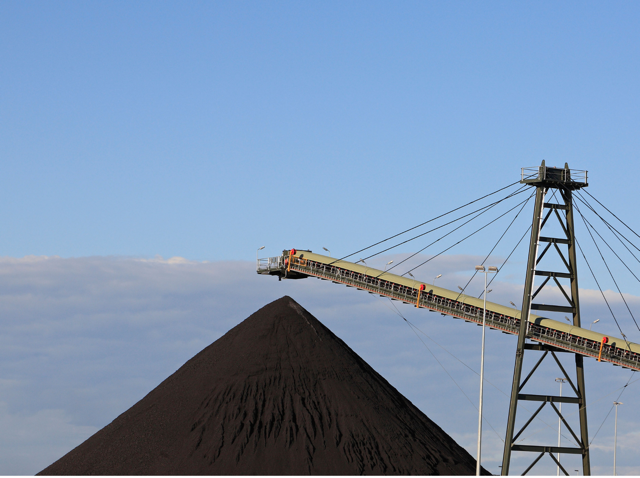
4.3
Coal
Key highlights
01
Coal generated 35% of global electricity in 2023, with China responsible for more than half of global generation
02
The increase in global coal generation was driven in large part by low hydro output in just four countries
03
OECD economies including the EU, US and Japan saw major falls
Coal: Current status
Coal generated 35% of global electricity in 2023, with China responsible for more than half of global generation
Coal generated 35% (10,434 TWh) of global electricity in 2023, remaining the largest source of electricity generation.
Coal power is the single largest contributor to emissions from the power sector, and indeed the single largest source of emissions across the entire global economy. The world must move rapidly to reduce its role in the next two decades to have a chance at limiting global warming to 1.5C. As per the IEA Net Zero Emissions scenario, unabated coal plants will have to be phased out by 2030 in mature economies and by 2045 in emerging economies.
China produced by far the most electricity from coal in 2023. Its output of 5,716 TWh represented more than half (55%) of total global coal generation in 2023. India produced the second highest amount of electricity from coal, but at 1,480 TWh this amounted to only a quarter of China’s coal generation.
Just 13 countries generated more than half of their electricity from coal. Kosovo had the highest share of coal power in its electricity mix (88%). Mongolia (85%) and South Africa (81%) had the second and third highest shares respectively. China and India were also in the top ten for share of generation from coal, producing 60% and 75% of their electricity from coal.
Taiwan (5,115 kWh) and Australia (4,920 kWh) had the highest coal generation per capita, more than three times the world average of 1,319 kWh.
Coal: Change in 2023
The increase in global coal generation was driven largely by low hydro output in four countries, but OECD economies including the EU, US and Japan saw major falls
Coal generation reached another record high in 2023. Globally, 10,434 TWh of electricity was produced from coal last year.
Generation increased by 146 TWh (+1.4%) compared to 2022, slightly higher than the annual growth seen from 2021 to 2022 of 131 TWh (+1.3%). However, while total global electricity generation increased, the share of coal in the global mix has actually fallen slightly, by 0.3 percentage points, from 35.7% in 2022 to 35.4% in 2023.
Of countries with available data for 2023, 38 showed falls in coal generation and only 14 showed increases. Only four countries had increases over 10 TWh, driven in large part by drought conditions that caused low hydro output.
Coal generation increased most in China (+319 TWh, +5.9%) and India (+100 TWh, +7.3%). Smaller increases were recorded in Viet Nam (+24 TWh, +23% TWh) and Mexico (+12 TWh +55%).
In the US, coal generation collapsed 156 TWh (-19%). In Germany, coal fell by 45 TWh (-25%). The entire EU saw a fall of 113 TWh (-25%).
In January and February 2023, coal generation remained below 2022 values. However, as droughts in China reduced availability of hydro generation, coal generation saw larger increases from March to July.
In the second half of the year, coal generation was only slightly above 2022 as hydro generation in China returned to previous levels. With China accounting for more than half of global coal generation, changes in the country have a large-scale impact on generation worldwide.
Generation tends to be high in the winter and summer months of the northern hemisphere when electricity demand peaks due to increased demand from heating and air conditioning.
Coal: Long-term trend
Coal’s share in the electricity mix has declined since its peak in 2013
Electricity generation from coal has been consistently growing for the last two decades. Generation nearly doubled from 5,809 TWh in 2000 to 10,434 TWh in 2023.
At the same time, the share of coal in the electricity mix decreased slightly, from 38% in 2000 to 35% in 2023. Coal generation share increased globally until 2013 when it reached a peak of 41%. Even though coal generation continued to grow after 2013, growth was slower than increases in overall electricity demand, resulting in declining share. In particular, additions of solar and wind power in the last decade have resulted in coal’s share of the mix declining six percentage points from its peak in 2013.
Since 2015, the share of coal generation has fallen across all regions. The largest falls came from North America, driven by growth in gas in the United States pushing coal out. As a result, coal share in the region fell from 30% in 2015 to 14% in 2023. Globally, the share of coal fell from 39% to 35% over the same period.
Among the top emitters, China, the US and the EU all saw large falls in coal share. In the US, the share more than halved, falling 17 percentage points from 33% to 16% of the mix.
Coal: Progress towards net zero
Net zero pathways see coal generation halve this decade, a sharp reversal of the ongoing increases
According to the IEA Net Zero Emissions scenario, coal generation needs to be almost entirely phased out by 2040. By 2030, this pathway requires a halving of coal generation, from 10,434 TWh in 2023 to 5,144 TWh. As a result, the share in the global electricity mix would fall from 35% now to just 14% by 2030.
On this pathway, countries in Europe and North America, as well as other OECD countries such as Australia, Japan and South Korea, which have a larger historical responsibility for emissions, would phase out coal by 2035. For less developed countries with large amounts of coal generation – such as China, India and Indonesia – the next step is to end growth in coal generation and begin a phasedown.
Between now and 2030, the IEA NZE scenario requires an average 8.5% annual decrease in coal generation. In 2023, generation increased by 1.4%, while the average annual growth recorded since the Paris Agreement in 2015 was 1.5%.
However, there are encouraging signs in the OECD. From 2016 to 2022, coal declined by an average of 5% annually across OECD countries. In 2023 the decline accelerated to 13%.
4.4
Gas
Key highlights
01
The US was responsible for a quarter of global gas generation in 2023, more than three times the second largest generator, Russia
02
US gas growth prevented a global fall in gas generation in 2023
03
The world’s three highest power sector emitters per capita are all highly dependent on gas: Bahrain, Qatar and Kuwait
Gas: Current status
The US was responsible for a quarter of global gas generation in 2023, more than three times the second largest generator, Russia
Fossil gas produced 23% (6,634 TWh) of global electricity in 2023, the second-largest source worldwide.
After coal, gas is the second-largest contributor to emissions from the power sector. Although it will play a role in the medium term, helping with power system flexibility to accommodate larger shares of wind and solar, the use of unabated gas will be limited as countries move to clean power systems.
The US had the highest electricity generation from gas in 2023 with 1,802 TWh (42% of the mix). This was more than three times the second-highest, Russia, at 545 TWh (46% of the mix). US gas generation accounted for more than a quarter (27%) of the global total.
Turkmenistan, Bahrain and Qatar all produced nearly 100% of their electricity from gas. Globally, 15 countries had a gas share of over 80%.
Countries in the Middle East with high electricity demand and a generation mix dominated by gas had the highest per capita gas generation worldwide. Bahrain reached 24,281 kWh per capita – ahead of Qatar (20,177 kWh) and the UAE (13,632 kWh).
The world’s three highest per capita power sector emitters are all highly dependent on gas: Bahrain, Qatar and Kuwait.
Gas: Change in 2023
US gas growth prevented a global fall in gas generation in 2023
Gas generation reached a new record high of 6,634 TWh in 2023. Gas generation was up 53 TWh (+0.8%) from 6,582 TWh in 2022.
Despite the record total gas generation, the increase of 53 TWh is one of the lowest increases recorded since the turn of the century. While generation increased, the gas share fell slightly by 0.3 percentage points, from 22.8% in 2022 to 22.5% in 2023 due to overall electricity demand rising at a faster rate.
Growth in gas generation in 2023 was largely driven by the US, which saw an increase of 115 TWh – more than double the global growth and more than four times the increase in China of 25 TWh. Iran recorded the third-largest increase in gas generation in 2023 (+14 TWh).
In other large economies, gas generation is falling. In 2023, Japan saw the largest fall with 27 TWh, followed by the UK (-24 TWh) both in part due to high gas prices and a fall in electricity demand. Italy (-23 TWh), Spain (-23 TWh) and France (-14 TWh) also recorded significant falls.
Monthly global gas generation across 2023 remained largely similar to 2022. There were minimal monthly fluctuations.
July and August recorded two consecutive new all-time highs for gas generation in a single month, with 629 TWh and 633 TWh respectively, beating the previous record set in August 2022 of 618 TWh.
Gas: Long-term trend
Gas generation has doubled since 2000, but growth is slowing
Global gas generation has grown substantially over the last two decades. It more than doubled, rising from 2,745 TWh in 2000 to 6,634 TWh in 2023.
However, growth has been slowing recently. In the four years from 2015 to 2019, gas generation increased 816 TWh. In the four years since, generation only increased a third of that (+265 TWh) signalling a slowdown in global gas growth.
The share of gas generation in the global electricity mix increased four percentage points, from 18% in 2000 to 23% in 2023. Gas share peaked in 2019 at 24%.
The share of gas generation increased in the Middle East and Africa from 2015 to 2023, but it has stagnated in Europe and fallen in Latin America, Oceania and Asia.
In the US, the gas share increased from 33% in 2015 to 42% in 2023 as the country saw a significant shift from coal to gas generation. From 2015 to 2023, the growth in gas generation in the US contributed 43% of the total global increase.
Gas plays only a small role in generation in China and India. Unlike the US, China and India are not planning a transition from coal to gas generation and are instead focusing on the deployment of renewables.
Gas: Progress towards net zero
Gas growth is slowing, but should be falling
According to the IEA Net Zero Emissions scenario, gas generation needs to see moderate falls until 2030, dropping to 6,007 TWh from 6,634 TWh in 2023, with larger falls in the following decade to 2040. Although growth has been slowing in recent years, this would represent a reversal from current trends.
This pathway sees the share of generation from unabated and abated gas fall from 23% of global electricity generation in 2023 to 16% in 2030 and then further to just 2.4% in 2040.
The reduction in gas generation by 2030 requires an average annual fall of 1%. From 2016 to 2022, gas generation increased by an average 2.5% per year.
The increase in 2023 of 0.8%, while below the recent average, still represents a trend in the wrong direction. However, the global energy crisis and high gas prices over the last two years have led to significant falls in gas generation in Europe and some Asian countries, highlighting that a rapid change in trend is possible.
4.5
Hydro
Key highlights
01
Hydro remains the largest source of clean power globally
02
Global hydropower generation fell by a record amount in 2023 to a five-year low, as droughts affected output in the first half of the year
03
Hydro generation has flattened since 2019, with less clean electricity added to the mix at a crucial moment in the transition
Hydro power: Current status
Hydro remains the largest source of clean power globally
Hydro power produced 14% (4,210 TWh) of global electricity in 2023.
Hydro power has an important role in the current energy mix. Not only is it the largest source of clean power, but it also provides flexibility to help accommodate the large influx of wind and solar. The world needs new hydro power plants, but in many regions hydro resources have already been maximised, and in others where there is potential, the projects may come at too high an ecological cost.
In 2023, China produced the most electricity from hydro power with 1,244TWh (13% of its mix), ahead of Brazil (431 TWh) and Canada (365 TWh), which both rely on hydro for about 60% of their electricity generation.
Bhutan, Paraguay and the Democratic Republic of the Congo produce 100% of their electricity from hydro. Many other countries with the right topography also rely overwhelmingly on hydro.
Iceland and Norway lead the per capita generation of hydro power with 37,642 kWh and 25,164 kWh, respectively.
Hydro power: Change in 2023
Global hydropower generation fell by a record amount in 2023 to a five-year low, as droughts affected output in the first half of the year
Despite continued additions of new hydro capacity, generation growth has stagnated since 2019. At 4,210 TWh, generation in 2023 was lower than in 2019 (4,226 TWh) and significantly below the level in 2020 (4,344 TWh).
2023 saw a record fall in hydro generation (-88 TWh, -2.0%). Crucially, the fall in 2023 came after a similarly large fall in 2021 and only a moderate recovery in 2022. This led to a fall in hydro share in the global electricity mix, from 15% in 2022 to 14% in 2023.
The largest increases in hydro generation in 2023 occurred in Paraguay (+13.0 TWh, +30%), Italy (+9.5 TWh, +34%), Argentina (+9.3 TWh, +39%) and Norway (+7.7 TWh, +6%). These countries all recorded a rebound in output as a result of experiencing poor hydro conditions in 2022, rather than increases due to added capacity.
The global fall in hydro generation in 2023 was predominantly driven by China, where hydro fell by 59 TWh, making up 67% of the global fall. This resulted in a larger increase in coal generation.
Canada, India, Viet Nam, Mexico and the United States also saw significant falls due to poor conditions. Despite the rest of the world recording increases in 2023, the falls in China and other countries were large enough to cause a significant global hydro deficit of 88 TWh compared to 2022.
Global hydro generation underperformed particularly in the first half of 2023. This was especially noticeable in May and June, when droughts in China had the largest impact. Generation remained below 2022 levels until August and even fell below generation levels seen in 2019-2021 for much of the first half of the year.
Generation recovered partially in the second half of the year, with three months recording five-year highs.
Hydro power: Long-term trend
Hydro generation has flattened since 2019, adding less clean electricity to the mix at a crucial moment in the transition
Hydro’s role in the electricity mix has become smaller over the last two decades. While generation increased from 2,629 TWh in 2000 to 4,210 TWh in 2023, the share in the mix fell from 17% to 14% due to total global demand nearly doubling over the same timeframe.
Over the last two decades, hydro capacity continued to increase, leading to consistent growth in hydro generation until 2020. As the last few years have shown, however, poor hydro conditions in Latin America, China, the US and Europe have caused a plateau and even small decreases in generation.
Although individual events like droughts may be temporary, hydro generation has remained effectively flat since 2019, meaning that less clean electricity has been added to the mix at a critical point in the energy transition.
Hydro generation has remained stable in the electricity mixes of most countries and regions since 2015, with relatively few undergoing structural shifts in their hydro generation.
Hydro generation tends to fluctuate significantly from year to year. Therefore, small decreases in some European countries, such as Norway’s change from 96% in 2015 to 89% in 2023, do not necessarily represent a structural decline in hydro generation.
Shares of hydro generation are highest in the Americas, Asia and Europe. Only a few countries in Africa rely on hydro for significant parts of their electricity mixes. In Nigeria, the share of hydro increased from 19% in 2015 to 20% in 2023. The average generation share of hydro in the Middle East was just 1.3% in 2023, slightly down from 1.5% in 2015.
Hydro power: Progress towards net zero
Hydro generation needs to return to growth to meet net zero goals
According to the IEA Net Zero Emissions scenario, hydro generation needs to increase from the current 4,210 TWh to 5,507 TWh in 2030 and then further to 8,225 TWh in 2050. Due to the rapid growth in electricity demand, the share of hydro generation is expected to fall to 11% by 2050.
While most of the clean electricity additions are expected to come from wind and solar, other low emissions sources like hydro and nuclear are a key part of a successful electricity transition.
In 2023, hydro generation saw its largest absolute and second-largest percentage fall in at least two decades. The 2% fall was therefore significantly out of step with the 1.5% average annual growth seen from 2016 to 2022.
For hydro generation to grow in line with the IEA NZE scenario, annual growth until 2030 needs to reach an average of 2.9% between 2023 and 2030 – double the rate achieved between 2016 and 2022. The fall in 2023 is a step in the wrong direction.
The IEA assumes hydro output from added capacity will continue at historic rates. However, the long-term global outlook on the impact of climate change on hydro output is uncertain, as the effects of climate change on hydro potential vary geographically. If hydro does not grow at the rates needed, it is possible that solar and wind may need to compensate.
4.6
Nuclear
Key highlights
01
The US, China and France accounted for more than half of global nuclear generation in 2023
02
Nuclear generation rebounded slightly from a five-year low in 2022
03
Nuclear’s share in the mix has nearly halved since 2000
Nuclear: Current status
The US, China and France accounted for more than half of global nuclear generation in 2023
Nuclear power made up 9.1% (2,686 TWh) of the global electricity mix in 2023.
Nuclear power is an important source of low-carbon energy. Many scenarios foresee nuclear power capacity increasing significantly over the coming decades in line with growing electricity demand.
In 2023, the US was the largest producer of electricity from nuclear power with 775 TWh, ahead of China (435 TWh) and France (336 TWh). Together, these three countries account for more than half (58%) of global nuclear power generation.
The highest shares were in European countries, including France (65%), Slovakia (62%) and Hungary (44%). Based on estimated data, Ukraine generated 60% of its electricity from nuclear power in 2023.
Finland (6,127 kWh) and France (5,201 kWh) have the highest per capita nuclear generation.
Nuclear: Change in 2023
In 2023, nuclear generation rebounded slightly from a five-year low in 2022
In 2023, nuclear generation rose slightly to 2,686 TWh – up 46 TWh (+1.8%) from a five-year low in 2022. At the same time, nuclear’s share in the mix remained mostly unchanged from 2022 at 9.1%.
After a period of consistent growth from 2013 onwards, the last five years have seen global nuclear generation fluctuate significantly. Retirements in some European economies, maintenance in France and Japan, as well as growth in China, have resulted in increased volatility.
France saw the largest increase in nuclear generation in 2023 (+41 TWh) ahead of Japan (+26 TWh) and China (+17 TWh). France’s additions were due to a recovery of reactor availability from the previous year. Similarly, reactors coming back online after maintenance caused the generation increase in Japan. China’s increase represents new additions to the country’s nuclear fleet.
The largest reductions occurred in Germany (-26 TWh), which completed its planned phaseout of nuclear power in 2023. Belgium also saw a significant reduction (-10 TWh) due to reactor retirements.
Despite starting the year below the January 2022 level, nuclear generation was higher for 2023 from April onwards.
Nuclear generation does not traditionally see large seasonal fluctuations. Maintenance is scheduled for summer months to minimise disruption during the winter when there is higher electricity demand. This explains the slightly lower summer generation values in the northern hemisphere, where most nuclear installations are located.
Nuclear: Long-term trend
Nuclear’s share in the mix has nearly halved since 2000
Nuclear generation in 2023 was only slightly higher than in 2000, increasing by 145 TWh (+6%), from 2,541 TWh to 2,686 TWh. However, 2023 levels are the result of a fall and recovery after the Fukushima disaster in 2011 which resulted in generation dropping significantly in 2011 and 2012, primarily in Japan.
Due to global electricity demand nearly doubling over the same period, the share of nuclear power in the global electricity mix has declined significantly. In 2000, 16.6% of global electricity came from nuclear power. This had shrunk to 9.1% by 2023.
The global share of nuclear generation declined from 10.6% in 2015 to 9.1% in 2023. Asia and the Middle East were the only two regions that saw an increase in nuclear share, with new reactors coming online in the UAE, Japan and China.
Europe saw a stronger decline due to Germany’s nuclear phaseout as well as lower output in France.
Japan’s nuclear share increased rapidly from just 0.4% in 2015 to 7.6% in 2023 as the country restarted reactors. All of Japan’s nuclear reactors were shut down after the Fukushima nuclear disaster in 2011.
Nuclear: Progress towards net zero
Nuclear needs to grow nearly three times faster than 2023’s rate to achieve net zero
The IEA Net Zero Emissions scenario sees nuclear generation growing significantly, from 2,686 TWh in 2023 to 3,936 TWh in 2030 and 6,015 TWh in 2050.
With electricity demand growing as well, the share of nuclear power would remain roughly stable over the next three decades. By 2030, the share would reach 10.3%, up slightly from 9.1% in 2023, and would fall to 7.8% by 2050.
Slow build up of new nuclear plants may mean that additional wind and solar growth is needed to meet the clean electricity additions required in a net zero scenario.
In the IEA scenario, nuclear generation would grow 4.9% annually until 2030. The average annual growth rate from 2016 to 2022 was significantly below this at 0.6%. Even 2023’s growth rate of 1.8% is more than three times slower than required in the scenario. 2021 almost reached the required level, with growth of 4.3%, but this happened in the context of a rebound from low generation in 2020.
4.7
Bioenergy
Key highlights
01
The share of bioenergy more than doubled since 2000, but remains low at 2.4%
02
Electricity generation from bioenergy increased most in China and Japan in 2023 and fell most in the US
03
Further expansion of bioenergy in net zero pathways presents an emissions risk
Bioenergy: Current status
Bioenergy produces 2.4% of global electricity
Bioenergy power produced 2.4% (697 TWh) of global electricity in 2023.
Although bioenergy is categorised as a renewable source in this report, its climate impact is highly dependent on the type of feedstock used and how it was sourced. Scientific evidence is mounting that in some cases using bioenergy for power contributes to climate change. Wider social and ecological impacts also constrain its use, which renders bioenergy a questionable approach for power sector decarbonisation. Other clean power generation will likely be a more viable option.
China produced the most electricity from bioenergy in 2023 with 204 TWh, representing more than a quarter of global generation from bioenergy, followed by Brazil (54 TWh) and Japan (49 TWh).
18 countries generated more than 10% of their electricity from bioenergy in 2023. Denmark had the highest share of bioenergy in its electricity mix at 21%, ahead of Finland (14%) and the UK (12%).
Finland had the highest per capita electricity generation from bioenergy at 2,000 kWh, ahead of Denmark (1,182 kWh) and Sweden (1,125 kWh).
Bioenergy: Change in 2023
In 2023, electricity generation from bioenergy increased most in China and Japan and fell most in the US
Bioenergy reached a new record high of 697TWh in 2023.
Electricity generation from bioenergy increased by 21 TWh (+3.1%) from 2022 levels (676 TWh). The share of bioenergy in the global electricity mix remained unchanged at 2.4%.
The increase in bioenergy in 2023 was slightly larger than in 2022, but smaller than annual increases from 2017 to 2021. However, this does not represent a structural slowdown but rather a correction from record growth in 2021 during the energy crisis, when high fossil prices led to an increase in bioenergy.
The biggest increase in bioenergy in 2023 came from China which added 28 TWh (+16%), followed by Japan (+7.3 TWh, +18%).
The largest decline in bioenergy generation occurred in the US, falling by 4.4 TWh (-8.5%). In Germany, bioenergy fell 2.1 TWh (-4.4%).
In 2023, global bioenergy generation was higher in every month compared to previous years. Bioenergy generation reached an all-time monthly record in December 2023 at 48 TWh.
Bioenergy only shows small seasonal variations in generation. Generation in the peak month of December was only 9.1 TWh higher than in June – the month with the lowest values.
Bioenergy: Long-term trend
The share of bioenergy more than doubled since 2000, but remains low at 2.4%
Bioenergy generation has more than quadrupled since 2000, from 154 TWh to 697 TWh in 2023.
While generation has increased significantly, bioenergy still only represents a small part of the global electricity mix. The share of bioenergy increased from 1% in 2000 to 2.4% in 2023.
The share of bioenergy increased slightly in most regions. The largest increase was in Asia, with the share increasing from 1.4% to 2.4%.
Japan saw a significant increase in its bioenergy share, from 2.8% in 2015 to 4.8% in 2023.
In China, the share of bioenergy increased slightly from 0.9% to 2.2% over the same period.
Bioenergy: Progress towards net zero
Reliance on bioenergy in net zero pathways presents an emissions risk
Despite concerns around emissions from bioenergy generation, the IEA Net Zero Emissions scenario sees a somewhat increased role for bioenergy in the electricity mix as a flexible source of electricity. Some models rely on bioenergy with carbon capture and storage (BECCS) to deliver negative emissions. In the IEA scenario, BECCS would only account for 17% of bioenergy generation in 2050.
In the pathway, bioenergy’s share in the mix would increase to 3.6% by 2030 and 4% by 2050, from a current share of 2.4%. This would see bioenergy generation grow from the current 697 TWh to 1,313 TWh by 2030 and 3,056 TWh in 2050.
To align with the IEA NZE scenario, bioenergy generation would have to grow at an average annual rate of 8.4% between 2023 and 2030.
This rate is not only significantly above 2023’s growth rate of 3.1%, but crucially also above the longer term growth rate of 5.1% observed between 2016 and 2022.
The risk of emissions, plus wider social and ecological impacts, constrains the use of bioenergy for decarbonising the power sector.

Related Content
Analysis
Romania risks penalties for methane-intensive hard coal production
10 October 2024
Analysis
Redirecting wind energy in India
08 October 2024
Analysis
Coal generation in OECD countries falls below half of its peak
30 September 2024
Analysis
EU battery storage is ready for its moment in the sun
26 September 2024