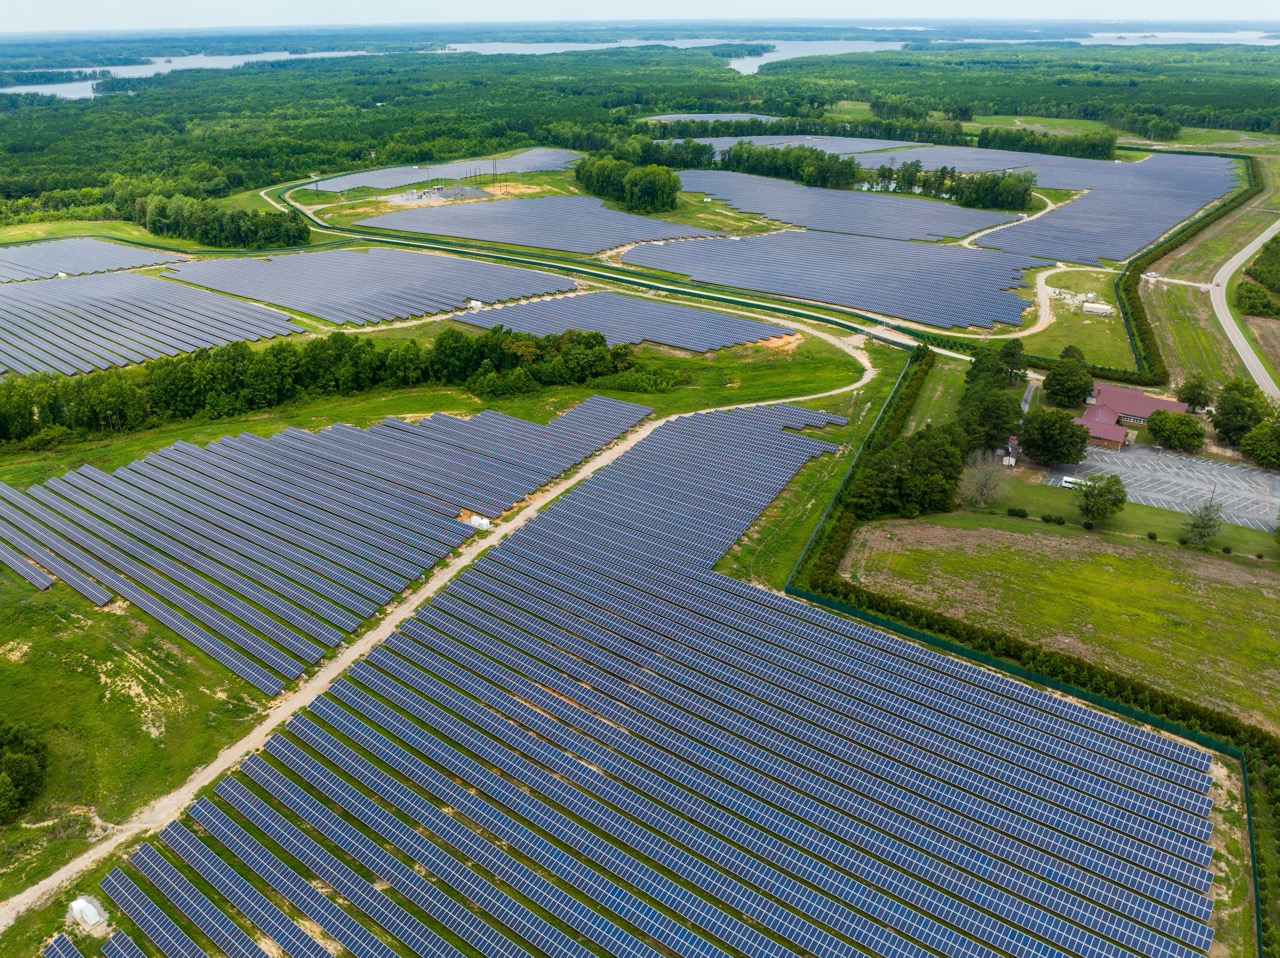
Solar power continues to surge in 2024
Analysis of national monthly data for solar capacity additions shows that the world will – once again – beat forecasts, even though expectations are higher than ever
The world is on track to add 593 GW of solar power this year
Ember estimates that at the current rate of additions, the world will install 593 GW of solar panels this year. That’s 29% more than was installed last year, maintaining strong growth even after an estimated 87% surge in 2023. In 2024, an estimated 292 GW of solar capacity was installed by the end of July.
Ember analysed the latest monthly solar capacity data for 15 countries, accounting for 80% of solar installations in 2023. Capacity additions in these countries increased by 29% in January to July this year, compared to the same period last year. If this 29% growth rate continues until the end of this year, they will install 478 GW.
For the remaining countries, this report uses exports of solar panels from China up to July 2024 to estimate what will be installed throughout 2024. This analysis suggests that 115 GW (with a range of 81-149 GW) of solar capacity will be installed in the rest of the world in 2024. That is a rise of 29% compared to 2023 and reflects high additions from new markets such as Pakistan and Saudi Arabia.
Widespread solar growth is on display around the world
11 of the 15 countries for which Ember is tracking monthly capacity data are showing a larger number of installations this year than the year before.
In China, the country with the largest solar fleet, solar additions for January-July 2024 were 28% higher than in the same period in 2023. Meanwhile, solar capacity installations in India in the first seven months of 2024 are 77% higher than in the same period in 2023. In the US, new solar additions in January-June 2024 are 55% higher than in January-June 2023.
Capacity data from European countries showed continued growth in solar installations, albeit at a more modest pace than in previous years for some countries. In Italy, the EU’s third largest solar market in 2023, installations are up by 41% in the January-July period. Germany and the United Kingdom are showing more modest market growth of 11% for the same period, compared to January-July 2023. Portugal has installed twice as many solar panels in the first seven months of the year as it did in the same period in 2023, but in absolute terms it is still a small market compared to other countries that Ember tracks. Although Poland showed lower installations in January-June 2024 than in the same period in 2023, they were still four times higher than in the first half of 2019.
China continues to install more than half of the world’s solar power in 2024
At the current rate of capacity additions, China is on track to add 28% more solar capacity than in the previous year. If this rate of additions is sustained, it would lead to a total installed capacity of 334 GW, making up 56% of global capacity additions for 2024.
This rate of growth is only slightly below the rest of the world, meaning China’s share of global installations for 2024 is estimated to be similar to last year when it accounted for 57% of global installations. Last year marked a significant change in China’s solar power deployment. It installed more in 2023 than the entire world did in 2022. In 2022 and 2021, its share of global additions was smaller, at 42% and 34% respectively.
Five countries contribute three-quarters of estimated solar capacity additions in 2024
The combined additions of China, the United States, India, Germany and Brazil are on track to make up 75% of global solar additions in 2024.
Other countries we tracked for this analysis add a further 5%. The remaining 20% are derived from analysis of Chinese solar PV exports that act as a proxy to indicate countries where significant installations may be taking place without being reported.
The largest solar economies are continuing to show steady growth
So far this year, the five largest solar economies are all deploying solar panels at the same pace or faster than in 2023.
China’s solar installations from January to June 2024 surpassed the country’s total solar additions in 2022. This rapid expansion has enabled the country to surpass its wind and solar capacity targets six years early. Growth in the US is mainly driven by significant additions of utility-scale solar capacity, which made up over 80% of additions in the first six months of 2024. Solar installations totalled 20 GW from January to June 2024, a 55% increase over the same period last year. This follows a 46% increase in installations in 2023 compared to 2022.
By May 2024, India had already installed more solar panels than it did in the whole of 2023. Last year saw a lower number of installations amid uncertainty around government rules on solar manufacturing. Installations skyrocketed in March this year, before new policy changes came into place which mandated that solar modules used in government-backed projects have to be sourced from an Approved List of Models and Manufacturers (ALMM). However, growth since then has remained steady, and by July the country had installed 18 GW of solar capacity, equalling its all-time record for annual solar panel installations from 2022. At the current pace of additions, India is on track to install 23 GW by the end of 2024, up 77% compared to 2023.
In Germany, reforms to reduce bureaucracy and boost incentives for rooftop solar installations have led to significant solar capacity additions continuing into 2024 after 2023 had seen a large increase compared to prior years. The 5 GW of solar capacity that was added in the first four months of this year meant that the country had already exceeded its previous target to reach 88 GW of total solar capacity by the end of the year. This pace has continued up to July 2024, and if sustained to the end of the year would result in Germany installing 17 GW of solar capacity in 2024. This is consistent with the pace required to meet their new NECP target of 128 GW total capacity in 2026.
So far in 2024, additions in Brazil have been matching the fast pace of installations seen in 2023. Installations are again on track to reach more than 16 GW by the end of the year – more than double the additions recorded in 2021.
Both China and the United States consistently report a large proportion of installations in December. This highlights some of the uncertainty around the forecasts for these countries – and indeed the global forecast. Historically, around 23% of annual installations were reported in the final month for both countries in 2022 and 2023.
Solar export data points to strong growth in new markets
Although not all countries publish monthly updates on solar capacity, other indicators show signs of even faster growth outside of the countries mentioned above. Based on data on Chinese solar exports collated by Ember, we estimate additions of 115 GW (81-149 GW) in these countries. Export data suggests that new solar markets are rapidly emerging.
Pakistan and Saudi Arabia have seen average monthly imports of solar panels soar to more than 1 GW. In the first seven months of 2024, Pakistan imported 12.5 GW of solar panels, while Saudi Arabia imported 9.7 GW. If these panels are installed, it could put the two countries firmly in the company of established, large solar markets, like Germany, Brazil and India.
There is also a recent pick-up observed in the Philippines, the UAE, Thailand and Oman. Exports to South Africa have recently picked up again after they dropped in the middle of 2023.
2024 is set to substantially exceed most forecasts – again
The 593 GW estimated from the pace of additions so far this year is in line with forecasts made by Bloomberg New Energy Finance (BNEF) but is almost 200 GW higher than the International Energy Agency’s (IEA) main case outlook released in January 2024.
According to estimates from Ember, BNEF, and SolarPower Europe, the world installed around 450 GW of solar panels in 2023 – an amount that seemed inconceivable even one year before. As an example, in January 2022, BNEF predicted that global solar additions in 2023 would reach just 236 GW. As a result of the higher installations in 2023, forecasts for 2024 have been revised upwards. For example, SolarPower Europe adjusted its forecast for 2024 from 401 GW (June 2023) to 544 GW (June 2024).
Even forecasts made by industry analysts in 2024 still have strikingly differing predictions for how solar power will grow this year. Reviewing solar outlooks from prominent organisations made in 2024 shows a range of almost 240 GW between the highest (592, BNEF main case Q3 2024) and lowest (353 GW, Wood Mackenzie January 2024) forecasts. In January 2024, Wood Mackenzie reported that ‘starting in 2024, the industry is officially past the inflection point, characterized by a slower growth pattern’, forecasting that annual capacity additions would remain constant for the rest of the decade. In contrast, BNEF predicted in February 2024 that solar additions would rise to 574 GW in 2024 – 29% higher than the additions of 444 GW BNEF estimated for 2023. Their forecast has since been revised even higher to 592 GW for 2024.
How much does solar grow after 2024?
The massive step up in solar capacity installations in 2023 and 2024 has shifted perceptions around solar’s role in the energy transition. Solar will likely add more GWs in 2024 than the entire global increase in coal power capacity since 2010 (540 GW). Just how fast solar deployment has accelerated is further highlighted by the fact that differences between predictions of annual installations are now larger than total solar installations were just a few years prior.
This now puts ambitious climate pledges within reach. Beyond 2024, outlooks for the rest of the decade from BNEF and SolarPower Europe are now aligned with the Global Renewables and Energy Efficiency Pledge, which aims to triple renewable power capacity by 2030. Achieving this would mean that solar power generates a quarter of the world’s electricity by the end of the decade. Under this scenario, solar shows the fastest growth, with expectations that it needs to quintuple to reach 6000 GW by 2030. After the high levels of additions in the last two years, annual solar installations would only have to show relatively modest levels of growth to meet this. BNEF forecasts average growth of 6% per year from 2024 to 2030. They reported 76% growth in 2023 and are expecting 33% in 2024.
Although growth of 6% per year sounds small, the absolute additions this will require will be substantial. Sustaining this pace of additions will require concerted efforts to reduce barriers to solar integration, and to enable the growth of solar power in new markets.
Countries that have already seen rapid levels of solar growth need to make sure they are planning for power systems with high levels of solar capacity. There is already twice the manufacturing capacity available today than is being used. The constraint for future market growth is unlikely to come from solar panel prices. The key will be to ensure that countries have sufficient grid capacity to transport power to where it is needed, as well as develop battery storage capacity to complement solar outside of the sunniest hours. If these actions are taken, solar power could easily continue to surpass expectations throughout the rest of the decade.
Methodology
Countries with available national data
Countries without national data
Global solar installations are estimated using available national data where possible, as well as an analysis of Chinese solar PV export data to the remaining countries.
Monthly solar capacity data is collected from 15 countries or regions, representing an estimated 80% of capacity additions in 2023. These countries include: Australia, Argentina, Brazil, China, Germany, India, Italy, Poland, Portugal, South Africa, South Korea, Taiwan, Türkiye, the United Kingdom, and the United States.
Data was collected from the following national sources:
- Argentina: Compañia Administradora Del Mercado Mayorista Eléctrico (CAMMESA)
- Australia: Australian Photovoltaic Institute (APVI)
- Brazil: Operador Nacional do Sistema Elétrico (ONS), Agência Nacional de Energia Elétrica (Aneel)
- China: China Electricity Council (CEC), National Energy Administration (NEA)
- Germany: Bundesnetzagentur (as reported by Energy-Charts)
- India: National Power Portal (NPP)
- Italy: Terna
- Poland: Agencja Rynku Energii (ARE), Urzędu Regulacji Energetyki (URE) (as reported by instrat)
- Portugal: Redes Energéticas Nacionais (REN)
- South Africa: Eskom
- South Korea: Electric Power Statistics Information System (EPSIS)
- Taiwan: ESIST
- Türkiye: TEİAŞ
- United Kingdom: Department for Energy Security and Net Zero (DESNZ)
- United States: Energy Information Agency (EIA)
Data availability extended to July 2024 for most countries, with the exceptions of Australia, Poland, and the United States, where data was only available up to June 2024 at the time of writing.
Conversion to GW(DC)
Sources vary as to whether they report installed solar capacity in DC or AC. Additionally, the conversion between the two can vary for individual installations. This introduces some uncertainty common to all solar capacity estimates. For the purpose of this forecast, the following countries reporting GW(AC) were standardised to GW(DC) using a factor of 1.3. Brazil, India, Portugal, South Africa, South Korea, the United States, and Türkiye. For China, a lower conversion factor of 1.2 was used.
Estimation of remaining 2024 capacity deployment
To estimate the rate of solar deployment for the remaining months of 2024, the deployment in the available months of 2024 was compared to the same months in 2023. It was assumed that these year-on-year trends would continue for the rest of the year.
For countries where national solar deployment data was not available, estimates were derived from Ember’s China Solar PV export data. Given the uncertainty surrounding the timing of installations relative to exports, a six-month lag was applied to reported exports. Additionally, the data was smoothed using a three-month centred moving average.
The midpoint estimate assumes that 85% of exported capacity results in installations, leading to an estimated 115 GW of solar capacity. Low and high estimates assume installation rates of 60% and 110%, respectively, resulting in a plausible range of 81-149 GW. The high estimate accounts for the possibility that panels stockpiled in 2023 may be installed in 2024, increasing total installations beyond the exports assumed for 2024.
Acknowledgements
Cover Image
Robbert Frank Hagens / Alamy Stock Photo
Related Content
