

Batteries and demand flexibility are ready to scale across the EU
In grid operators’ scenarios, rapid battery growth emerges alongside smart EV charging and heating to reduce reliance on fossil-based flexibility in the EU.
24 Jun 2026
16 Minutes Read


- The EU battery fleet is projected to grow fourfold, from 37 GW in 2025 to 178 GW by 2030. As this growth unfolds, batteries reduce the need for regular gas backup. By 2030, EU batteries could deliver in a single hour over 80% of the power that all EU gas power plants combined can generate in the same period, up from about 20% in 2025.
- The ratio of installed utility-scale battery capacity to installed wind and solar capacity is projected to rise from 3% in 2025 to 12% by 2030, indicating that storage is quickly catching up with renewable deployment. By 2030, EU behind-the-meter batteries could shift 17% of daily rooftop solar generation from midday peaks to high-demand evening hours, up from 9% in 2025.
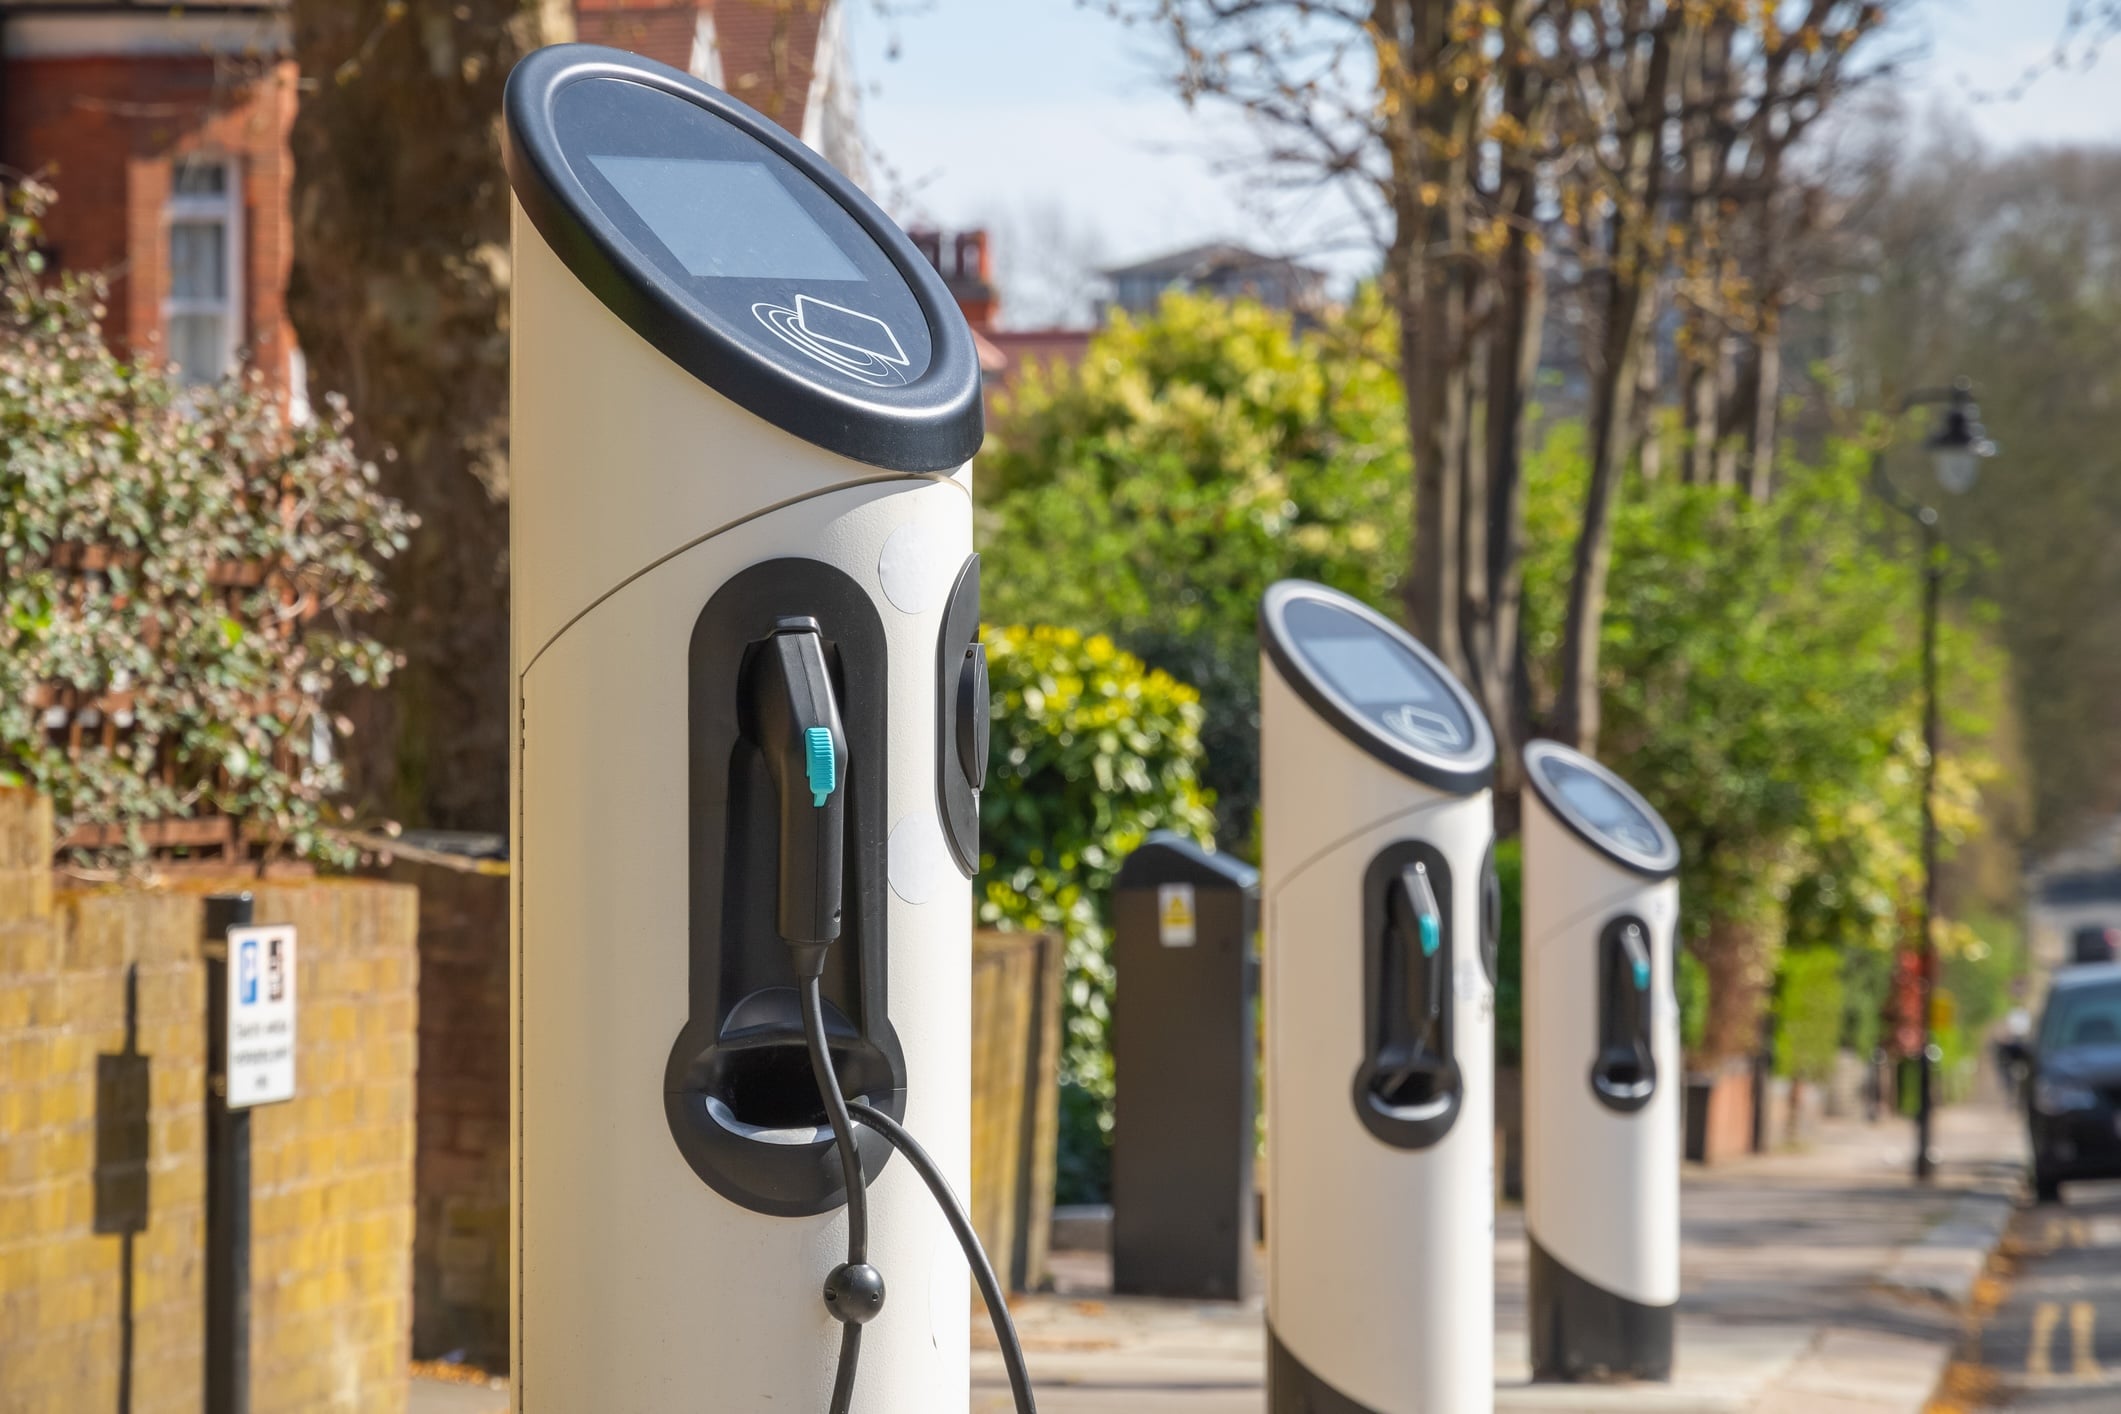
- One in six EU cars could be electric by 2030, and half of these electric vehicles (EVs) could shift charging to periods of high wind and solar output. With automation and consumer incentives, EVs can help smooth peak demand and reduce grid strain. Smart EVs alone would have the potential to absorb around 7% of peak wind and utility-scale solar generation.
- By 2030, one in five EU households could have a heat pump and 15% of heat pump demand could be shifted to periods of high wind and solar output, potentially reducing peak demand by about 3%.
The analysis comes with an open-access dataset providing scenarios for battery storage, electrification and demand flexibility from transport and heating for all 27 EU countries.
Clean flexibility is here. Rapid growth in batteries, EV smart charging and heat pumps can reduce reliance on gas for grid balancing and ease grid strain. The task now is not innovation but execution: remove barriers, reward flexibility and scale these solutions fast enough to avoid locking in unnecessary fossil backup.
A rapid battery rise brings significant flexibility to the EU power system
As batteries become more cost-competitive in the EU, the battery fleet is projected to grow fourfold by 2030 compared with 2025 levels. A larger battery fleet will greatly improve the ability to shift abundant wind and solar power to peak demand hours, facilitating a transition to a power system less reliant on fossil generators.
Batteries become cheaper than gas peakers for new EU capacity by 2030
Falling battery prices are driving rapid battery storage deployment across the EU and globally. Grid-scale battery costs fell to a record low in 2025, continuing a decade-long trend, while installed capacity more than doubled in two years to exceed 10 GW in 2025.
Battery projects are increasingly cost-competitive with new gas power plants for short-term flexibility, while also being faster to build. This reflects both improving battery economies of scale and rising costs for new gas plants, driven by a global shortage of gas-power equipment.
By 2030, utility-scale batteries could deliver short-term flexibility in the EU at 20% lower cost than new gas peakers. ACER estimates capital costs for new investment in 2030 at about 560 €/kW for a 4-hour utility-scale battery, compared with at least 650 €/kW for a new gas peaker (OCGT). These figures may be conservative: estimates from Ember and IRENA suggest battery costs for a utility-scale 4-hour battery project were already around 412 €/kW in 2025, including core equipment, installation and grid connection, with further declines expected.
EU battery capacity can quadruple in five years
If only projects already under construction by the end of 2025 come online by 2030, the EU battery fleet would grow by just 30% compared with 2025 levels, reaching 54 GW. This outcome would reflect a scenario in which policy uncertainty freezes investor interest and slows market growth. The latest EU grid operators’ scenarios, however, expect EU-installed battery capacity could reach 178 GW by 2030, a fourfold increase from 37 GW in 2025, with growth across all EU countries (see Methodology).
That would bring the EU close to AccelerateEU’s indicative storage target of 200 GW, which also includes other storage technologies such as pumped hydro (around 40 GW installed by the end of 2025).
With this growth, by 2030, all EU batteries could shift 10% of daily solar and wind generation from peak production hours to high-demand evening hours, up from 5% in 2025.
Utility-scale batteries have the greatest growth potential, with capacity projected to increase nearly tenfold by 2030 compared with 2025 installed capacity (from 12 GW to 107 GW). A stronger business case for co-locating renewable and battery projects, where a battery and a solar or wind farm share a single grid connection point, is a key factor for this growth. By 2030, utility-scale batteries are expected to be widespread, with 23 of the 27 EU countries at least doubling capacity and 17 adding more than 1 GW.
Behind-the-meter battery capacity is projected to double by 2030, driven by household and business investment. Surveys indicate strong interest – for example, 30% of German homeowners are considering purchasing a home battery within five years. However, high upfront costs remain the main barrier.
By 2030, batteries are projected to nearly match gas in providing short-term flexibility, closing the current gap. In 2025, all EU batteries combined were able to inject into the power grid an amount equal to at most 22% of the maximum hourly output of all EU gas power plants combined. By 2030, this share is projected to exceed 80%.
Batteries are set to catch up with growing wind and solar
By 2030, greater solar and wind capacity will lead to more frequent periods of surplus clean power across the EU, when generation exceeds demand or grid capacity.
Battery storage can capture these surpluses and displace gas, with impact determined by the ratio of battery capacity to wind and solar capacity. As this ratio increases, so does the potential for storing excess generation and reducing gas use. In the EU, the ratio for utility-scale projects is expected to rise from 3% in 2025 to 12% in 2030. Countries with faster utility-scale battery growth, such as Poland, the Netherlands and Italy, could exceed ratios above 15% by 2030, up from below 10% in 2025.
Behind-the-meter batteries alleviate distribution grid bottlenecks
The growing adoption of rooftop solar systems paired with behind-the-meter batteries can help smooth peak solar feed-in, alleviate distribution grid bottlenecks and save consumers money.
In 2025, EU behind-the-meter batteries could enable the shifting of an estimated 9% of daily rooftop solar generation from peak solar hours to evening, non-solar hours. This is projected to rise to 17% by 2030. In Germany, where installed capacity could rise from 14 GW in 2025 to over 30 GW in 2030, batteries could shift as much as 25% of daily rooftop solar generation by 2030, up from 15% in 2025.
Smart EV charging and heat pumps can unlock further clean flexibility
Automation and consumer incentives can unlock substantial demand flexibility from the growing number of electric vehicles and heat pumps across the EU.
Most EU energy consumption can be electrified with mature technologies. Heat pumps and electric vehicles are already scaling across Europe and are expected to accelerate further amid the ongoing fossil fuel crisis. With supportive policies, EVs could reach 16% of the EU road fleet by 2030, up from 3% in 2025, totaling 39 million vehicles. According to projections, heat pump installations could exceed 40 million by 2030 – below the RePowerEU target of 60 million, but nearly double 2025 levels.
The expansion of EVs and heat pumps will raise electricity demand, but AI-enabled automation can align consumption with periods of high wind and solar, reducing grid strain and grid-related costs. Smart EV chargers and heating systems can automatically shift usage to cheaper, cleaner hours.
By 2030, half of EV charging and 15% of heat pump demand could shift to peak wind and solar hours
With supportive demand flexibility policies, around 15% of heat pump electricity use could become price-responsive, cutting EU peak demand by 3% by 2030 (see Methodology).
Additionally, up to 50% of EVs (19.6 million) could be enabled for smart charging, shifting demand to times of abundant renewable generation, reducing curtailment and consumers exposure to higher prices. By 2030, smart EVs could absorb about 7% of peak wind and utility-scale solar generation (see Methodology). Vehicle-to-grid technology could further support peak demand, though EU grid operators expect its impact to stay limited by 2030.
Smart meters and consumer rewards can accelerate demand flexibility
Demand flexibility from electrified transport and heating depends on two key enablers: widespread smart meter rollout and consumer incentives. By 2024, at least half of households in 16 EU countries had smart meters, enabling shifts to lower-cost hours. Adoption varies widely, however: in eight countries, penetration remains low – from less than 5% in Germany to 27% in Romania – while it exceeds 90% in Italy, France and Spain. Some lagging countries are accelerating rollout – for example, in Greece smart meter coverage rose from 1% of households in 2023 to 12% in 2024.
Policy recommendations to scale clean flexibility
Clear policy direction and the removal of existing regulatory barriers at the national level are essential to scale clean flexibility in line with rising electrified demand and rapid wind and solar expansion.
A range of proven solutions – cross-border interconnection, transmission and distribution grids, storage and demand-side flexibility – will play a role in balancing periods of variable renewable output. Among these, battery storage and demand-side flexibility are ready to deliver now and can significantly support a clean power system in both the short and long term.
The following recommendations can help policymakers unlock clean flexibility and reduce reliance on fossil power generation.
Carefully assess the need for new gas capacity
Several EU countries have announced plans to expand gas power capacity. Given the growing potential of clean flexibility, policymakers should weigh the risks of overbuilding fossil assets, including low utilisation, gas supply disruption, high system costs and potential stranded costs at the expense of tax payers. Policy makers should ensure that instruments that incentivize new capacity build-out, such as capacity markets, do not have preferential treatment for fossil flexibility.
Set ambitious non-fossil flexibility objectives
In January 2027, for the first time, all EU countries are expected to release their indicative national objectives for storage and demand flexibility, based on the assessment of their flexibility needs. Those objectives will be recalculated every two years. If matched by a stable policy framework that removes existing barriers to battery and demand flexibility deployment, ambitious targets can accelerate growth.
Ambitious targets should be derived from accurate flexibility needs assessments carried out using robust, independent and transparent data sources and assumptions. Improved data transparency around clean flex deployment is much needed for accurate assessments.
Implement a stable regulatory framework for batteries
The scale of battery fleets across EU countries ultimately depends on policy choices. Stable policy frameworks lead to predictable revenue streams, which allow project developers to attract capital and start construction. Key national policy decisions that unlock battery potential include streamlined permitting for co-located assets, targeted and accelerated grid connection access for batteries or co-located renewables, avoiding double grid charging, allowing battery participations into different markets (including wholesale power and ancillary service markets), as well as clear rules and technical standards. Several Member States, including Bulgaria, Italy and Spain, already demonstrate how policies can accelerate deployment.
Implement policies to scale demand flexibility
Key policy actions to scale demand flexibility include: prioritising smart meter rollout, incentivising grid operators to procure flexibility (TOTEX approach), updating static time-of-use tariffs, eliminating barriers to automation and demand flexibility participation in all markets, including in the wholesale market and for demand flexibility aggregators.
Supporting materials
Download
Download the full report and dataset.
Methodology
We acknowledge the current lack of data transparency and welcome suggestions to enhance both our scenarios and historical data.
Corrections
On June 25, 2026 the text, two charts and the dataset were updated to correct the value for behind-the-meter battery capacity for the Netherlands in 2025.
Battery capacity
Battery installed capacity, when not specified, is expressed in terms of power. The following duration is assumed: 4 and 2.5 hours for utility-scale and behind-the-meter batteries respectively. Sources for capacity are listed below.
Utility-scale, 2025: country-level values collected from the European Energy Storage Inventory (technology= electrochemical, status= operational). We acknowledge that those values differ from values published by grid operators in some cases (France, Spain, Bulgaria) but we use this as the most comprehensive source.
Behind-the-meter, 2025: sourced from different sources: SolarPower Europe, www.battery-charts.de (for Germany), Energy Storage Europe; if no other sources available, estimates were based on LCPDelta/EASE data for 2023.
Utility-scale and behind-the-meter, 2030: estimated combining Ten Years Network Development Plan (TYNDP) Scenarios Input Data, reflecting EU transmission grid operators’ views, with Ember research on national ambitions and information received through consultations with Europe Storage Association (EASE). Germany’s projected battery growth based on Network Development Plan Electricity 2037/2045 (2025), second draft, published by the four German transmission system operators in March 2026.
Benchmarking for 2030: assuming a 4 and 2.5 hours duration for utility-scale and behind-the-meter batteries respectively, projected total EU 2030 battery energy capacity totals 603 GWh, aligning with the Solar+ scenario published by SolarPower Europe in 2026 – which assumes the deployment of 598 GWh of batteries in the EU by 2030.
Battery shifting potential
The shifting potential is computed as the fraction of an average day’s rooftop solar production that could theoretically be stored if co-located behind-the-meter batteries cycle once per day. In other words, this is the share of behind-the-meter solar generation that can be shifted in time (e.g. from solar to non solar hours) with behind-the-meter batteries. It is estimated based on yearly electricity data for behind-the-meter solar generation and behind-the-meter battery capacity installations in GWh. Behind-the-meter battery capacity installations in GWh were computed starting from values in GW from various sources for 2025 and 2030 (see above), assuming a 2.5 hours duration. Yearly behind-the-meter solar generation estimated starting from installed capacity in GW for 2025 and 2030, sourced from SolarPower Europe and TYNDP26 respectively, assuming a 12% capacity factor.
The solar generation in GWh is divided by the number of days to produce the average daily production. The battery capacity installed is then divided by the daily solar generation, assuming one full cycle per day, as an order of magnitude estimate of how much of the daily solar generation can be absorbed by the battery capacity on the average day.
This represents a theoretical average shifting potential and does not account for temporal mismatches, self-consumption of solar generation, seasonal variability, or operational constraints.
Electric vehicles stock and shares (2025 and 2030)
Only battery electric cars (BEV) are accounted for within the present report, thus excluding vans and plug-in hybrid electric vehicles (PHEVs). This choice allows for a conservative simplification of transport electrification modelling, while still pointing to the de-facto largest and most promising category in the context of power system flexibility. The focus is on passenger vehicles.
For 2025, country-level BEV passenger car stock shares are the ratio between the n. of BEV passenger cars (M1) in 2025 (from the European Alternative Fuels Observatory) and the estimated total n. of passenger cars in 2025. The latter is derived from a linear interpolation of Eurostat’s published passenger car numbers for the 2020–2024 period.
For 2030, country-level BEV passenger car stock shares are computed indirectly by combining the “transport_car_using_electricity_number_of_units” output and “transport_car_using_electricity_share” input from the Energy Transition Model (ETM) dashboards within the TYNDP 2026 Scenarios Input Data. Both variables are derated by about 80% to adjust for the inclusion of PHEVs in the ETM data, which are approximated to make up for around 30% of EV units yearly sales and to mount batteries with energy capacity lower than one third than for an average BEV.
Electric vehicles flexibility potential
Flexibility estimates for EVs focus on passenger BEVs, which can be considered as the most impactful sub-sector in terms of effects on a country’s national power grid by 2030.
Smart charging: We assume that 15% of EVs are enabled for smart charging in 2025, consistently with the most conservative option (“Business as usual” option) in the TYNDP 2026 Scenarios Draft Market Modelling methodologies, which is assumed to represent the current status of the fleet. Based on the same source, we assume that this share rises to 50% by 2030 (“Balanced” option).
V2G: We assume that only a share of EVs that are enabled for smart charging are able to do V2G, due to uncertainty about technical feasibility and participation rates for this technology, especially for street charging. The share of EVs that are also able to do V2G is assumed to be zero in 2025 and 30% in 2030, with the latter figure corresponding to the target percentage of vehicles equipped for it in the “Coalition of the Willing on Bidirectional Charging” report.
BEV flexibility potential (upward and downward): For 2025, country-level BEV electricity peak regulation potential is computed starting from charging infrastructure, with weighted averages from data collected from the European Alternative Fuels Observatory platform (AC and DC recharging points, excluding “Ultra-fast DC recharging”, which could have limited applications for passenger transport).
At-home charging flexibility is constrained by smart meter rollout, assuming a 3 kW charging capacity cap. Consistently with the most conservative option in the TYNDP 2026 Scenarios Draft Market Modelling methodologies, the share of enabled smart charging is capped at 15%.
Downwards potential in 2025 is neglected, due to the presence of vehicle-to-grid (V2G) applications only at pilot phase in Europe at present.
For 2030 country-level BEV electricity peak regulation potential, a 1 charger per 10 BEV ratio is considered across Europe as recommended in the Charging ahead report by ACEA, while assuming a smart meter rollout catch-up by most countries up to the current 90th percentile (99%).
At-home charging maximum power capacity is raised to 11 kW.
Consistently with the “Balanced” option in the TYNDP 2026 Scenarios Draft Market Modelling methodologies, the share of enabled smart charging is capped at 50%. Downwards potential is calculated starting as a share of upwards flexibility, by scaling the latter proportionally to the ratio between assumed share of smart-charging BEVs and assumed share of V2G-enabled BEVs, which results in a factor of 60%.
To account for user comfort, smart charging is bound to happen only when a plugged car’s battery is charged between 20% and 80% of its full capacity.
It is important to note that both upwards and downwards peak regulation potentials are estimates created with the aim to illustrate the highest possible contributions to electrical grid flexibility from a country’s EV fleet in terms of instantaneous power, which however in reality depend on traffic conditions and user behavior.
Heat pump installed capacity (2025 and 2030)
Heat pump capacity in this study aims to represent a range of heat pump technologies (mostly air/air, air/water and ground source) and applications (private, commercial, district heating).
Following consultations with experts from the European Heat Pump Association (EHPA), average thermal capacities of 7 kW and 10 kW were assigned to a representative heat pump unit for 2025 and 2030 respectively. Behind this increase in capacity lies the assumption that more of this technology will be used for high-power purposes such as industrial complexes and district heating.
For 2025, country-level heat pump stock numbers are collected from EHPA’s Annual Report 2025, as the sum between the number of heat pumps at the beginning of 2024 and the number of heat pumps sold during 2024. For countries not available, data was estimated starting from JRC Heat Pump Market Country Fiches. In case no reasonable interpolation or conservative estimate could be extracted from the latter source, no heat pump is reported.
For 2030, country-level heat pump stock numbers are computed starting from a European (EU27 + Switzerland, Norway, UK) total of 44.9 million installed heat pumps, derived from the 449 GW aggregate in “The Future of Heat Pumps” report by the IEA, divided by the representative unit thermal capacity indicated above.
Actual values are then estimated by keeping the same geographical distribution only for countries with a 2024 density of HPs installed per thousand household lower than 200, while for early-adopters (Denmark, Estonia, Finland, France, Sweden, Norway) the 2024 heat pump additions per thousand households are projected out for the next 6 years, to avoid unrealistic saturation.
2030 Europe total heat pump capacity from IEA (Heat pump capacity in buildings in the Announced Pledges Scenario, 2021-2030) was distributed amongst countries according to their 2024 HP installed capacity from EHPA, except for countries with high (>200 HPs per 1000 households) densities. In this case, 2030 capacities were calculated by projecting 2024 HP additions per 1000 households out to 2030 so as to not inflate the numbers beyond feasible limits.
Heat pump flexibility potential
Country-level heat pump peak shifting potential is expressed in terms of electrical power by assuming a conservative average Coefficient Of Performance (COP) of 3, which is on the lower end of a typical range of operation.
Flexibility potential in 2025 is assumed to be negligible, hence set to zero for all countries.
Projections for 2030 are constrained by smart meter rollout, similarly to what is done for BEV peak regulation potential.
Additionally, estimates are derated by a series of factors, which were modelled after consultations with Voltalis, preliminary results from a PyPSA sector-coupled model and Ember research:
– Heating demand that can be shifted without impacting user comfort (dependent on building insulation): 40% for 2030
– Heating demand that can be technically automated: 25% in 2030
– Willingness of users to shift to ToU tariffs or to adapt their consumption to hourly price profiles: 40% in 2030.
– Heating demand that is served by heat pumps: 60% in 2030
– Share of daily heat demand that can be shifted by at least one hour (dependent on distance between consumption peaks, during which shifting is not possible) 50% for 2030
It is important to note that peak shifting potentials are estimates created with the aim to illustrate the highest possible contribution to electrical grid flexibility from a country’s heat pumps in terms of instantaneous power, which however in reality depend on weather conditions and user behavior.
Smart meter roll-out
Data used in this report refers to the latest available data reported for 2023 and 2024 by ACER, it refers to the share of household consumers with smart meters, as measured by metering points. Due to lack of data, 2024 datapoints for Bulgaria, Czechia, Hungary and Slovakia assumed to be the same as in 2023.
According to latest monitoring data from the Germany’s Federal Network Agency, the share of metering points with smart meters in Germany was 5.5% by the end of 2025.
Definitions
Utility-scale batteries: a utility-scale battery (also known as a grid-scale battery or front-of-the-meter battery) is an energy storage system connected directly to the transmission or distribution electricity grid on the utility side of the meter.
Behind-the-meter batteries (BTM): a battery storage system installed on a customer’s property (residential, commercial, or industrial) on the user’s side of the meter.
Smart EV charging: an intelligent system for the charging of electric vehicles (EVs) that automatically adjusts charging times and speeds based on grid demand, electricity prices and renewable energy availability.
Smart heat pump: an intelligent heating system that automatically adjusts heat pump operation based on grid demand, electricity prices and renewable energy availability – for example, preheating when electricity is cheap and abundant to avoid peak-demand stress while maintaining comfort.
Vehicle to grid (V2G): a technology that allows electric vehicles (EVs) to not only draw power from the electrical grid to charge but also inject stored power back into the grid.
Static time-of-use tariff: a retail price structure with pre-determined fixed rates for electricity for specific daily periods. When set correctly, it gives consumers cheaper electricity – for example, charging EVs midday during plentiful solar generation or pre-heating buildings outside expensive peak hours.
Dynamic time-of-use tariff: a retail price structure with variable rates for electricity for specific daily periods (e.g., hours) indexed to hourly electricity wholesale prices
Acknowledgements
Ember: Lauren Orso, Pawel Czyzak, Izabela Urbańska, Eli Terry, Biqing Yang
We thank Beyond Fossil Fuels, Energy Storage Europe, EHPA and Voltalis for their valuable feedback on our scenario assumptions. The analysis and data in this report do not necessarily reflect the views of these organisations, but solely those of the authors.
Related Content

Analysis
A quarter of EU power came from solar for the first time in June
14 July 2026

Analysis
UK's largest emitter Drax reports record emissions in 2025
09 July 2026

Analysis
Energy Institute Statistical Review of World Energy
30 June 2026
Analysis
The solarisation of Pakistan’s energy economy
25 June 2026