Harnessing the winds | Ember

Harnessing the winds

Solar and batteries can already deliver firm power at a competitive cost across much of the world. Adding wind makes it cheaper still for the vast majority of the world, because wind and solar produce at different times of day and in different seasons. Matching the different cycles of solar and wind eases the path to firm renewables.

12 Nov 2026
16 Minutes Read
Download PDF

Highlights

~$20/MWh
Cost reduction from adding wind to solar and batteries: the median cost of meeting 90% of demand falls from $105 to $86/MWh.
$89/MWh
Median cost of firm solar and wind power, covering all demand with batteries and a little backup.
Once every ~4 years
A solar and a wind lull strike in the same week – a Dunkelflaute, German for a dark, windless lull – on average across the world, weighted by electricity demand. A solar lull alone comes roughly four times a year.

For two centuries, we have hunted down and gathered energy stored by nature in coal, oil and gas, searching for it across the globe. Solar and wind change that: we now harvest energy from our own fields, with the rhythms of the weather and the seasons. The challenge is familiar to any farmer: making different harvests work together, so that when one falls short, another can make up the difference.

Our analysis shows just how much that matters. Adding wind to solar and batteries cuts the cost of meeting 90% of electricity demand by nearly a fifth globally, and by two-fifths in northern regions. Solar and wind follow different daily and seasonal cycles, and even prolonged periods of weak output rarely coincide. Combining them makes power more reliable, reduces storage needs and lowers costs almost everywhere.

With wind, three-quarters of global electricity demand lies in regions where renewables could already meet 90% of demand for under $100/MWh. For the same money, adding wind can raise that share from 80% to 95%. Most planned coal and gas capacity is already in regions where fully reliable power built around renewables could cost under $100/MWh. The lesson is an old one from farming: growing different crops gives you a more stable and economic harvest.

We already know that solar and wind are cheap. The much more interesting question is how cheaply we can make them reliable. And the answer is increasingly clear: by combining solar, wind and batteries, we can deliver reliable power at remarkably low costs almost everywhere in the world. That’s a pretty fundamental shift in the economics of energy.

From cheap to firm

For decades, the question about solar and wind was whether they could be cheap enough to compete with fossil power. That question is settled: across most of the world, they are now the cheapest new source of electricity, and onshore wind is the cheapest of all on global average.

The next question is whether wind and solar can deliver power when it is needed, rather than simply when the weather allows. The answer will determine whether renewables can replace coal and gas, or merely supplement them. It is a harder challenge, rooted in a fundamental difference: fossil fuels can be extracted and burned on demand, while renewables must be harvested with the rhythms of nature.

Solar and batteries have already gone a long way towards meeting this challenge. In Harnessing the Sun, we found that together they could meet 80% of electricity demand for under $100/MWh for four in five people worldwide. But solar alone has its limits. Like any crop, it has its bad seasons: short winter days and prolonged stretches of cloud can leave even a solar-and-battery system struggling to meet demand.

Wind is the second crop, and it grows in different weather. Solar follows the path of the sun. Wind follows weather systems: it often blows hardest when skies are grey and stormy, and in much of the world it is strongest in the colder months. That makes wind a natural complement to solar power.

To see how far wind takes us, we added it to the atlas behind ‘Harnessing the Sun’ and ran every region of the world through ten years of hourly weather. We set the toughest test we could: baseload demand – the same every hour, day and night, summer and winter. Real demand is kinder, and more of it can be moved to other hours each year. So the costs here are a stress test, not a forecast: real systems should do better.

Our benchmark is uptime: the share of that demand a system meets from its own solar, wind and batteries, hour by hour. We use 90%, with gas or diesel backup for the rest when the goal is fully firm power. Seven findings stand out, most of them widely underappreciated.

1. Wind cuts the cost of firm renewables by nearly a fifth

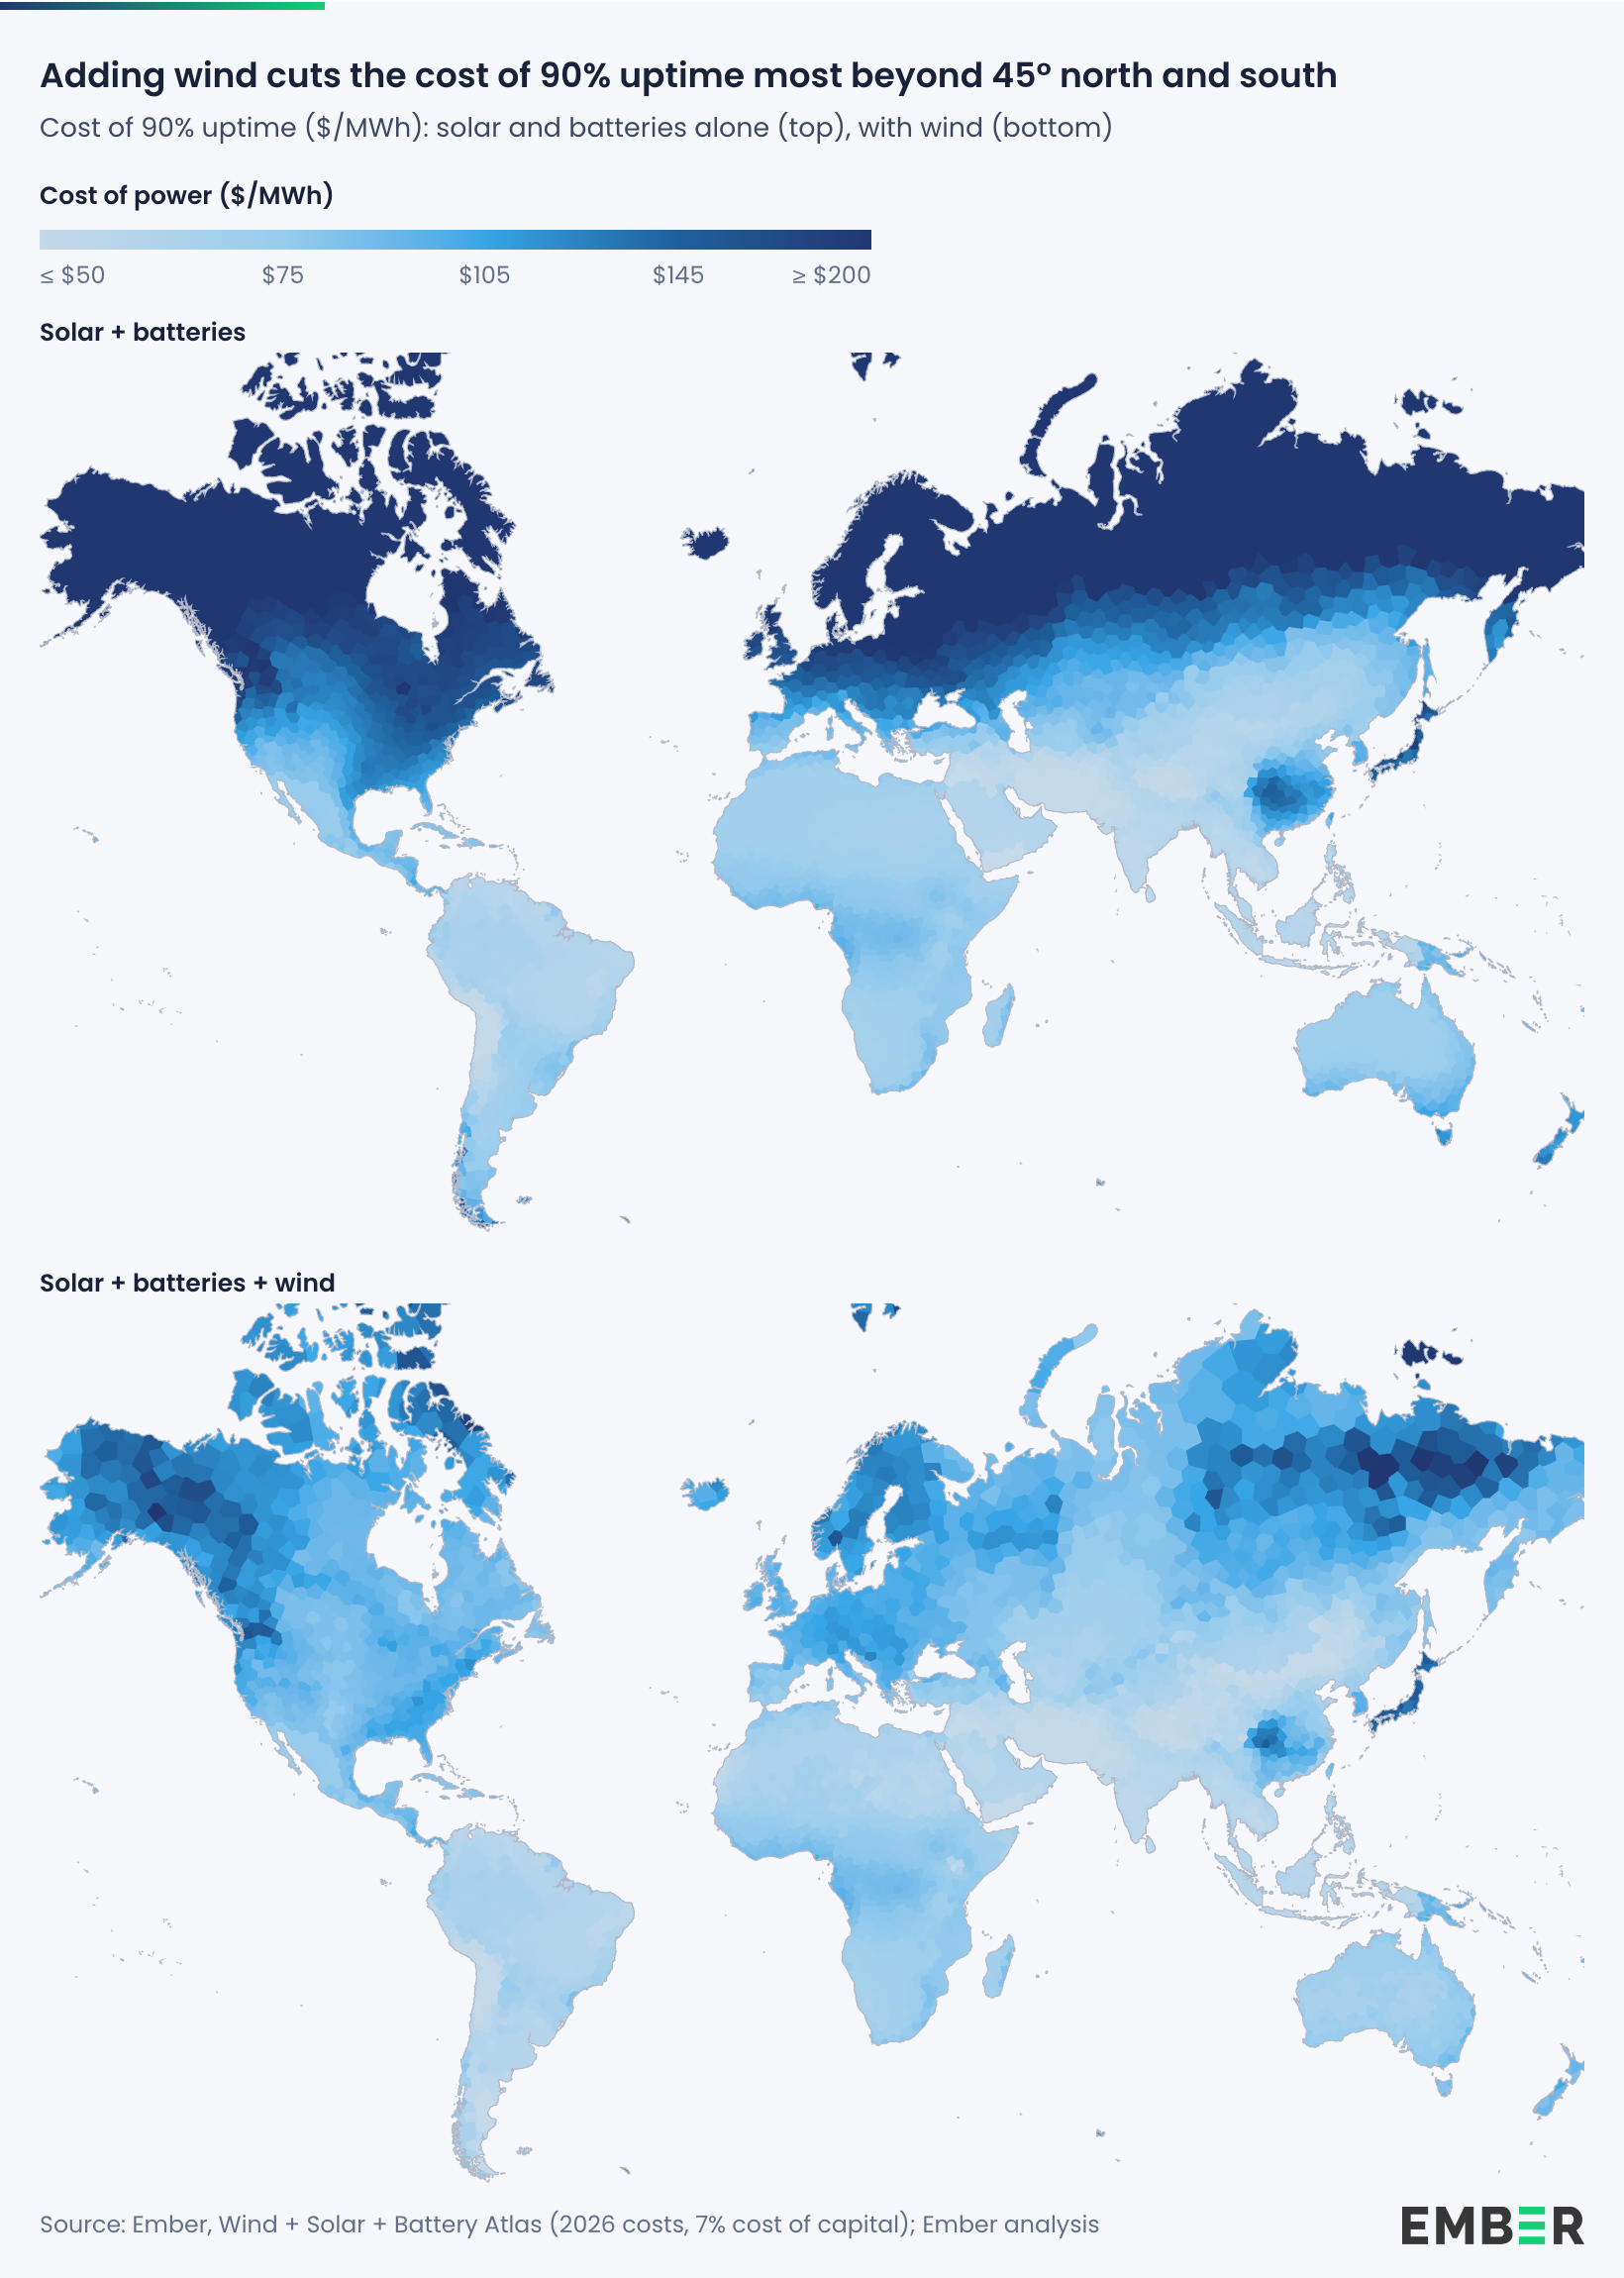
Adding wind to solar and batteries cuts the median cost of reaching 90% uptime by nearly a fifth, from $105 to $86/MWh.

The reason is storage. The cost of firm renewables is set by the gaps: the hours, days and weeks when solar output falls short of demand. Batteries cover short gaps cheaply. Long gaps are expensive, because a battery sized for a rare shortfall sits idle most of the year.

Wind fills many of these gaps directly, because its output follows weather systems rather than the sun. That cuts the storage a system needs. In Canada, the battery needed for 90% uptime shrinks from 24 hours of load to 10; in the US, from 20 to 12; in Europe, from 20 to 12; in China, from 18 to 12. Only nearer the equator does wind change little: in India the battery stays at 14 hours.

With wind, three-quarters of the world’s electricity demand can have 90% uptime for under $100/MWh. Without it, only half.

What finance does to these numbers

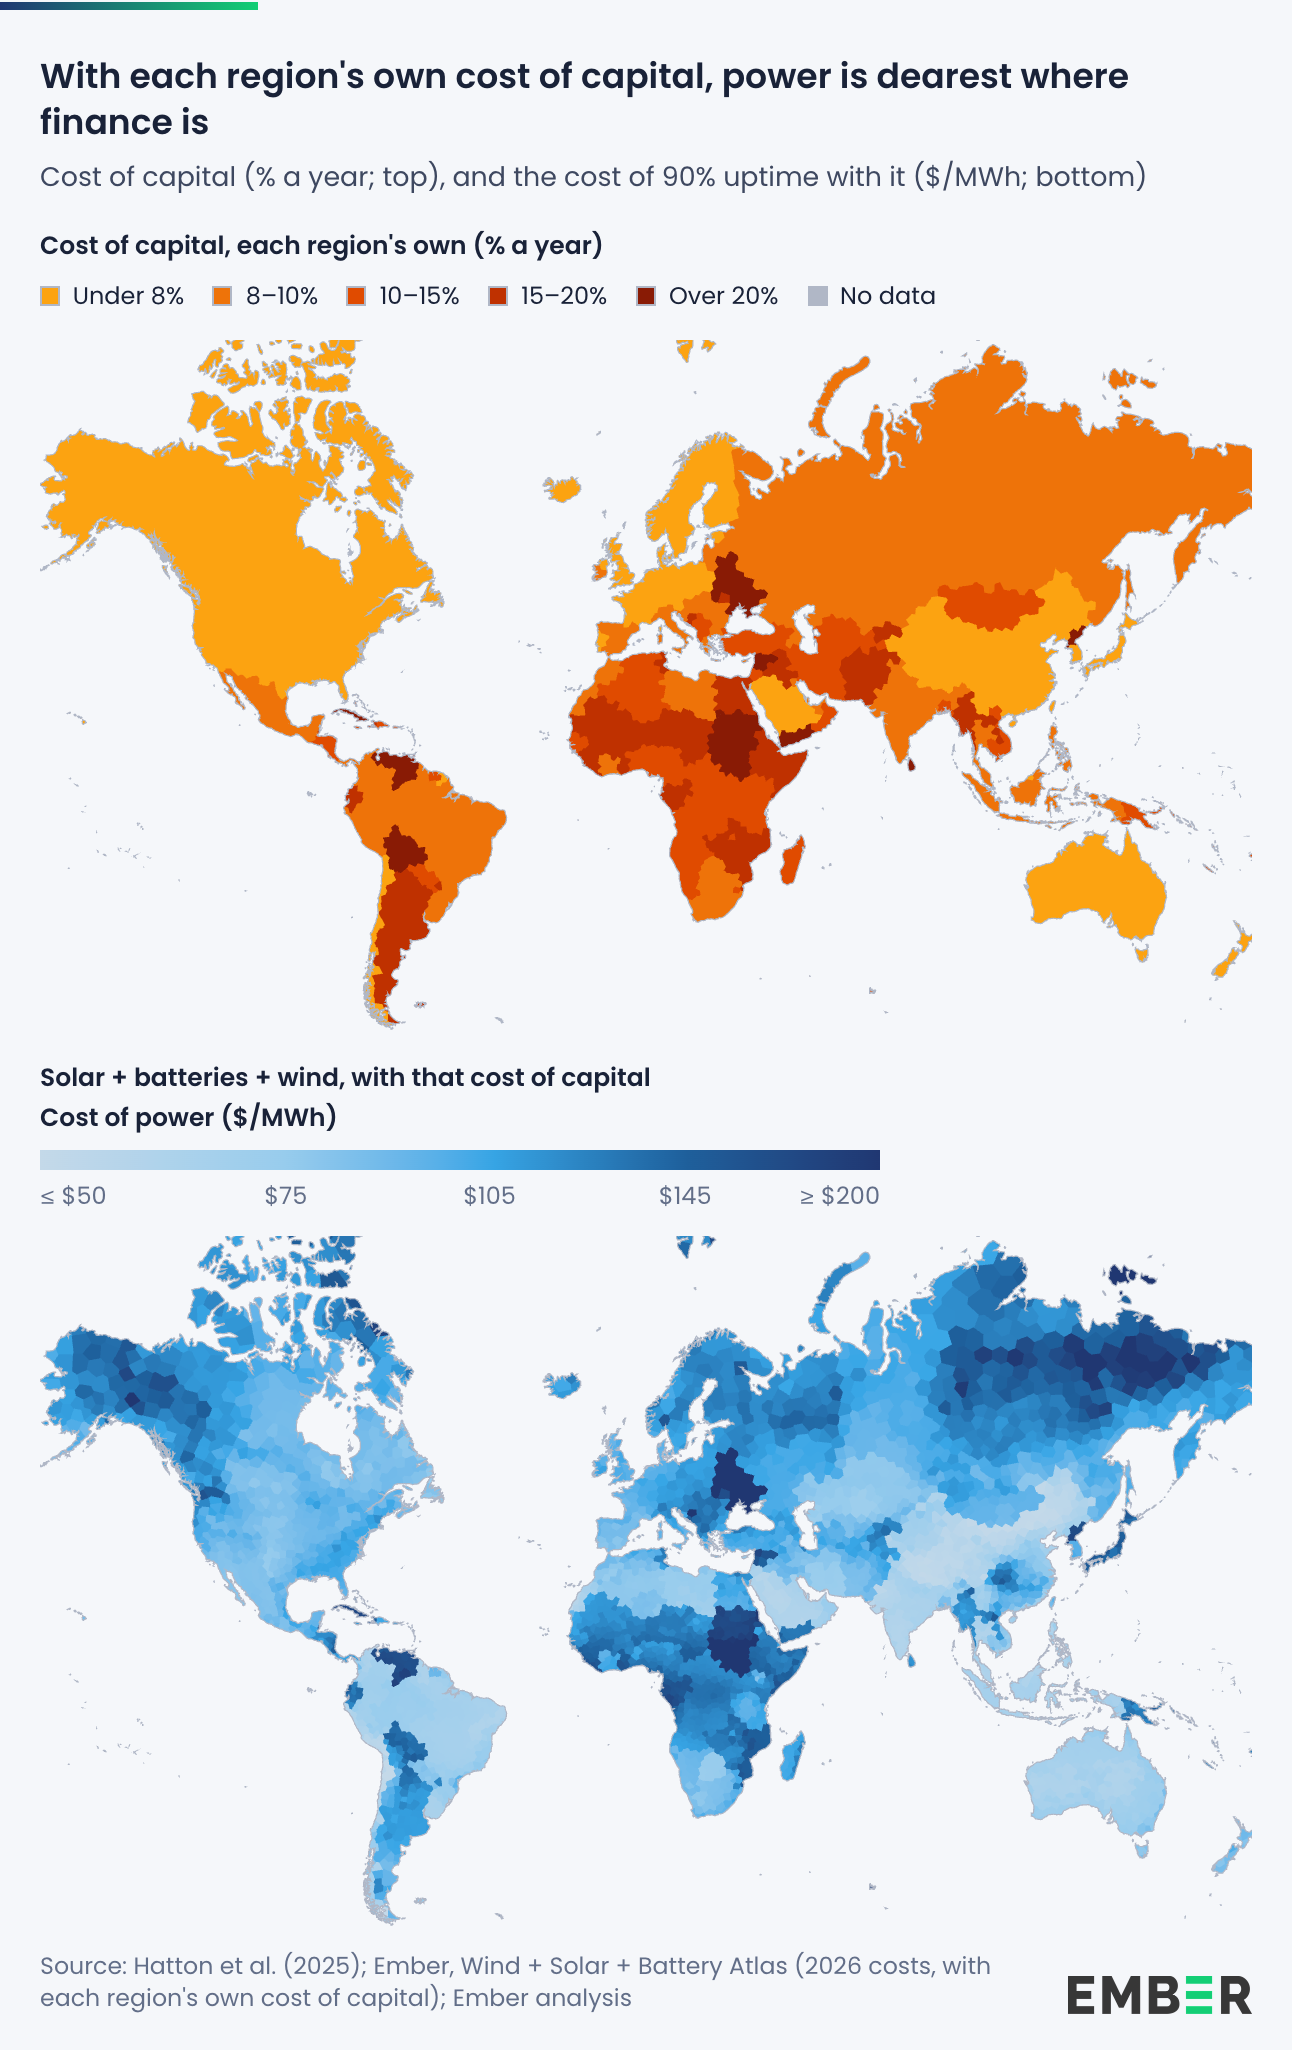
These costs assume the same cost of capital everywhere: 7% a year. In reality it varies widely, and it weighs heavily on solar, wind and batteries, which are paid for up front. Where the median person in Africa lives, it is 14%; where the median person in Europe lives, 8%.

Using each region’s own cost of capital changes the picture. In Europe it barely matters: the median cost of 90% uptime with wind rises from $99 to $104/MWh. In Africa it rises from $76 to $126/MWh. That extra $50 is the price of expensive finance, not of a poor resource: at the same cost of capital, firm power in Africa is cheaper than in Europe. The rest of this article holds the cost of capital at 7%, to compare what the resource and the technology allow.

2. Wind levels out the cost of firm power across the globe

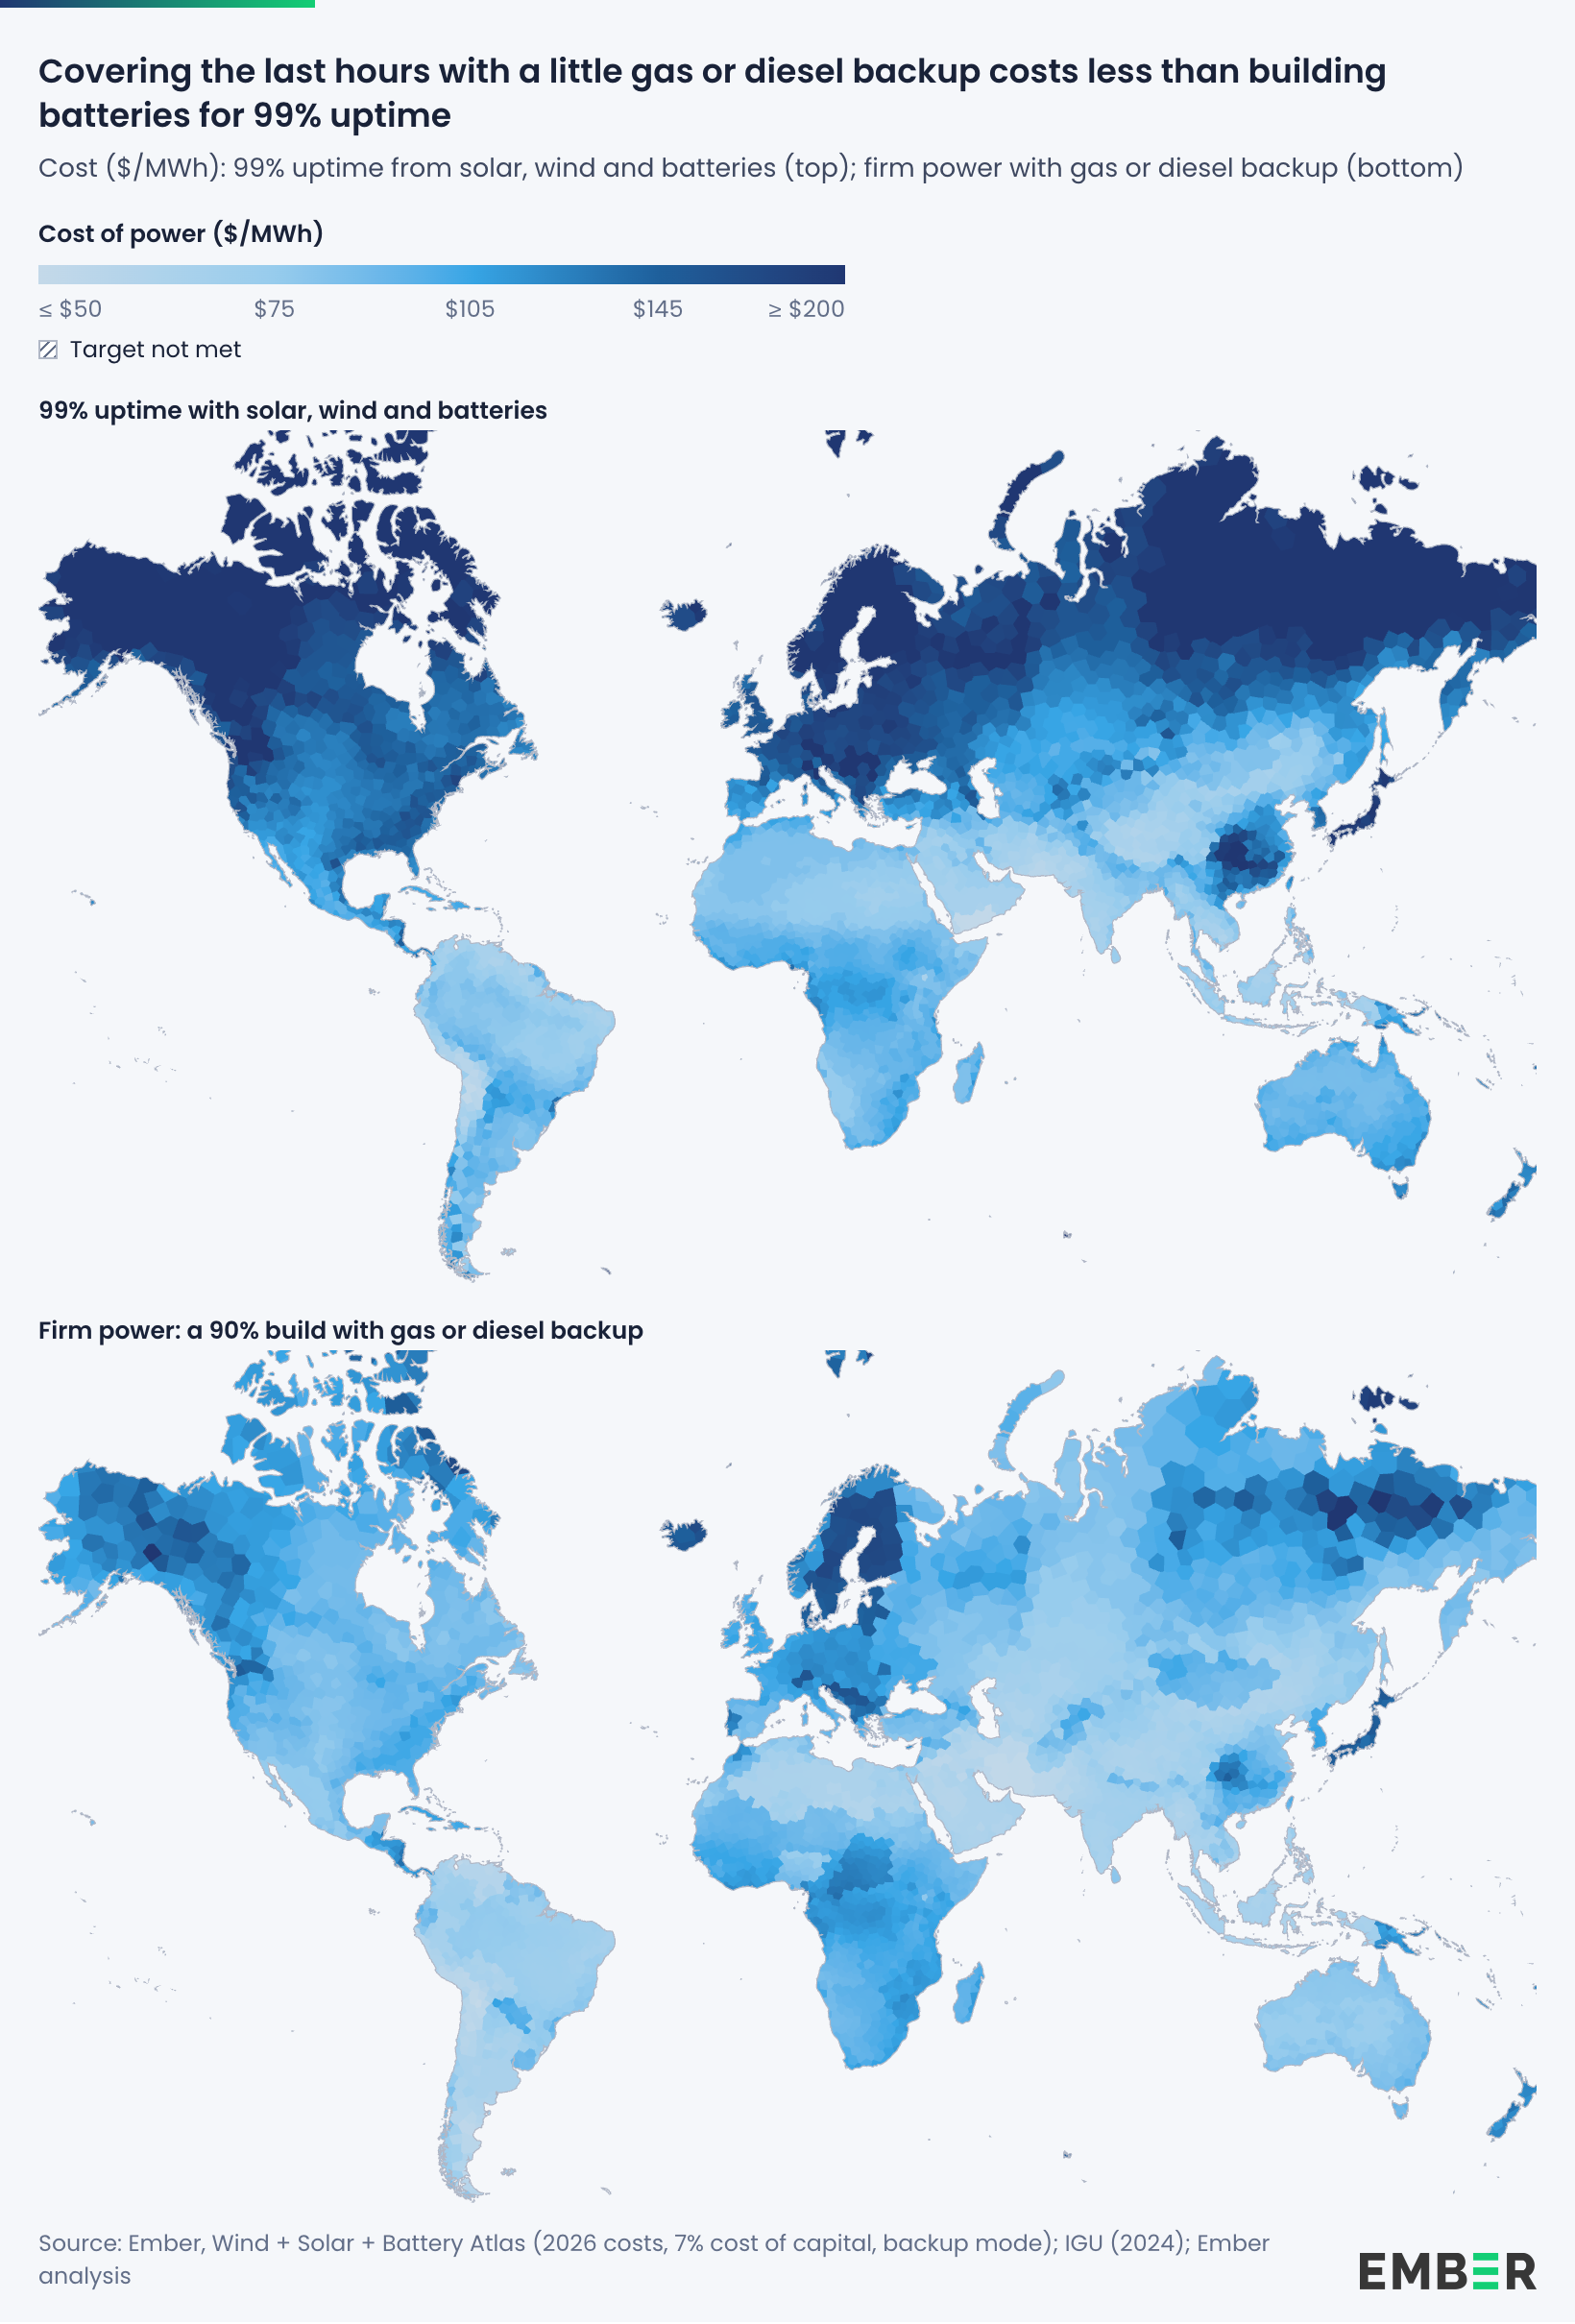
Without wind, the cost of firm renewables depends on latitude. Near the equator, solar and batteries reach 90% uptime for under $60/MWh. Above 55°N, the same target costs $280. Add wind, and the cost stays under $100/MWh at every latitude.

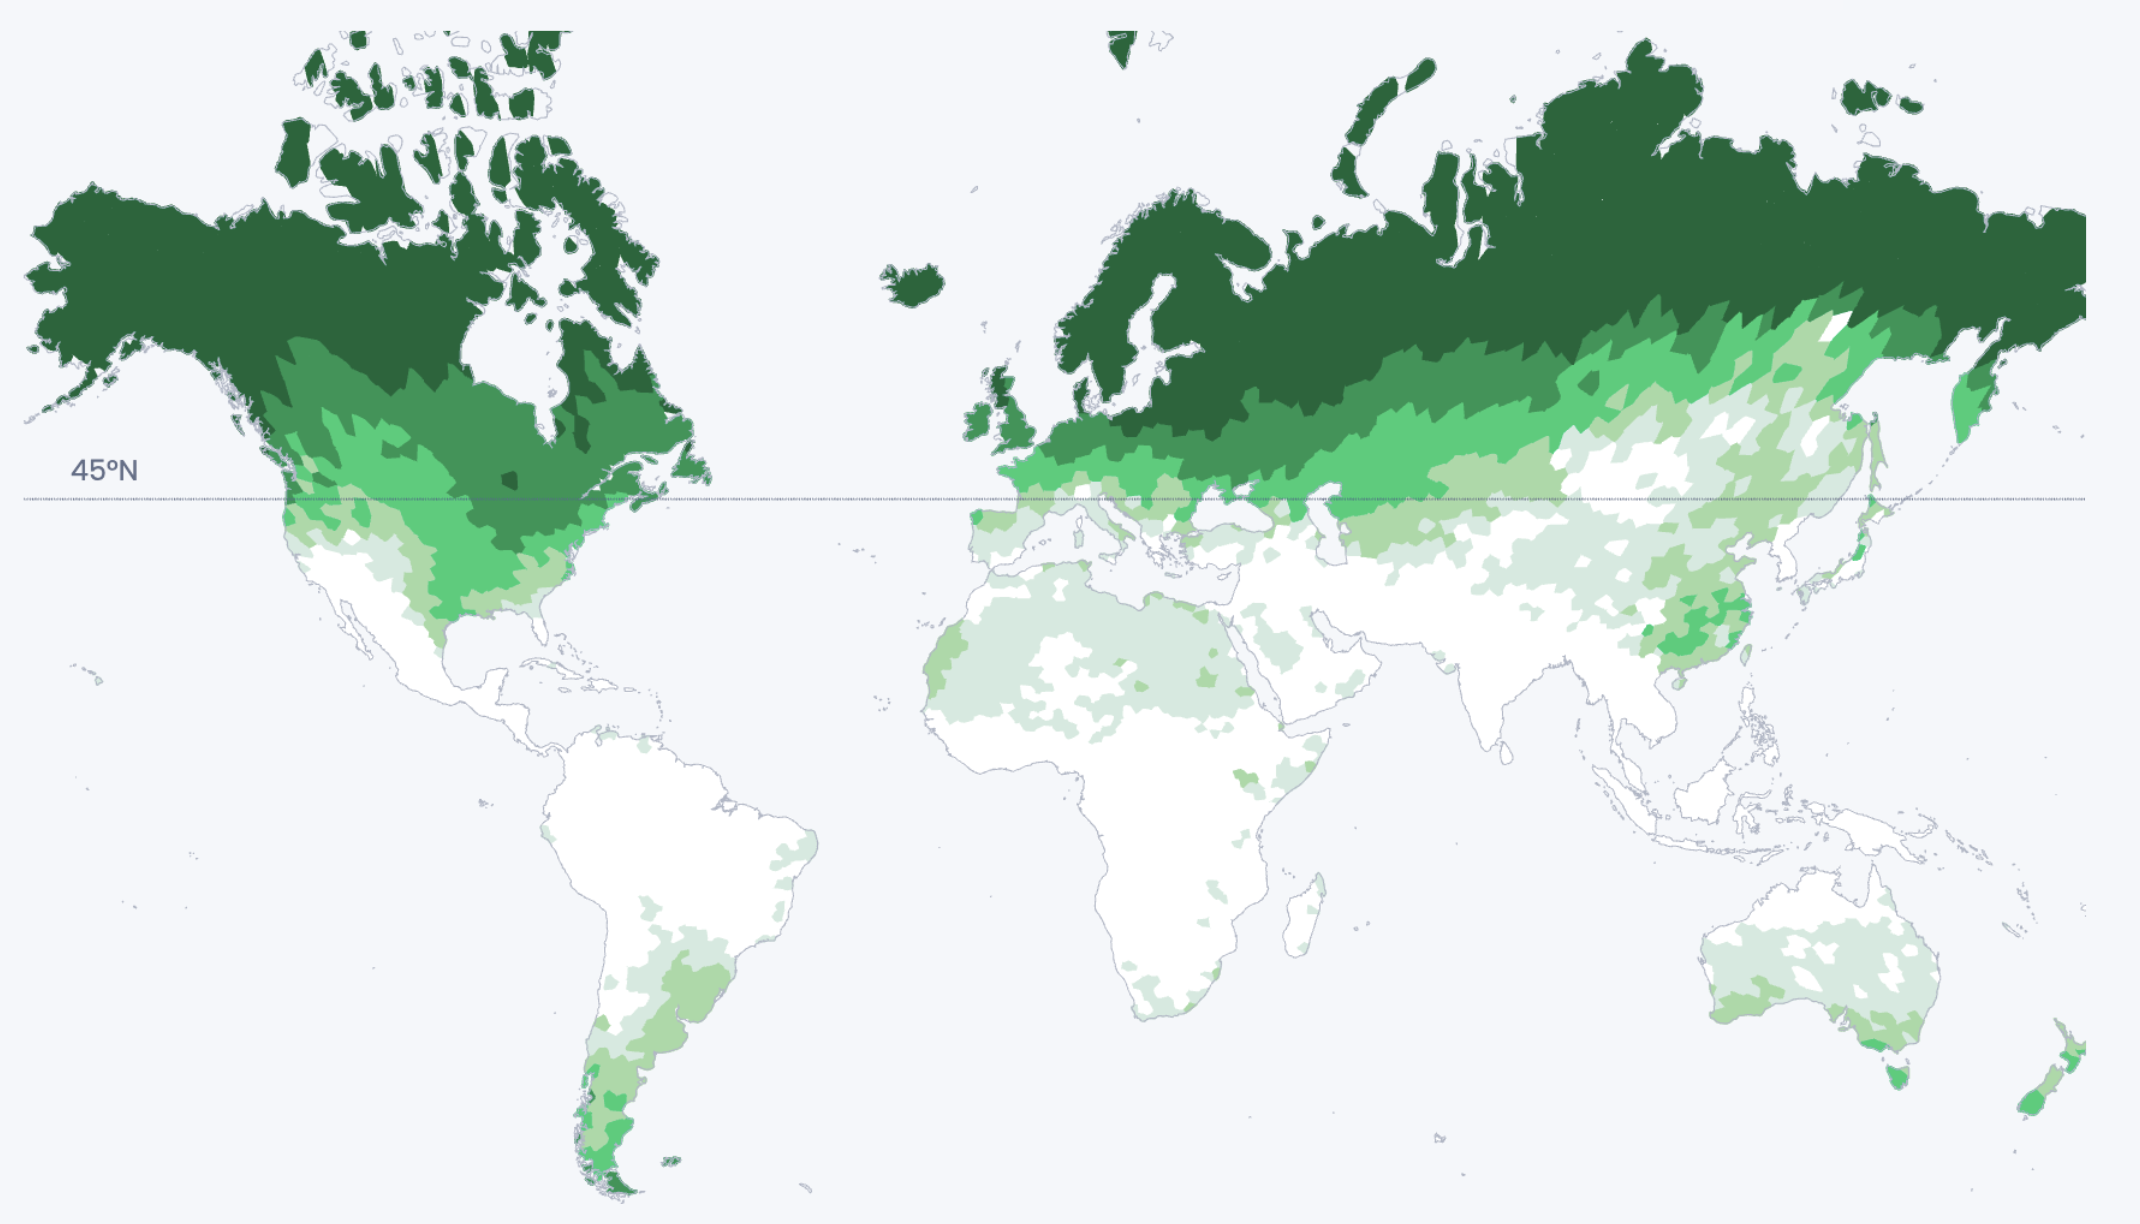
Solar’s gaps grow with distance from the equator: shorter days, lower sun and more overcast weather, all at their worst in winter – when wind is strongest. North of 45°N, wind cuts the median cost of 90% uptime by two-fifths, from $164 to $99/MWh. The same holds in the far south: in Chile and Argentina south of 40°S, wind cuts it by a third, from $94 to $63/MWh.

The reason is the seasons. The further from the equator, the more solar output swings between summer and winter – and wind leans the other way. Across Europe, wind produces most in the dark months and least in summer, the mirror image of solar. In Germany, wind delivers 44% of its yearly output between November and February, against 12% for solar. A system with both has production in every season.

That matters because much of the world’s electricity is used far from the equator: 25% of demand lies north of 45°N. Without wind, cheap firm power would be an advantage of the sunbelt, the band within 30° of the equator. With wind, cheap firm power is available almost everywhere electricity is used – and so are the competitive gains for energy-intensive industries that come with it.

Most of the world’s people live in the sunbelt, where solar and batteries are already cheap and the savings from adding wind are smaller. Beyond it, wind does the heavy lifting: it lowers the cost for three in four people more than 30° from the equator, and for almost everyone beyond 45°.

The low costs are where people live, not only in deserts and on windswept plains. Where people live, the median cost of 90% uptime with wind is $70/MWh. Add backup for the remaining hours, and more than three-quarters of the world’s people live where firm solar and wind power costs under $100/MWh.

3. Bad weeks for solar and wind rarely coincide

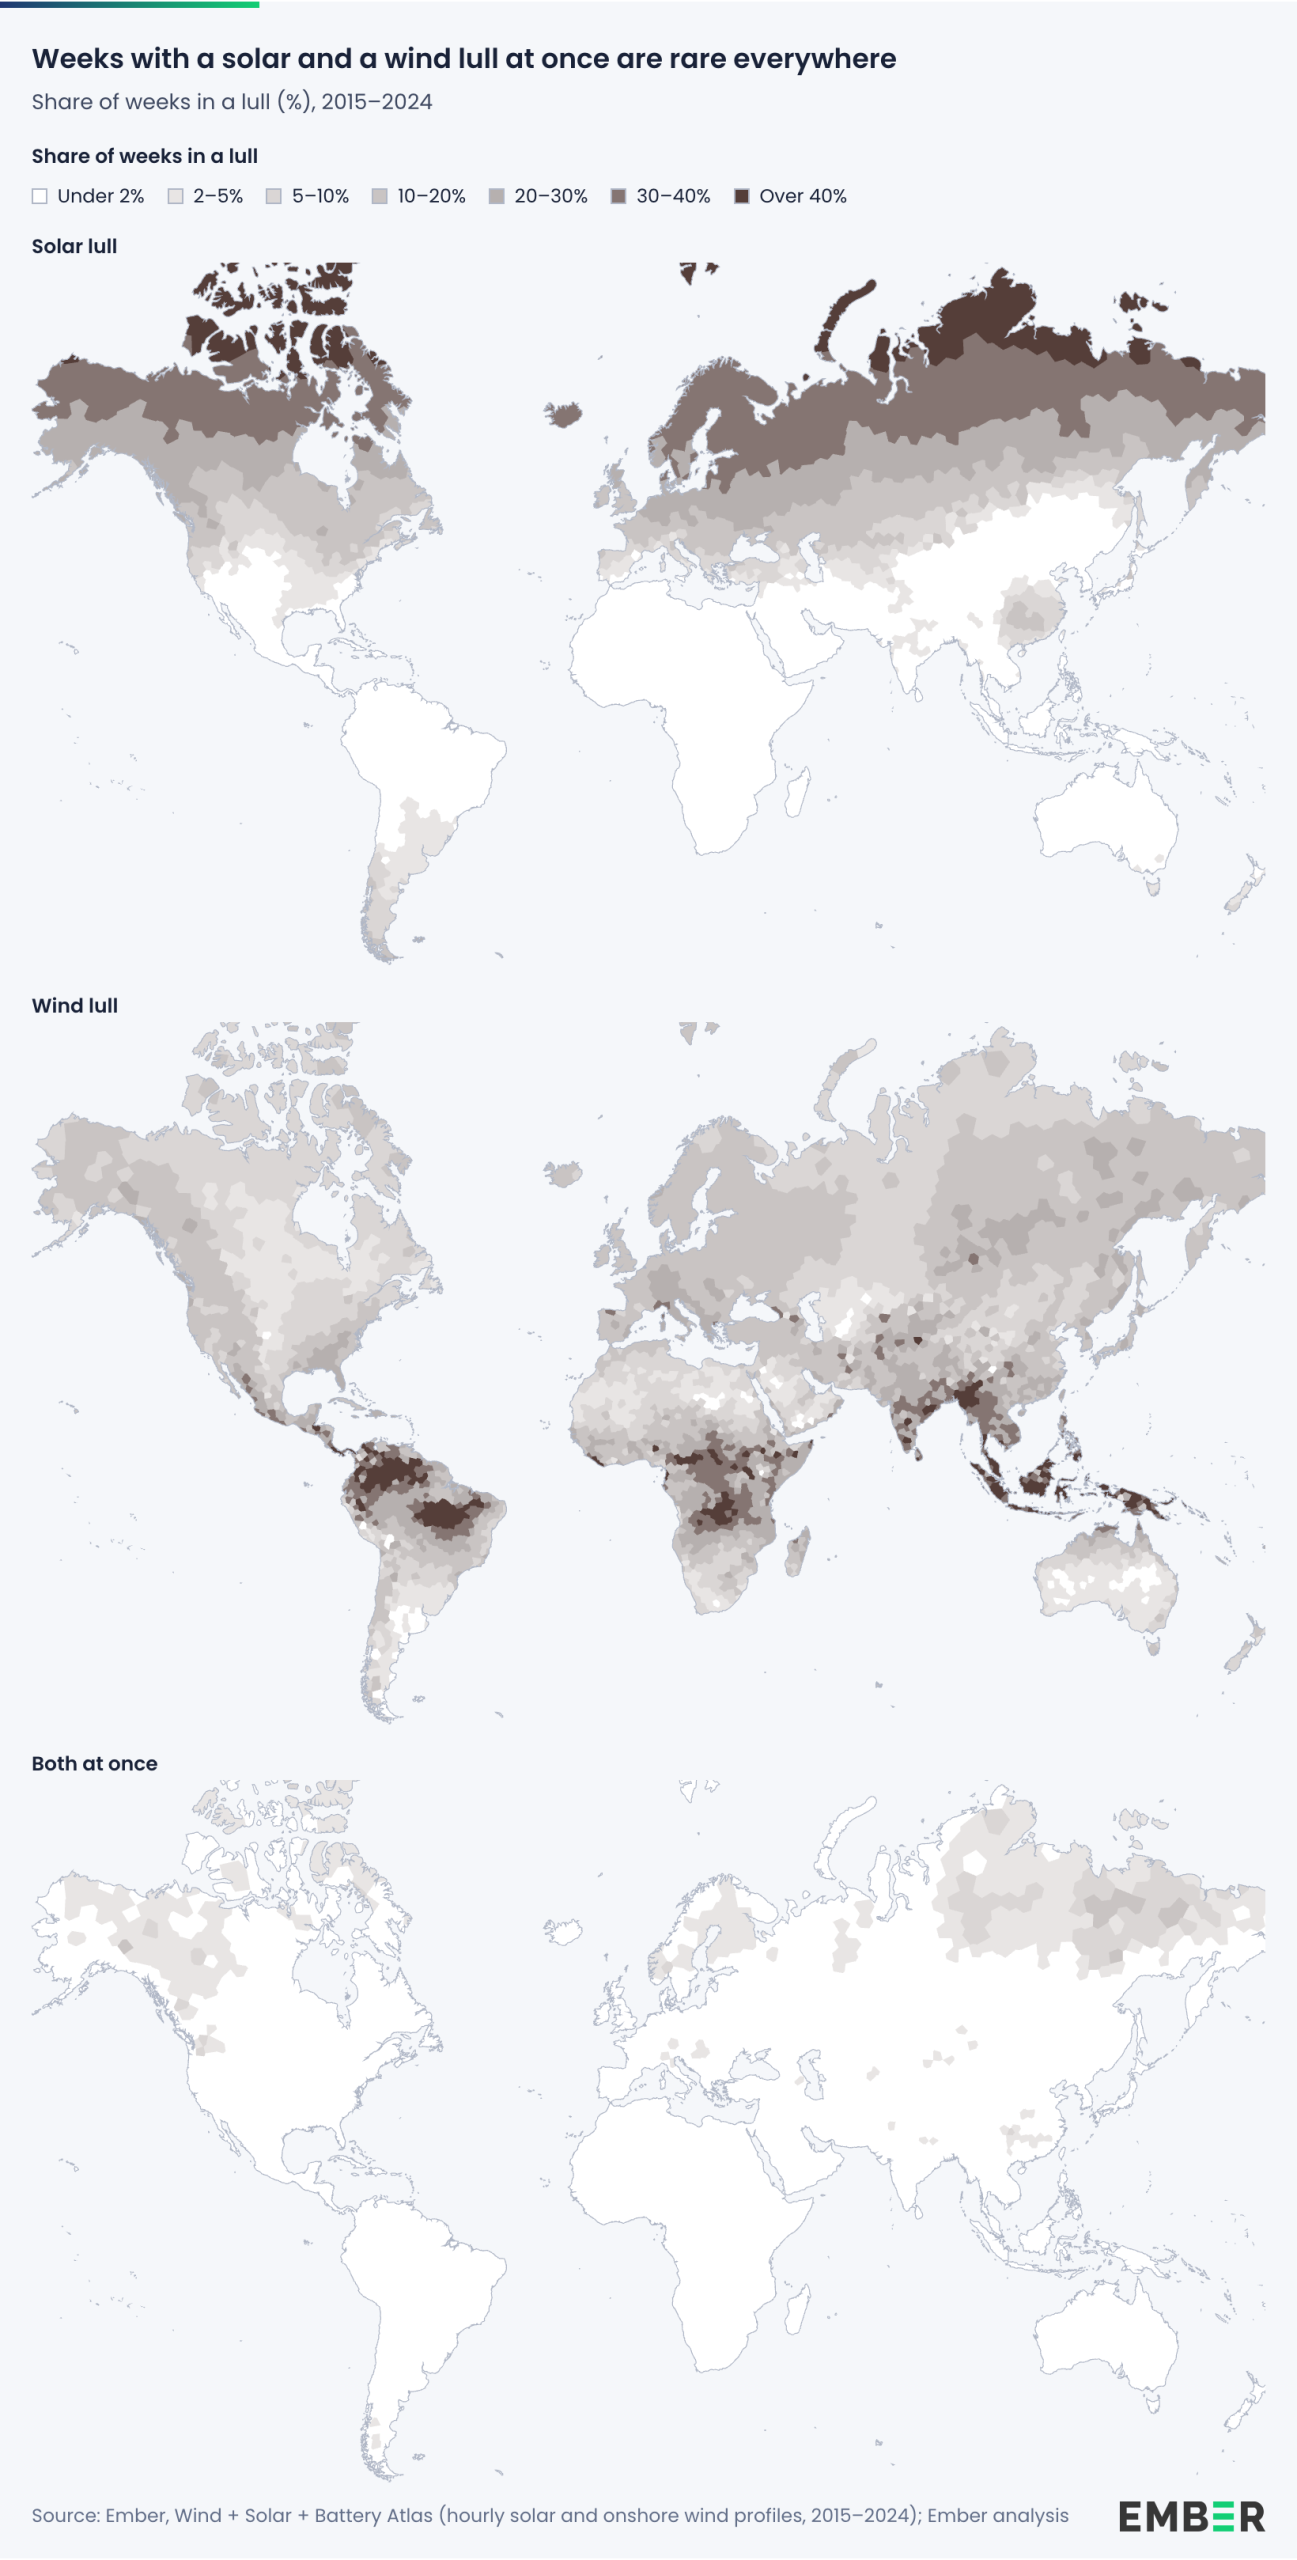
Even where adding wind does not make a solar and battery system cheaper, it makes supply more secure. The standing fear about the reliability of renewables is the still, grey weeks when neither the sun nor the wind delivers. They do happen. But a system with two harvests is diversified, and the two rarely fail together.

Based on historical weather data, weighted by where electricity is used, solar had a lull week – output below half its average for seven consecutive days – roughly four times a year. Wind had one roughly eight times a year. Both at once: about once every four years.

The seasons explain most of it. Almost all of Europe’s solar lulls fall between November and February; only one in eight of its wind lulls does. North America is starker still: 94% of its solar lulls fall in those months, against one in twenty of its wind lulls.

Wind also shrinks the worst week. Germany’s worst dark, still week of the decade leaves a gap of about five days of average demand with both sources, against six with either alone.

The gain holds near the equator too, where wind saves less money. There a week-long solar lull is already rare – about once every 11 years – and adding wind makes it rarer still.

4. Wind means less backup is needed

Even two harvests fall short sometimes, and something has to cover the gap. Today that is usually a gas turbine or diesel generator that runs only when renewables and batteries cannot. The less it runs, the less fuel it burns and the less the system depends on it.

Wind shrinks that gap for the same money. A solar and battery system that meets 90% of demand costs a median $105/MWh. For less – $98 – a system with wind meets 95% of demand, leaving the backup roughly half as much to cover. The pattern holds further up: with wind, covering 99% of demand costs about what solar and batteries pay to cover 95%.

Backup remains the cheapest way to cover the final hours. A generator that sits idle most of the year costs far less than batteries sized for the rarest gaps. Much of that backup already exists: today’s gas turbines and diesel generators can cover the final hours, without new plants built as a bridge (see section 5).

Wind also changes how much backup a system needs. For about $104/MWh, solar and batteries alone can supply 80% of demand, leaving a fifth to gas or diesel generators. Add wind, and the same money supplies 95%, leaving just a twentieth. At our 90% benchmark, firm solar and wind power costs an average $93/MWh with wind and $140 without (weighted by demand; the median with wind is $89).

So wind brings two benefits: for the same uptime it lowers the bill, and for the same bill it cuts how much the backup has to run.

5. With wind, most planned coal and gas already has a cheaper alternative

The world has 845 GW of coal and gas plants in planning. Most of it sits where firm renewables are already the cheaper option. On the 80% uptime bar used in ‘Harnessing the Sun’, solar and batteries alone offer an alternative under $100/MWh to 85% of the pipeline with wind, 96%.

The higher the bar, the more wind matters. At 90% uptime, it raises the share from 71% to 90%; in China alone, it gives another 91 GW a cheaper alternative. For firm solar and wind power, with backup, five-sixths of the pipeline (706 GW) sits where firm renewables cost under $100/MWh – against under two-thirds (520 GW) without wind.

These are alternatives for meeting the same demand in the model, not like-for-like replacements of each plant’s grid services. But for anyone financing a coal or gas plant meant to run for decades, the comparison is the one that matters: in most places, it already has a cheaper alternative that can deliver firm power.

And the gap is widening. The disruption in the Strait of Hormuz has pushed gas and coal prices sharply higher, and they are likely to stay there for a while: the cost of power from new coal and gas plants is heading above $100/MWh, and in many importing countries well above it. Solar, wind and batteries are moving the other way, getting cheaper as more are built.

6. There is plenty of wind almost everywhere

Two objections remain. The first: is there enough wind? There is. On conservative assumptions, global wind potential is at least 19 times the world’s electricity demand. And it is not confined to a few windy coasts.

Regions that use 93% of the world’s electricity have at least 1 GW of wind they could build on their own land and coast; regions with 82% have at least 10 GW. Most of the people in regions with less live where solar and batteries alone are already the cheapest route to firm renewables.

We will not run out of wind.

7. Cheaper solar will not price wind out

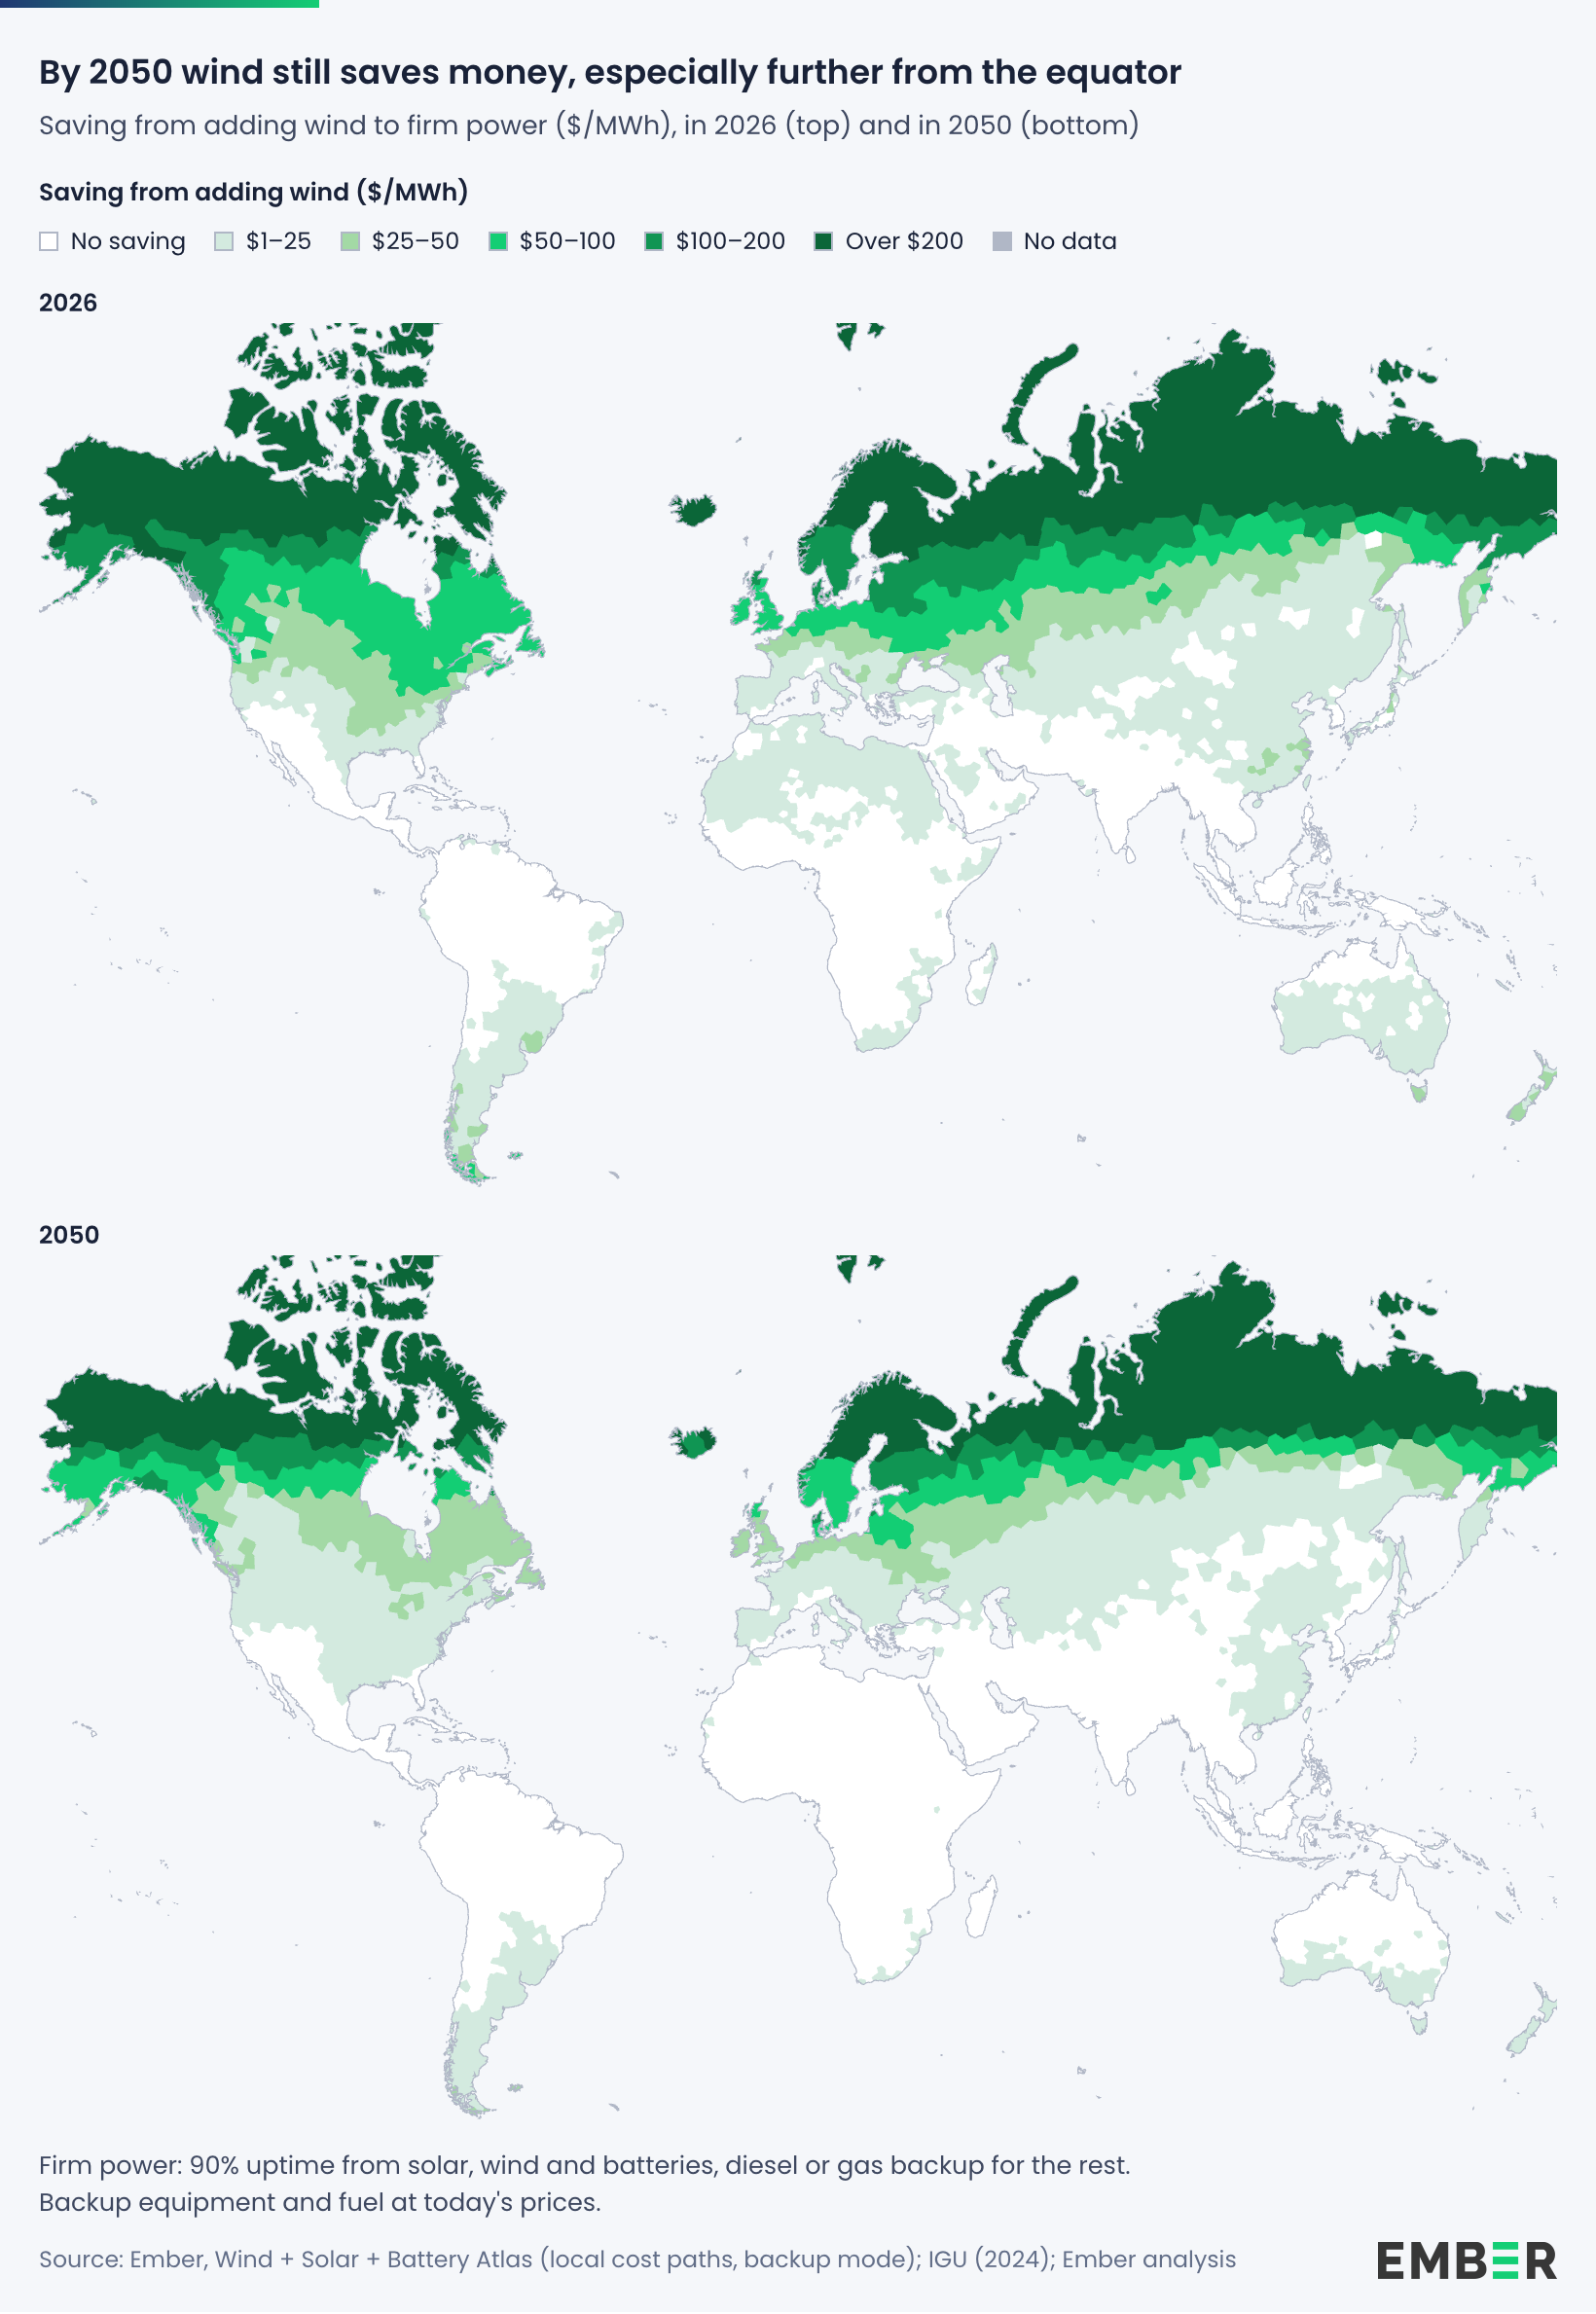
The second objection: solar and batteries keep getting cheaper, so will wind still be worth adding? It will. Wind is on its own learning curve: onshore wind’s installed cost has fallen 25% with each doubling of capacity. On the atlas’s local cost paths, the cost of firm solar and wind power falls from $89 to $52/MWh by 2050.

In 2050, adding wind still lowers the cost of firm solar and wind power for regions using two-thirds of the world’s electricity. North of 45°N, it still saves a median $24/MWh. Cheaper batteries make each hour of storage cheaper. Wind reduces how many hours are needed, and that advantage does not disappear.

A system built on harvests

For two centuries we have gathered energy that nature had already stored – coal seams, oil fields, gas reservoirs. The fuel came with its own storage, so supply could follow demand. It also came with a price set in someone else’s market, as the Hormuz crisis has shown again.

Solar and wind make us farmers. They produce in place, and their yield rises and falls with the weather and the seasons. The harvest has to be stored, or demand moved to meet it. That changes the design question: not which single source can run all the time, but which combination leaves the smallest gaps.

Solar supplies the cheapest power when the sun shines. Batteries carry it into the night. Wind produces in the weather and seasons when solar does not. A little backup from existing gas and diesel plants covers the rare weeks when all three come up short – and longer-duration storage, flexible demand and existing hydro will shrink that role further.

That last stretch is not today’s problem. Wind and solar supplied 17% of the world’s electricity in 2025. Today’s technology, at today’s costs, can take that to 80% and beyond, and in much of the world to 90% or 95%. The task now is to build – and to build as farmers do. And the first lesson of farming is the oldest: never rely on a single crop.

Supporting materials

Downloads

Download the full analysis.

Download (pdf)

Methodology

  1. Costs. Every figure comes from the atlas’s model at 2026 costs, with each region’s local equipment costs and one cost of capital everywhere, 7%, a real rate: costs are in constant 2026 dollars and no inflation is applied. Only the finance box in point 1 uses each region’s own rate, from Hatton et al. (2025). Solar and wind plants are taken as lasting 30 years and batteries 20. Shares and medians are weighted by electricity demand (Chen et al. 2022) unless the text says people (GPW v4). Section 7 follows the atlas’s cost paths to 2050, with backup equipment and fuel held at today’s prices.
  2. Uptime is the share of a year’s demand that a build meets, hour by hour, against a flat baseload – the same load every hour – averaged over ten weather years (2015–2024). It is not the share of hours. With backup, the cheaper of a gas turbine or a diesel generator covers the remaining hours; costs are per MWh of the full load.
  3. Wind. Each region has one simulated wind site on the windiest fifth of its eligible land or sea, outside protected areas and settlements. Its output is scaled to the capacity factors IRENA observed for new wind farms (×0.879 onshore in Europe, ×0.777 offshore), standing in for losses such as wakes that the model does not represent. The Global Wind Atlas it rests on has known regional biases, documented by Gruber et al. (2022) and Peña-Sánchez et al. (2026).
  4. Lulls. A lull week is a run of seven days in which a source’s output falls below half its average over the ten weather years. Frequencies are global and demand-weighted; the interval in any one place differs.
  5. Wind potential is a range. The conservative case uses 3 MW per km², new-build capacity factors and a 20% cut-off on the scaled capacity factor, with offshore on the World Bank/ESMAP definition. The technical case uses 5 MW per km² and the IEA’s offshore definition.
  6. Planned coal and gas is Global Energy Monitor’s announced capacity, counted where a region’s cheapest build reaches the stated uptime for $100/MWh or less (or, for the last tier, $130/MWh or less). An alternative means meeting the same demand in the model, not replicating each plant’s grid services.

The full method, data and caveats are in the atlas’s How it works panel.

Acknowledgements

We thank Ben Backwell, Joyce Lee, Janice Cheong and Feng Zhao of the Global Wind Energy Council for data, technical input and review. We also thank Chelsea Bruce-Lockhart (data visualisation), Carla Brown (Ember Labs) and Rini Sucahyo, Claire Kaelin and Hannah Broadbent (communications).


Disclosure of AI use

The analysis and logic were designed by Ember analysts; AI was used to pull, clean, and process the data according to this plan, with Ember analysts reviewing it. The web design of the atlas was designed by Ember analysts and created with AI front-end coding.

As per Ember’s AI use policy, responsibility for the quality and accuracy of the output lies with the author.

Ember Labs

Wind + Solar + Battery Atlas

An Ember AI experiment

Use the tool
Share