Chapter 3:
How China’s transition is reshaping the global energy landscape
In this chapter
The scale and pace of China’s clean energy transition, in both renewable generation and end-use electrification, has major implications for other countries. These include providing an example of how a huge and still-growing industrial economy can be transformed to run on clean energy, and producing a growing supply of ever-cheaper clean energy goods for the global market.
Given the sheer scale of China’s energy system, its transition is bound to have global spillover effects, redefining the context in which every other country must chart its path to future prosperity. This chapter explores three key implications. First, China expands the possible through vast manufacturing scale, innovation and rapid deployment. Second, it has converted the emerging market energy leapfrog from concept into reality. Third, by scaling electro-technologies at unprecedented speed, China is creating the conditions to bring forward the global peak, plateau and decline of fossil fuel demand.
3.1
Expands the possible, by making electro-technologies cheap and big
China expands what’s possible around the world in three key ways: manufacturing electro-technologies at enormous scale, driving down costs and expanding the technological frontier. No country has built manufactured technologies – of all kinds – at the scale China does today. Over the past 15 years, China has applied its manufacturing prowess to the core energy technologies of solar, wind, batteries, EVs and heat pumps. Together, these are technologies able to replace over three quarters of today’s global fossil fuel demand.
China’s electro-technology manufacturing capacity is now large, efficient and sophisticated enough to deliver the bulk of the goods needed for the global energy transition at prices affordable in most markets.
Since 2010, the costs of solar PV, wind and batteries have fallen by between 60% and 90%, increasingly matching or beating fossil-fired competition. In 2024, 91% of new wind and solar projects commissioned were cheaper than the cheapest available fossil fuel alternative. The latest solar and battery prices make the combination competitive with fossil fuels in most sunny regions. In Viet Nam and India, the upfront costs of building a solar farm and a coal-fired power station are now comparable on a per-MWh basis, while only the coal-fired power station incurs ongoing fuel costs.
In electric vehicles, the long-standing rule of thumb has been that battery packs at $100/kWh achieve sticker price parity with Internal Combustion Engine (ICE) vehicles. By July 2025, Chinese battery pack prices had plummeted to around $60/kWh. For consumers this means cheaper cars: each $10 per kWh decline in pack prices shaves about $500 off average-sized car production costs. In 2024, two-thirds of electric cars sold in China were cheaper than their ICE equivalents.
The core dynamics behind these global cost declines are learning-by-doing and increasing economies of scale, effects formally captured by Wright’s Law, which states that costs fall as a function of cumulative production. From 2010 onwards, Chinese factories have accounted for about three-quarters of global solar module production. Once expensive, these technologies are now cost-competitive – and this is largely driven by China’s rapid increase in production volume.
The scale of manufacturing in China means that it has grown to dominate electro-technology supply chains. In 2024, China produced four in five solar modules and battery cells globally, more than two-thirds of electric vehicles, and refined on average seven out of ten of the critical minerals that underpin them. That same year, Chinese companies also produced over half of the world’s heat pumps, with a significant share destined for the export market.
But scale matters more than share. The International Energy Agency’s Net Zero Roadmap, one of the most widely-used pathways to limiting global warming to 1.5C, requires 761 GW of solar capacity to be added globally per year in 2030. Already today, Chinese factories alone can theoretically supply that, and China’s projected solar manufacturing capacity in 2030 (1,255 GW per year) is 65% higher than the IEA Roadmap deployment figure. Batteries tell a similar story: in 2024, Chinese battery manufacturing capacity was about 2,500 GWh, over double last year’s global demand. By 2030, China is gearing up for 6,300 GWh per year of battery manufacturing capacity.
The result is a buyer’s market: as hardware prices keep plunging, the consumer case for clean power and electric transport just keeps strengthening. The rapid scale‑up has also created cyclical overcapacity, compressing margins for manufacturers and increasing consolidation risk. But, from a purely technology perspective, Chinese industrialists have made climate scenarios look attainable.
Importantly, analysts and policymakers worldwide who rely on cost figures even a couple of years old risk designing highly suboptimal technology pathways. Studies show that the costs of renewables are often overestimated in academic research. As academic conclusions frequently inform government modelling, there is a risk that governments may also overestimate energy transition costs by relying on outdated figures for technologies such as wind and solar power, battery storage, EVs and heat pumps.
If ‘made in China’ captured the country’s role in the 2010s, ‘invented in China’ increasingly captures its role today. China has become the energy transition’s science laboratory as well as its factory. China’s share of patent applications globally in clean energy technologies has risen from around 5% in 2000 to around 75% in 2022 – including 90% in solar and wind, 85% in energy storage, and more than 70% in batteries and electromobility, based on IRENA’s patent database.
Equally striking is China’s corporate Research and Development (R&D) spending in the energy sector, which has sailed past the US and Europe. In 2023, Chinese corporations invested ten times more in R&D in the electricity sector than their US counterparts. In concrete terms, this innovation acceleration has led to family-sized electric vehicles that charge in ten minutes for 400 km of range; batteries light enough to power heavy trucks and short-haul aircraft; offshore wind turbines as tall as the Eiffel Tower rated at 22 MW each; ultra-high voltage lines carrying 12 GW of desert solar power 3,300 km to coastal cities; and solar panels achieving 24% efficiency. In each case, it is a Chinese firm that is raising the ceiling of the possible; and the impact of raising the ceiling is global.
3.2
Enables the emerging market leapfrog
China is turning the ‘emerging market energy leapfrog’ from concept to reality. Its scale in the manufacture and export of affordable clean technologies, along deployment know-how, has contributed to faster adoption in many emerging markets. For comparison, in 2023, about one‑quarter of emerging markets in Africa, Asia and Latin America had higher economy‑wide electrification than the United States, and roughly 63% had a higher solar share in power generation. (See Methodology for definition of ‘emerging markets’.)
Countries exceeding the United States in solar and wind generation shares span Africa, Asia and Latin America, including Brazil, Chile, El Salvador, Kenya, Morocco and Namibia. While emerging markets’ overall share of solar and wind generation remains below that of mature economies, it is growing faster.
The shift has perhaps been accelerated by measures that some governments have taken in an attempt to shield their own clean tech manufacturing sector from what they regard as China’s uncompetitive practices. These include US bans and tariffs on imports of solar panels and components from China, extending recently to third countries. If sustained and broadened, such measures could fragment supply chains and slow deployment timelines in some markets. On the other hand, they may increase availability for others as restrictions on imports by one country can create more of a buyer’s market for others.
Meanwhile, electrification leaders range from Mexico and Chile to Egypt, Bangladesh, and Viet Nam, with rapid progress particularly evident in Asia, where Chinese technologies are more accessible. Just as electricity networks once spread outward from pioneers like New York and Berlin, electricity-first industrialisation is now radiating from eastern China to Southeast Asia. Countries where electricity’s share of final energy is rising quickly include Viet Nam, Laos, Malaysia and Bangladesh.
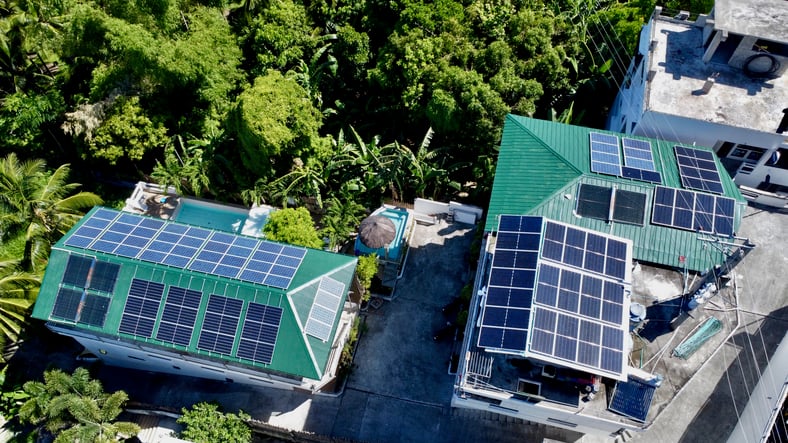
China’s solar exports tripled in five years, reaching 242 GW in 2024, with around half going to emerging markets. In many countries, this is already adding materially to their capacity to generate electricity. Since 2018, Chinese solar exports to Namibia, Senegal, Cambodia, Afghanistan and Pakistan have all been larger than their entire centralised capacity as of 2023. Imports to Kenya, Yemen, Sri Lanka and Tanzania have been more than half the size of their centralised electricity systems. Brazil has imported about 90 GW of solar capacity from China (in an electricity system with a total generation capacity of 274 GW, as of July 2025). In other words, new energy is achieving in years what took old energy decades.
Rapid module price declines have improved the affordability of solar. Solar module prices fell over 70% between 2022 and mid-2025, down to $0.08/W for spot purchases in China. In some places, this is materially changing people’s prospects of gaining access to modern energy. At these prices, it would take a $20 module cost for the average person in Sub-Saharan Africa to double their electricity consumption. In illustrative terms, multiply the module cost fivefold to cover inverters, wiring, supplier margins and logistics costs, and the whole kit still comes in, on an upfront basis, below the price of a Tecno Pop 8 smartphone, a top seller in African markets. On a levelised cost of electricity basis, these prices make a small solar PV kit far cheaper than a stand-alone diesel generator. Using solar panels to double the total electricity consumption of the 1.25 billion population of Sub-Saharan Africa would cost about $25bn for modules at present spot prices – about the amount the region spends every year on fuel for stand-alone generators. The scale of China’s solar manufacturing is such that even using just one-seventh of projected ‘spare’ manufacturing capacity by 2030 could provide basic electricity access to everyone still without power across 88 low-income countries in Africa and other regions of the world.
Realising these gains depends on non‑module costs and delivery constraints (soft costs, taxes, logistics, storage for reliability, quality assurance and after‑sales service), as well as financing and policy. In many contexts, utility‑scale and distributed solar can be deployed faster than new fossil gas capacity, and it reduces exposure to imported fuel price volatility and local air pollution.
Where solar goes, batteries are following. In 2024, China exported $61 billion USD worth of batteries, with a quarter of this going to emerging markets, where they both help to integrate higher levels of variable solar generation into the electricity system and build domestic automotive industries. One of the most significant trends in the auto trade is that over the past decade, China has evolved from being a net car importer into the world’s largest exporter.
A growing share of these car exports consists of EVs, up from 7% in 2020 to 41% in the first five months of 2025. In 2024, emerging markets overtook the European Union as China’s largest EV destination. Exports to emerging markets surged from $0.5 billion in 2020 to $16.5 billion in 2024.
Price comparisons indicate that Chinese EVs are often priced below local ICE alternatives. In Thailand, the average market price of a Chinese battery electric vehicle (BEV) in 2024 was around $30,000 USD, versus a conventional internal combustion engine vehicle (ICEV) at approximately $34,000. In Mexico and Brazil, the BYD Dolphin Mini launched at around $20,000. With the BYD Seagull retailing in China at under $8,000, export pricing could be lower over time, subject to tariffs, taxes, logistics and local‑content rules.
In some cases Chinese companies are also committing capital and technical expertise to local production. Since 2020, Chinese EV and battery companies have announced around $80 billion to build production facilities in markets such as Indonesia, Thailand and Brazil.
China has also announced diplomatic and financing initiatives to support renewables deployment in Africa, including a three‑year plan launched in 2024 with pledges on solar rollout, project development and funds to localise supply chains. Amid concerns over African nations’ debt levels with respect to China – some linked to earlier energy-sector loans – there are signs that more sustainable financing approaches are being explored. These include a gradual shift in some cases toward investment-based models and concessional finance, along with stronger oversight mechanisms.
Some analysts view the combined emphasis on clean energy deployment and manufacturing, which China is pursuing domestically and in some cases supporting in other emerging economies, as a departure from the historic development pathway of “grow first, clean up later”, potentially aligning a country’s economic and environmental goals. The extent to which this materialises will vary by country policy, financing conditions and local capabilities.
3.3
China’s transition is reshaping the global fossil fuel demand outlook
China’s energy‑related fossil fuel demand appears to be approaching a plateau –with possible decline ahead – and this will be significant for the fossil fuel production industry the world over. In the past decade, China has been the single largest driver of global growth in fossil fuel use, responsible for about two-thirds of the global increase in primary demand; and in the power sector, accounting for almost 80% of the rise in fossil generation.
As we outlined in Chapter 1, the accelerating rollout of renewable generation is set to tip China’s power sector fossil fuel use into decline soon. Outside the power sector, in buildings, industry and transport, final energy-related fossil fuel use has broadly plateaued, with decline possible if current trends persist. Whether this materialises depends on economic growth, hydrology, export demand, policy execution and grid integration.
Fossil fuel use across the OECD has fallen since around 2009. If China’s demand also declines, countries representing more than half of global use would be in contraction.
Outside China, uptake of clean electro-technology – made more affordable largely by China’s manufacturing scale – is helping mature and emerging economies alike to accelerate their own transitions. In 2024, clean energy goods exported from China shaved the carbon emissions of importing countries by an estimated 1%, by implication cutting their fossil fuel demand by a similar amount.
If these trends continue, it’s likely that the world’s fossil fuel demand will be in structural decline by 2030.
Entering an era of falling fossil fuel demand will have profound implications for a number of countries. Governments planning to achieve economic growth by stimulating fossil fuel production face an immediate challenge, especially if investors respond logically to the global trend. While the fossil fuel sector contracts, electro-technology will continue to get cheaper as its use and manufacture expands, and as it achieves social acceptance worldwide.
Falling fossil fuel demand will also change the politics of climate change, keeping the goals of the Paris Agreement within play, and cementing alliances between governments that want to grasp the opportunity which cheap electro-technologies are delivering.

Related Content