Chapter 1:
Deeper integration
In this chapter
For much of the past decade, China’s massive renewable build-out acted mainly as an additional layer of supply, expanding alongside a fossil-fuel system that was still growing. That phase is now giving way to deeper integration, with clean electricity taking on a larger role in meeting power demand, balancing the electricity system and powering activity across the wider economy.
1.1
Generation: renewable build-out is changing the coal story
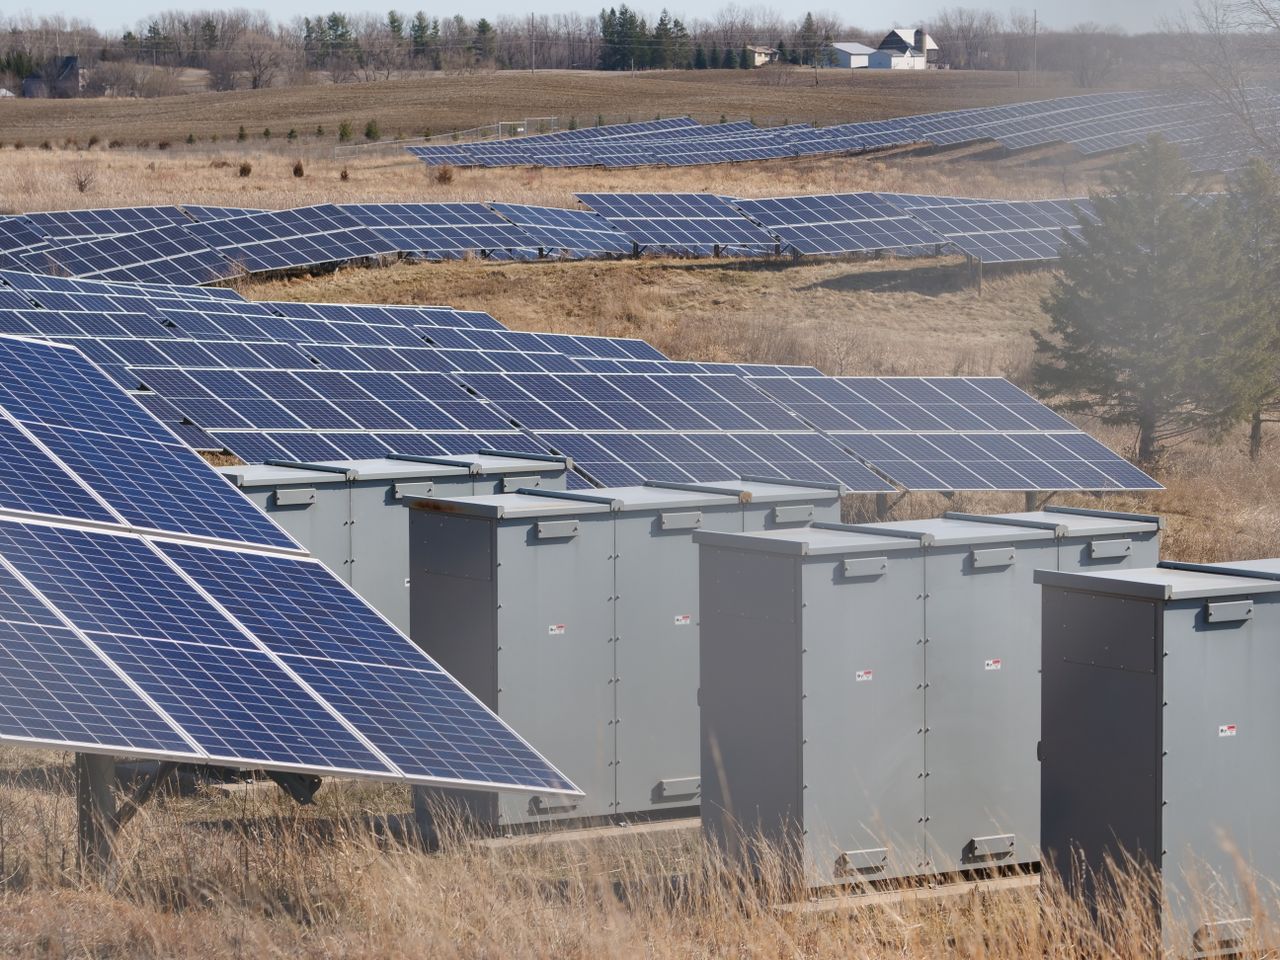
China has led the world in wind and solar additions for more than a decade. It already possessed the world’s largest power system by 2015, with around 1,450 GW of total generation capacity. In the decade since, it has added almost 1,700 GW wind and solar — more than its entire 2015 system. Yet this progress has unfolded alongside another reality: coal remains the backbone of China’s power fleet, and its capacity has kept growing through the renewable boom. This pattern of “more renewables, more coal” is now beginning to change.
A surge ahead of the 2025 pricing reform deadline, followed by an adjustment. Monthly wind and solar capacity additions fluctuate considerably over the course of the year, often culminating in year-end surges as developers complete projects ahead of annual targets and reporting deadlines. Viewed through a 12-month moving average, which smooths these short-term fluctuations, the change in the underlying trajectory becomes clear. The pace of expansion remained broadly stable through 2021 and 2022 before turning sharply upwards from 2023.
In February 2025, China released a landmark policy known as Document No. 136. It required renewable pricing to shift from guaranteed benchmark tariffs to market-based arrangements, with newly commissioned projects participating more fully in power market transactions. Projects completed before the 1 June 2025 deadline could remain under the previous pricing arrangements, and developers had a strong incentive to accelerate commissioning. This brought projects forward and concentrated a large share of annual additions in the first half of the year.
The sharp slowdown that followed was therefore partly a consequence of this front-loading. Some projects that would otherwise have been completed later had already entered operation. It also marked the beginning of a broader adjustment, as developers began adapting to the new pricing framework and the power system worked to accommodate a large wave of new variable capacity. These factors point to a period of adjustment rather than a reversal of the earlier expansion. The implications for future deployment are examined in Chapter 2.
Clean power growth pushed coal generation down for the first time in a decade. Led by strong wind and solar growth, clean electricity met all of China’s additional power demand in 2025, contributing to a 0.7% decline in thermal generation, most of which is coal power. This happened even as demand rose by 5%, driven primarily by rising electrification and industrial expansion. This marks a significant departure from 2015, the last time thermal generation fell. At that time, electricity demand was almost flat, growing by only 0.5%, the slowest rate since 1974.
The 2025 decline may prove more than a one-year anomaly. A single year of falling coal generation does not, on its own, prove a structural shift. Coal generation can fluctuate with weather, hydropower conditions, industrial demand and economic cycles. But measured by the 12-month moving average, which smooths these fluctuations, coal generation shows signs of stalling after years of continued expansion. This suggests the 2025 decline is not an isolated event, but a sign that coal’s long expansion is increasingly losing momentum.
1.2
System: Clean flexibility gains scale
Wind and solar increases the need for flexibility to manage daily, seasonal and weather-driven variations in output. While coal-fired power plants still provide much of this flexibility, the scale of clean balancing capacity is now growing fast enough to take on a real share of the job.
Battery storage has moved from niche to the mainstream in just a few years. Pumped hydro remains the long-established backbone of China’s large-scale clean balancing architecture, but battery storage has caught up fast. It overtook pumped hydro on installed capacity by the end of 2024 then grew a further 84% in 2025, nearly doubling in a single year. China is now the world’s largest battery-storage market, accounting for around 60% of global capacity additions in 2025.
Storage is also diversifying beyond lithium-ion batteries. Between 2023 and 2025, compressed-air energy storage (CAES) grew more than sixfold, flow batteries increased more than tenfold, and molten-salt thermal storage almost tripled, although from relatively low bases. These technologies are better suited to longer-duration storage, shifting energy across hours or even days to smooth out longer swings in supply and demand, while lithium-ion batteries are better at managing shorter, faster variations, often from second-to-second balancing up to a few hours. The growth starts from a low base, as the chart above shows. Nevertheless, the sharp rise since 2023 reflects a shift from demonstration towards commercial-scale deployment. China connected its first 100 MW advanced CAES project in 2022. By early 2026, it had scaled the technology to a 600 MW/2.4 GWh facility, the world’s largest CASE project. A large-scale molten-salt thermal storage project with an installed capacity of 1,000 MWh also went into operation in Anhui in 2025.
The storage fleet isn’t just getting bigger — it’s working harder. Capacity on its own says little. A battery fleet firms up renewable output only if it cycles, charging and discharging to move clean power from surplus to scarcity. On that measure, China’s storage is beginning to earn its place in the system. Average utilisation, measured in equivalent full cycles a year, roughly doubled between 2022 and 2025, across the fleet: standalone batteries rose from 146 to 299 equivalent full cycles a year, and renewable co-located batteries from 80 to 199. An equivalent full cycle is one complete charge and discharge of a battery’s full capacity, so the figure indicates how hard the fleet is being used over the year.
1.3
Economy: Electrification reaches more demanding uses
In 2025, China consumed about 10.4 trillion kWh of electricity, the first country in history to pass the 10-trillion mark, and more than double the total electricity consumed in the United States. But scale alone is not the story; a country of China’s size would be expected to lead on absolute consumption. What matters more is that the share of electricity in final energy use has risen steadily in China, reaching 28.8% in 2024, up from 22.3% in 2015 — a level now ahead of many major economies such as Europe (around 23%) and the United States (about 21%). Combined with the rapid expansion of renewable generation, this means clean electricity is reaching ever deeper into the real economy, including parts of it long considered difficult, if not impossible, to electrify.
Across much of the light, equipment-intensive manufacturing, electricity has already become the dominant energy source. These sectors account for around a tenth of manufacturing’ energy use, which is itself roughly half of China’s final energy consumption. By 2023, electricity supplied about three-quarters of final energy in electrical equipment and electronics, machinery, textiles and transport equipment, and more than 60% in rubber, plastic and chemical fibres. It is also approaching parity with fossil fuels in pharmaceuticals, food and beverages, and wood and furniture.
These manufacturing sectors rely heavily on motors, machinery, processing equipment, drying, and low- to medium-temperature heat, making many of their energy needs technically easier to electrify. Some of this shift would have happened anyway as industrial production became more automated and equipment-intensive. But the acceleration since 2015 suggests China’s wider energy transition is reinforcing the move towards electrified industrial production.
Harder-to-electrify sectors are starting to shift. Extractive industries, petrochemicals, metals smelting and processing, and non-metallic mineral products are highly energy-intensive, together accounting for roughly 40% of China’s total final energy consumption. Their electrification is often constrained by high-temperature heat requirements, the role of fossil fuels as feedstock in some processes, and long-lived and highly integrated equipment that is costly to replace mid-life. Even so, electricity’s share has begun to rise across these sectors. In metals smelting and processing it rose from just over 10% of final energy use in 2000 to 20% in 2023; in fossil-fuel extraction, from under 10% to 17%; and in non-metallic mineral products, from around 10% to 17% over the same period.
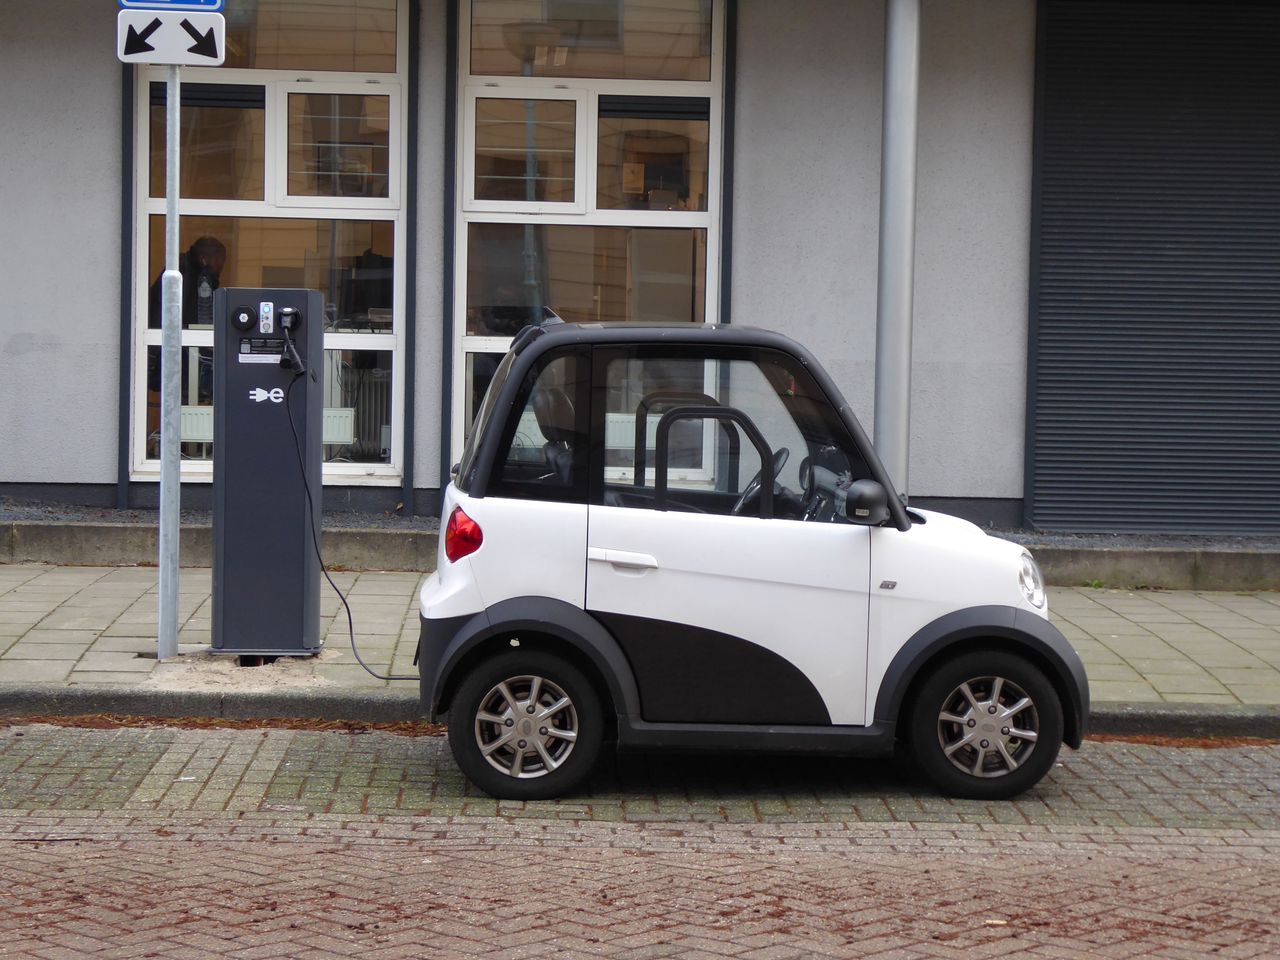
In transport, electrification is spreading past passenger cars. The share of passenger electric vehicles (EVs) (including battery electric vehicles and plug-in hybrids) in new sales began rising from around 2017 and accelerated sharply after 2020, from less than 10% to over 50% by 2025, supported by favourable policies, expanding charging infrastructure and increasingly competitive domestic models. Uptake has remained strong into 2026, with passenger EVs accounting for 67.2% of new sales in June.
Trucks are more difficult to electrify because of tighter requirements around payload, range, charging time, route reliability and operating cost. Even so, the shift has begun. Starting from a low base, China’s electric truck sales more than doubled in 2024, then more than doubled again in 2025, driven primarily by falling battery costs, supportive policies and the cost advantage of electricity over diesel.
By 2025, electric trucks in China had reached a sales share comparable to electric passenger cars in several European markets, and China accounted for nine out of every ten electric trucks sold globally. The rise has continued into 2026. In June, electric trucks reached almost 45% of new truck sales, higher than passenger EVs have achieved in most countries.
1.4
Emerging signs of fossil-fuel peaking
Deeper integration of clean electricity across power generation, system flexibility and the wider economy is putting more direct pressure on China’s legacy fossil-fuel system. At the national level, this shift can still look uneven or ambiguous. Headline indicators, such as continued fossil capacity growth or short-term emissions increases, can dominate the macro picture. But in a country as large and complex as China, major structural shifts often begin below the national aggregate, emerging across provinces and sectors.
In the power sector, coal generation has begun to stall. This report tracks 26 provincial-level regions with significant coal generation; in 17 of them, coal generation has plateaued or turned flat between 2021 and 2025, including established industrial centres such as Shandong and Hunan. Together, these regions account for more than half of the country’s total thermal capacity, most of which is coal-based.
In the wider economy, absolute fossil-fuel use has already fallen by between 26% to 71% from its peak, across eight industrial sectors, from fossil-fuel extraction to manufacturing industries such as textile, machinery, and food and beverages. Even in metals smelting and processing — among the most fossil-intensive parts of the economy — there are early signs that fossil-fuel use is beginning to flatten.
As fossil-fuel use begins to flatten or decline across parts of the power system and wider economy, China’s transition is approaching the more demanding phase of “building while breaking”. This marks significant progress, but it is also generating new and more complex challenges, raising a central question: can this momentum be sustained and extended — both into provinces and sectors where fossil-fuel use is still rising, and deeper into activities where clean electricity has already begun to constrain fossil-fuel growth?

Related Content