Energy Security in an insecure world | Ember

Energy Security in an Insecure World

New analysis shows that replacing fossil imports with three key levers—electric vehicles, heat pumps, and renewables—can cut net fossil fuel imports by 70%, saving importers $1.3 trillion globally each year.

22 Apr 2025
7 Minutes Read
Download slide deck PDF

Highlights

37%
Total primary energy demand met by imported fossil fuels
52
Countries importing over 50% of their primary energy from fossil fuels
-70%
Global fossil fuel import reduction if EVs, heat pumps and renewables replaced all imported fuels in transport, heating and power

Executive summary

Energy at Risk

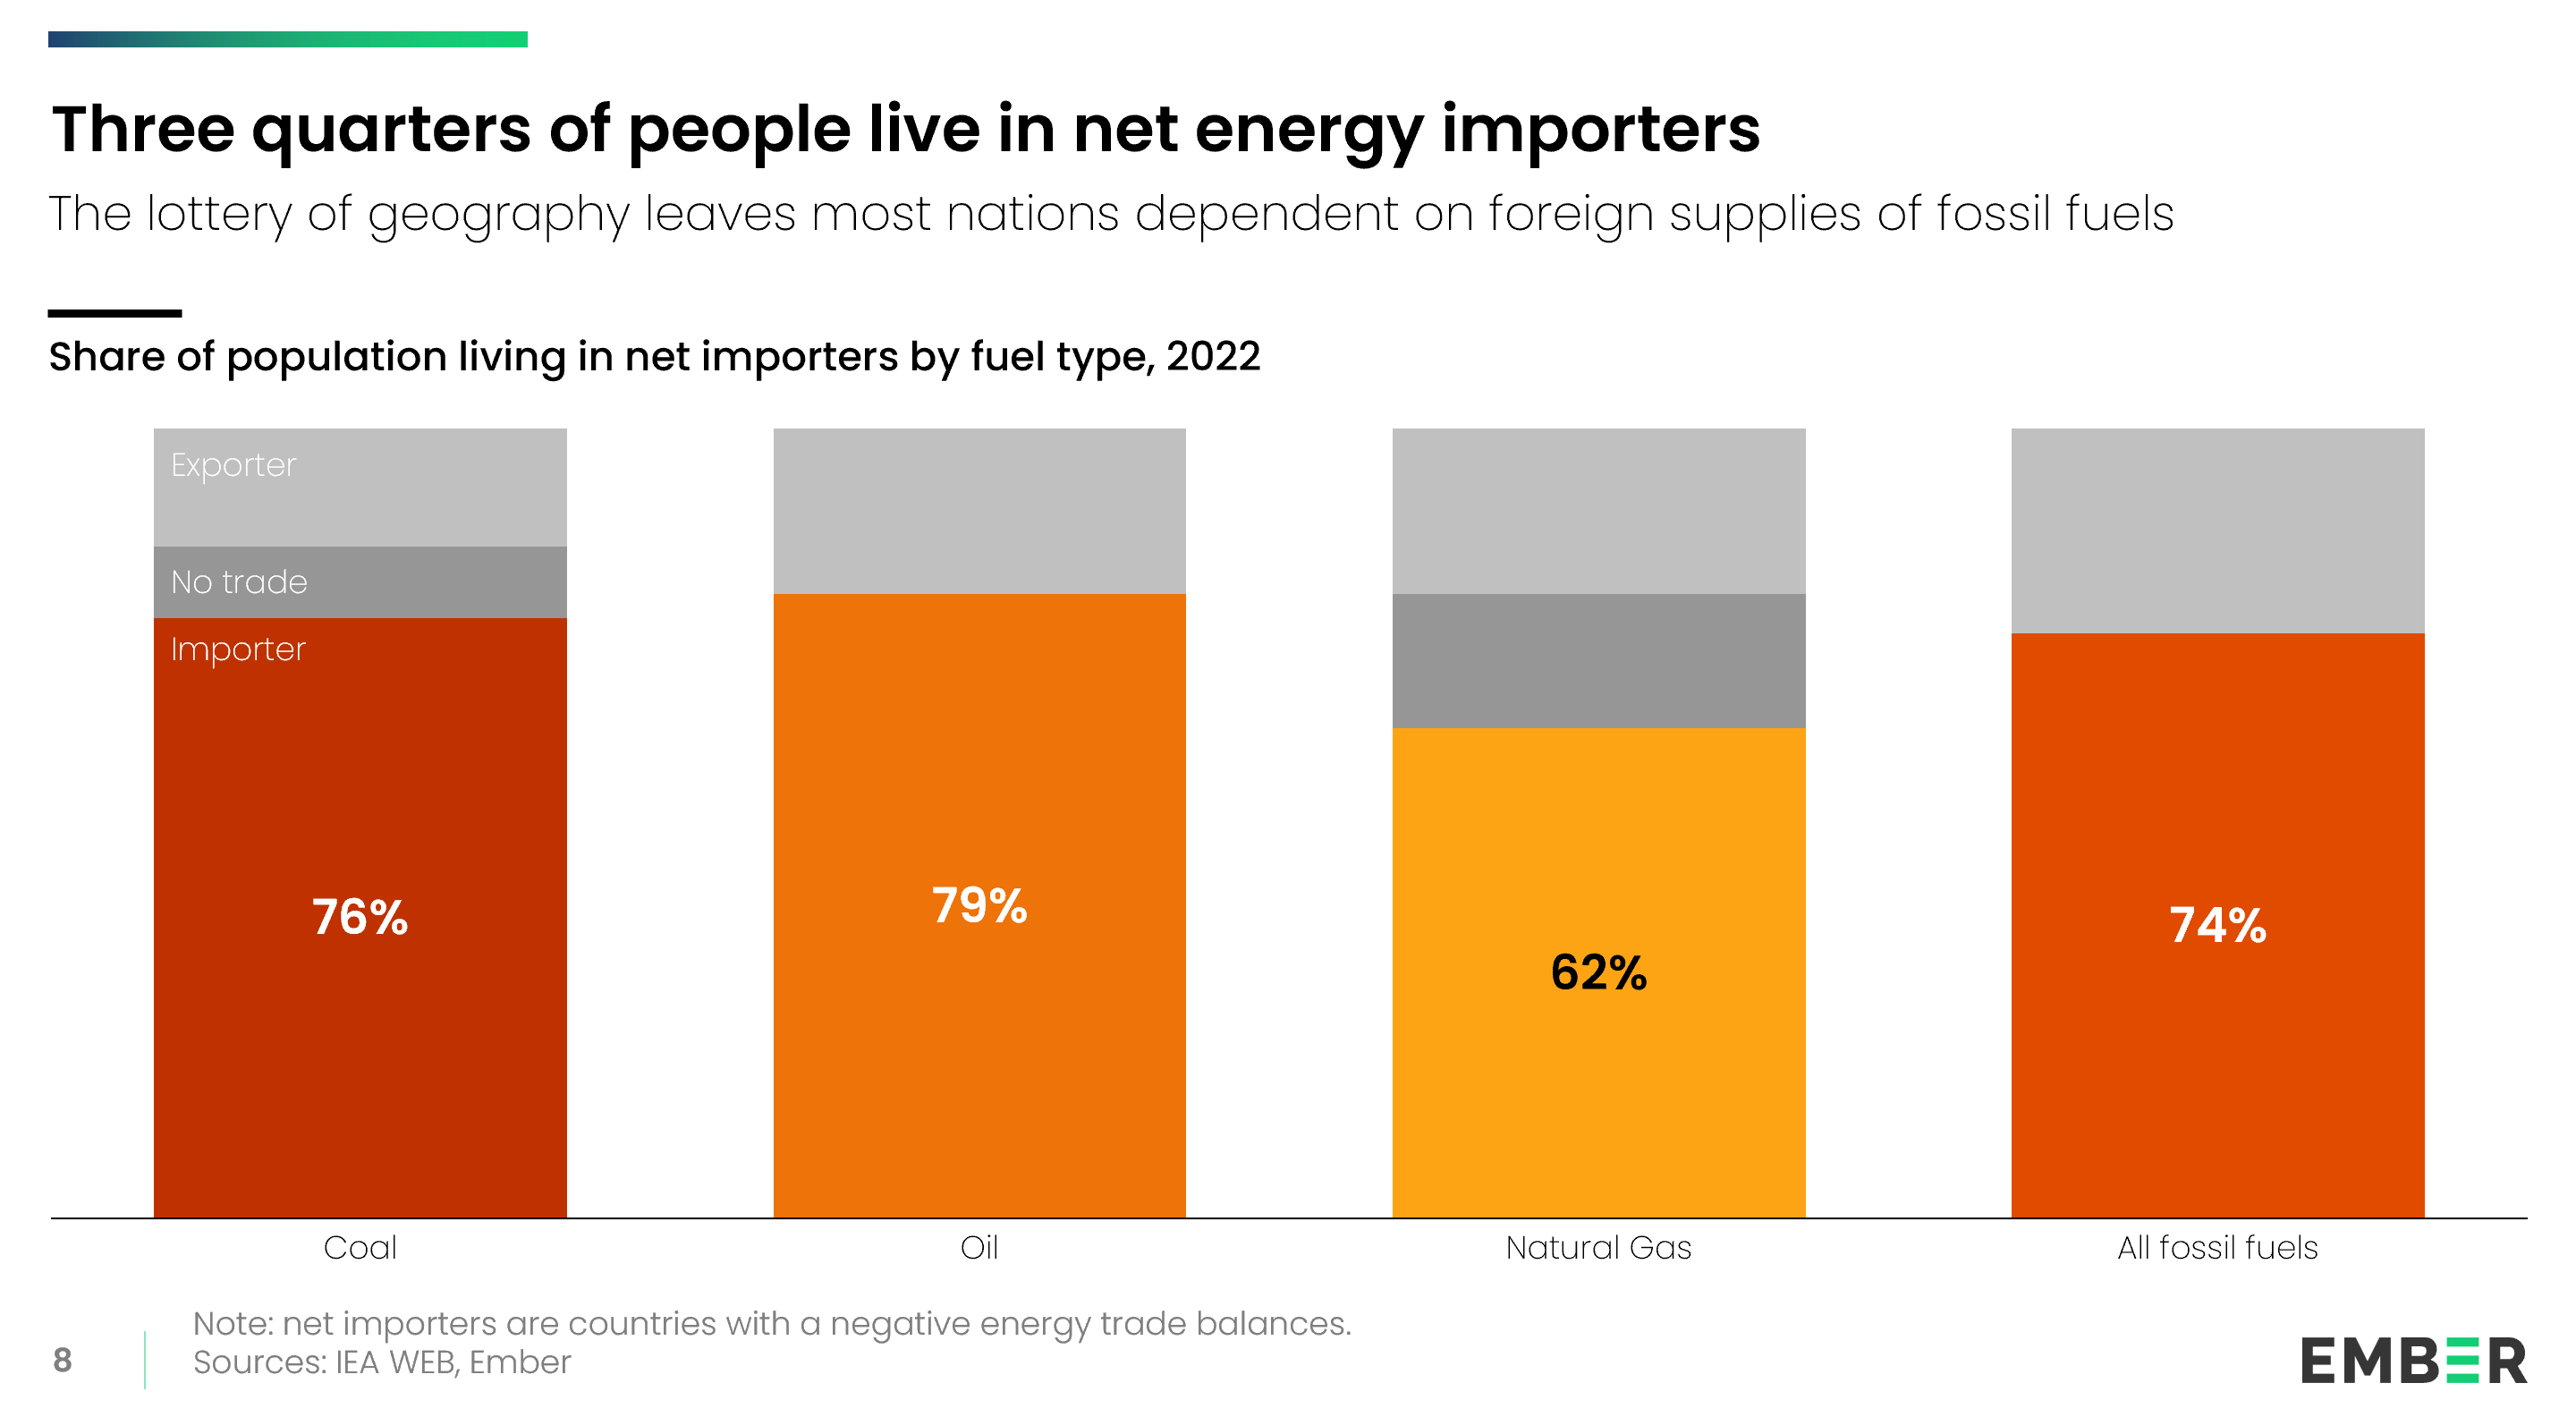
As the Pax Americana wanes, 74% of the world’s population living in fossil fuel-importing nations face rising energy security risks. Electrotech offers a new security strategy for an uncertain future.

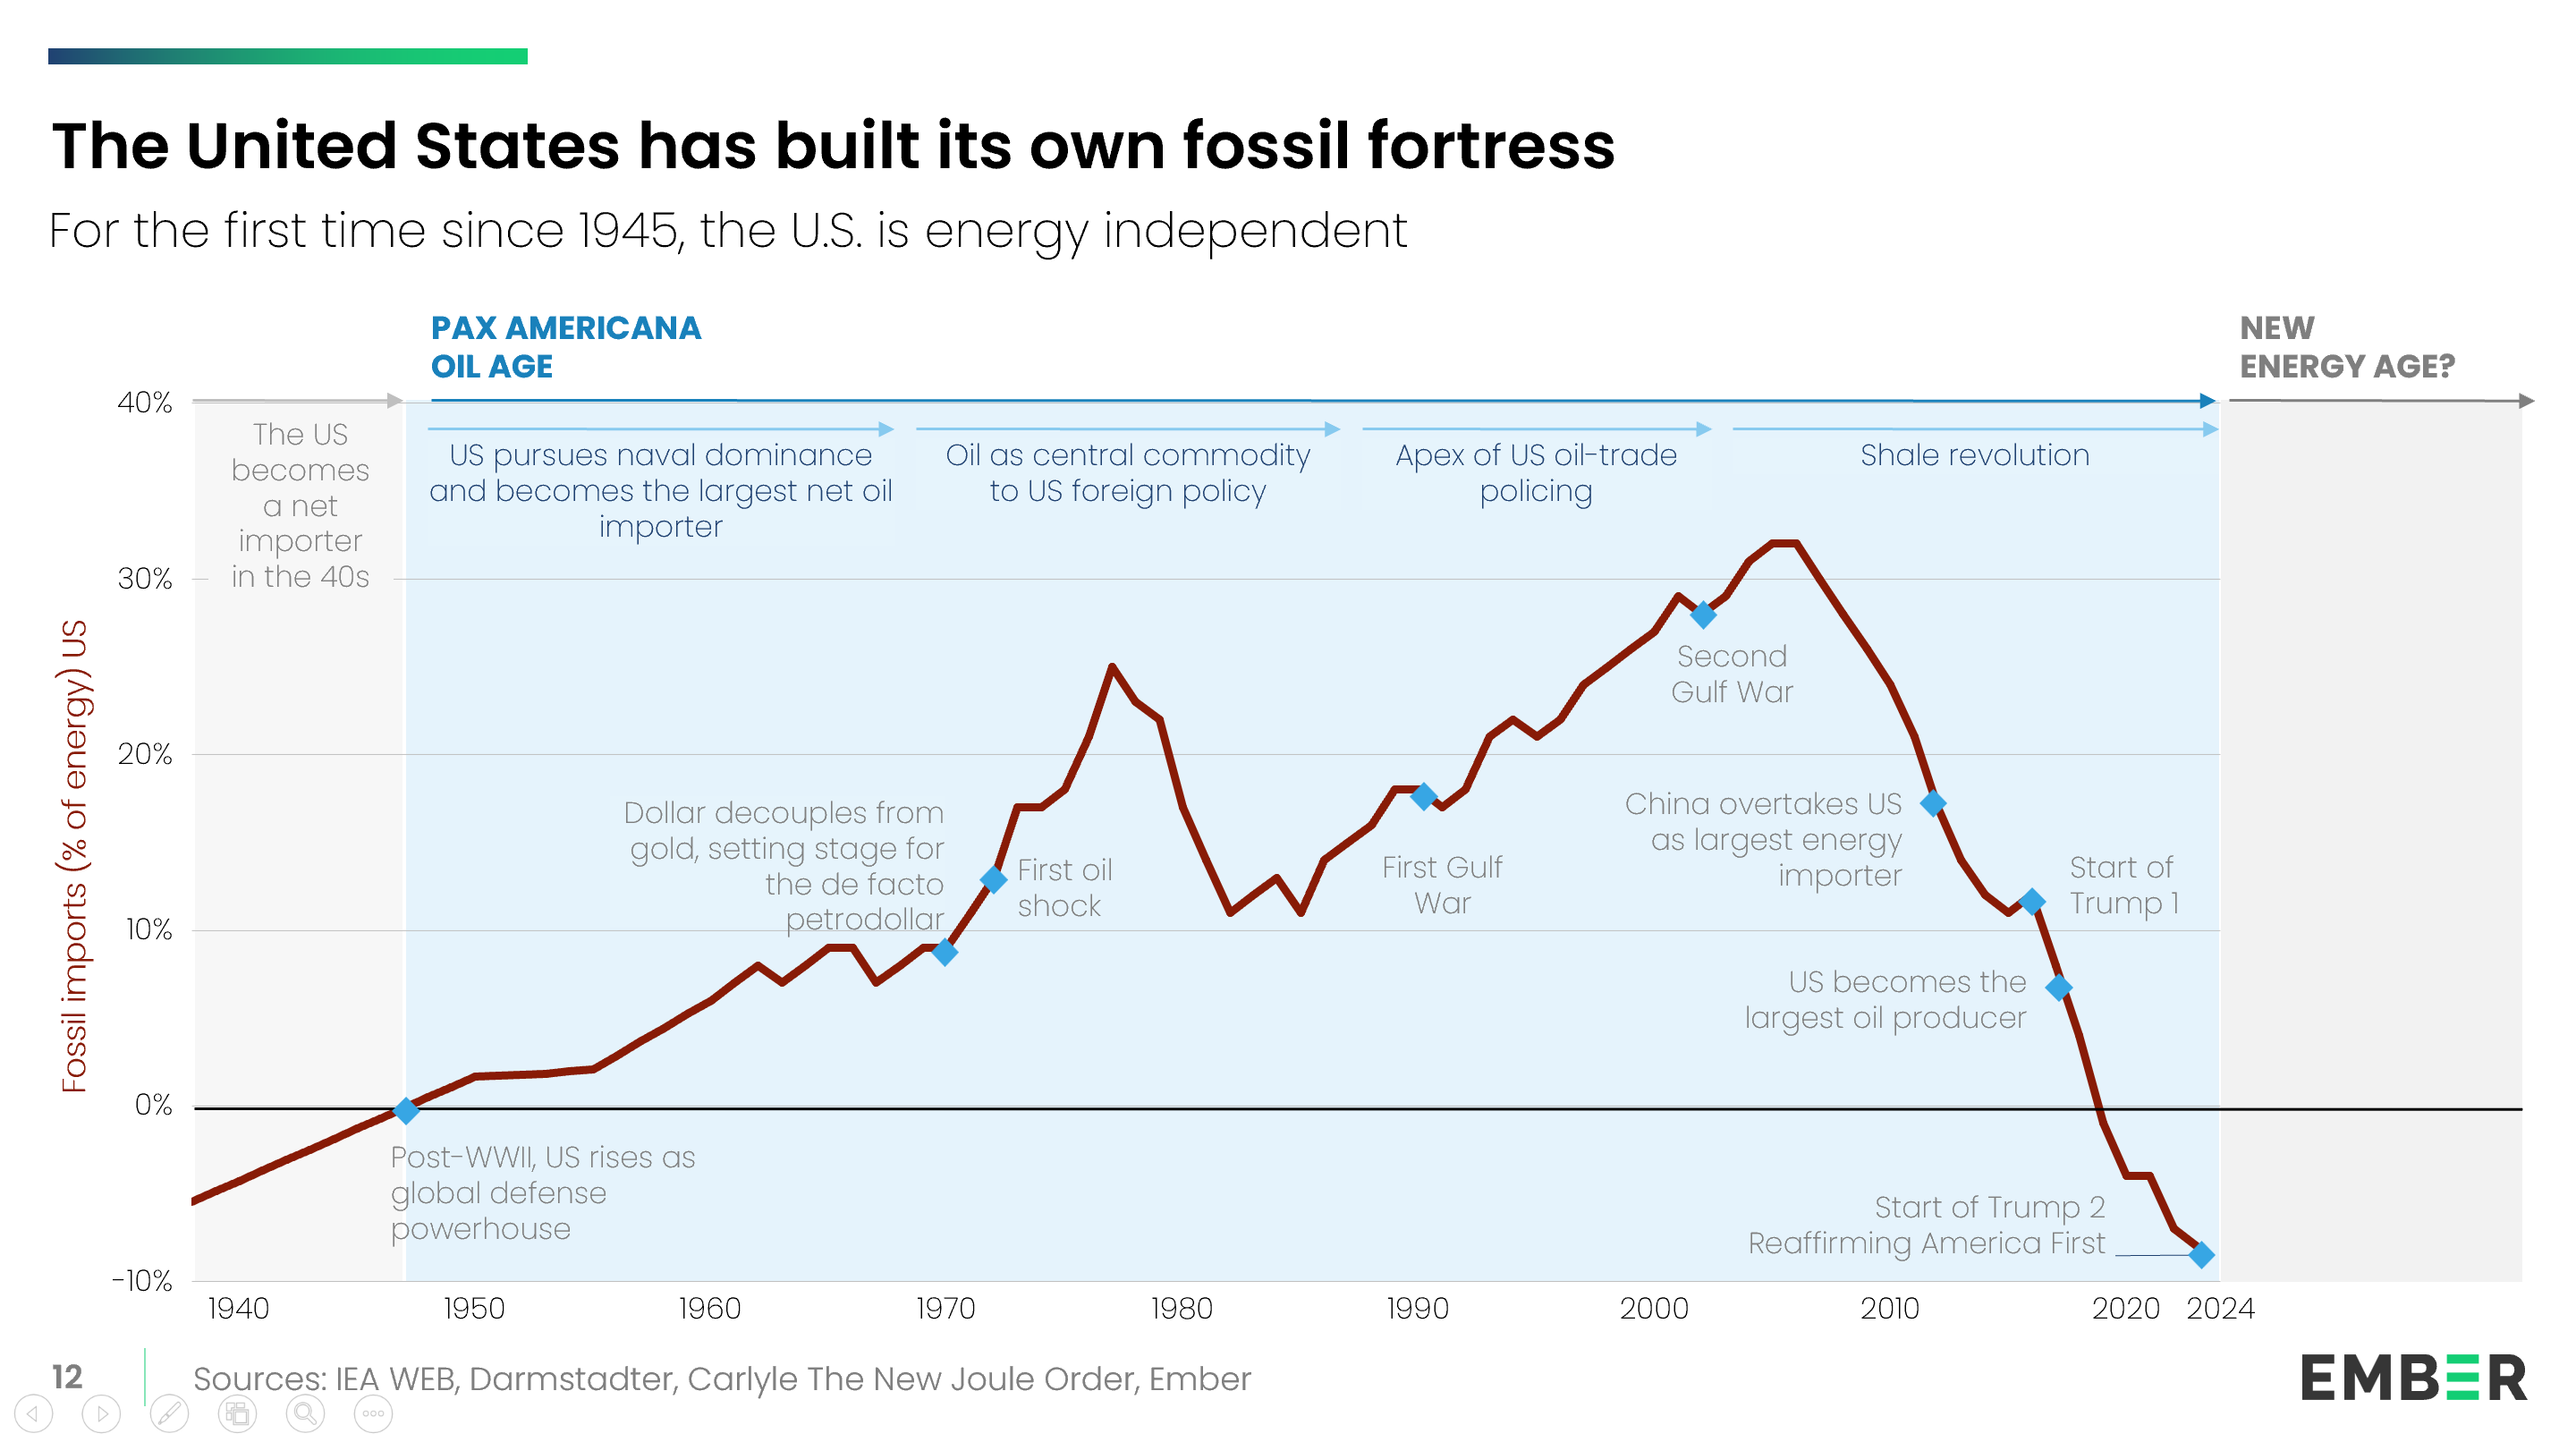
Since the end of World War II, under the Pax Americana, the United States dominated global geopolitics, and oil dominated energy markets. During this period of relative US-guaranteed stability, the world built a massive dependency on fossil fuel imports. 

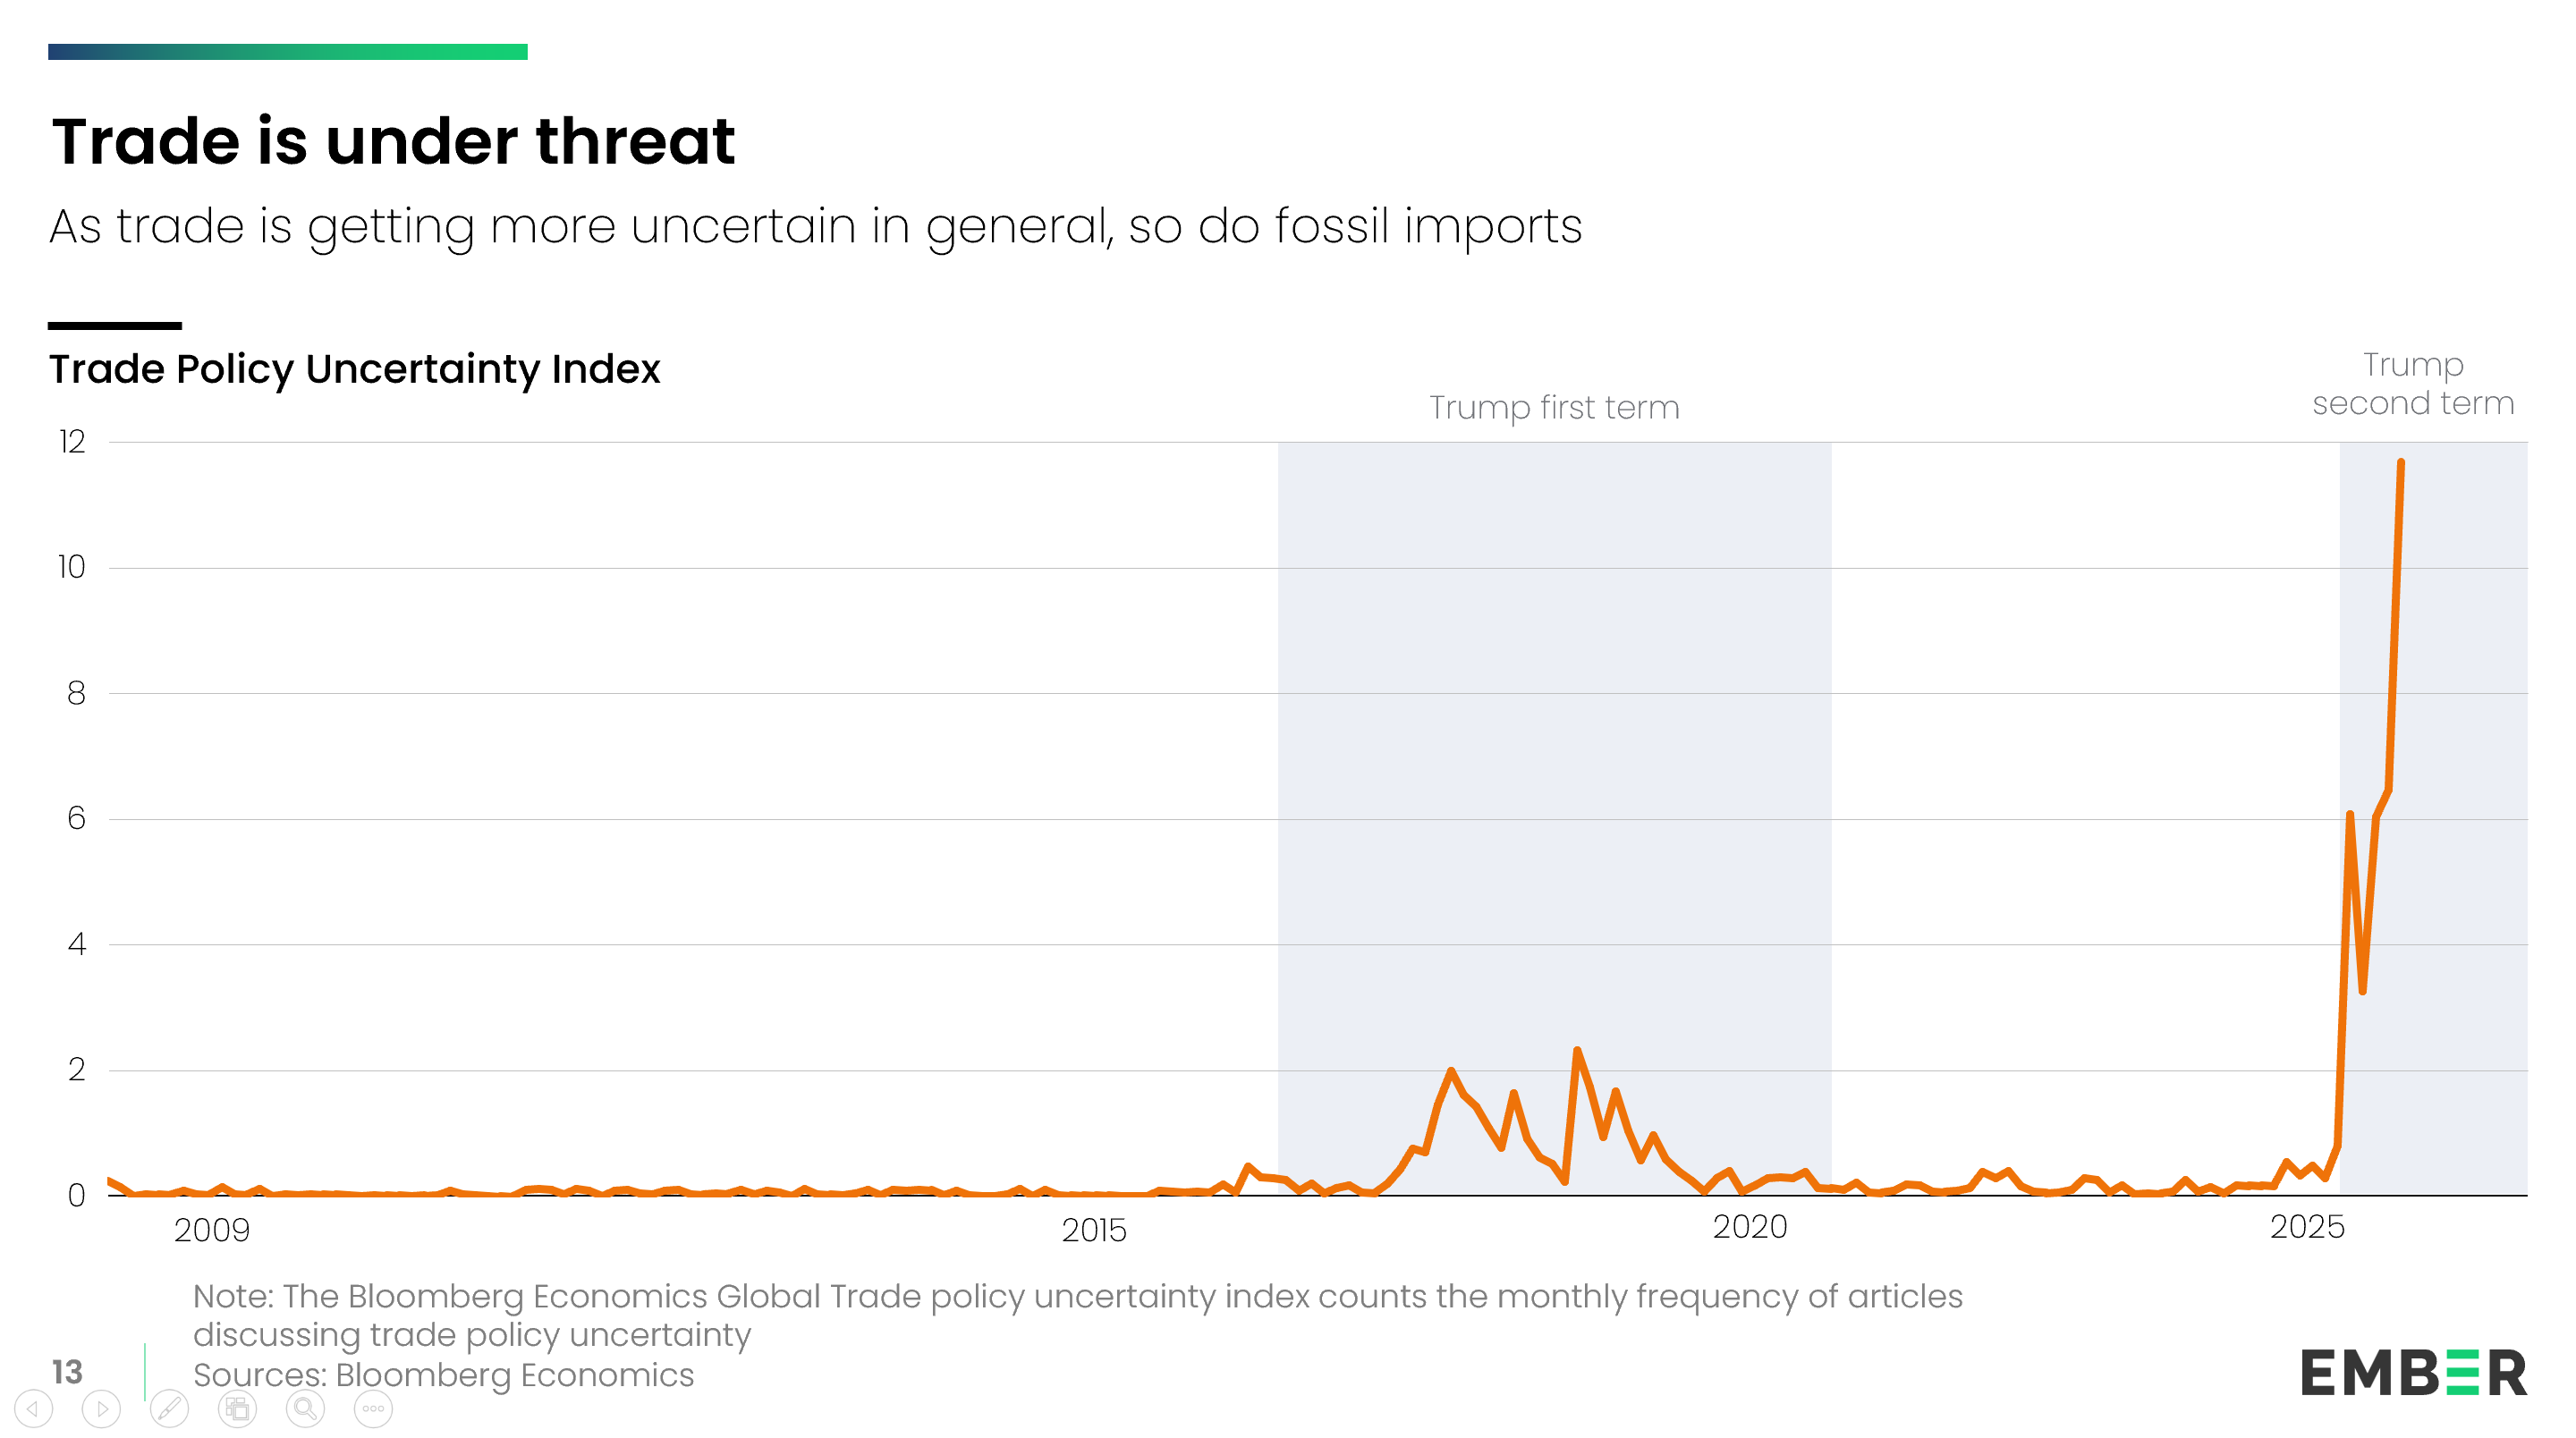
Today, with global trade under greater threat than at any time since World War II, the world’s heavy dependence on fossil imports for essential energy supplies looks increasingly risky.

As governments and business leaders meet at the IEA’s Summit on the Future of Energy Security this week, they should take a sober look at the energy security risks that their respective countries now face.

01

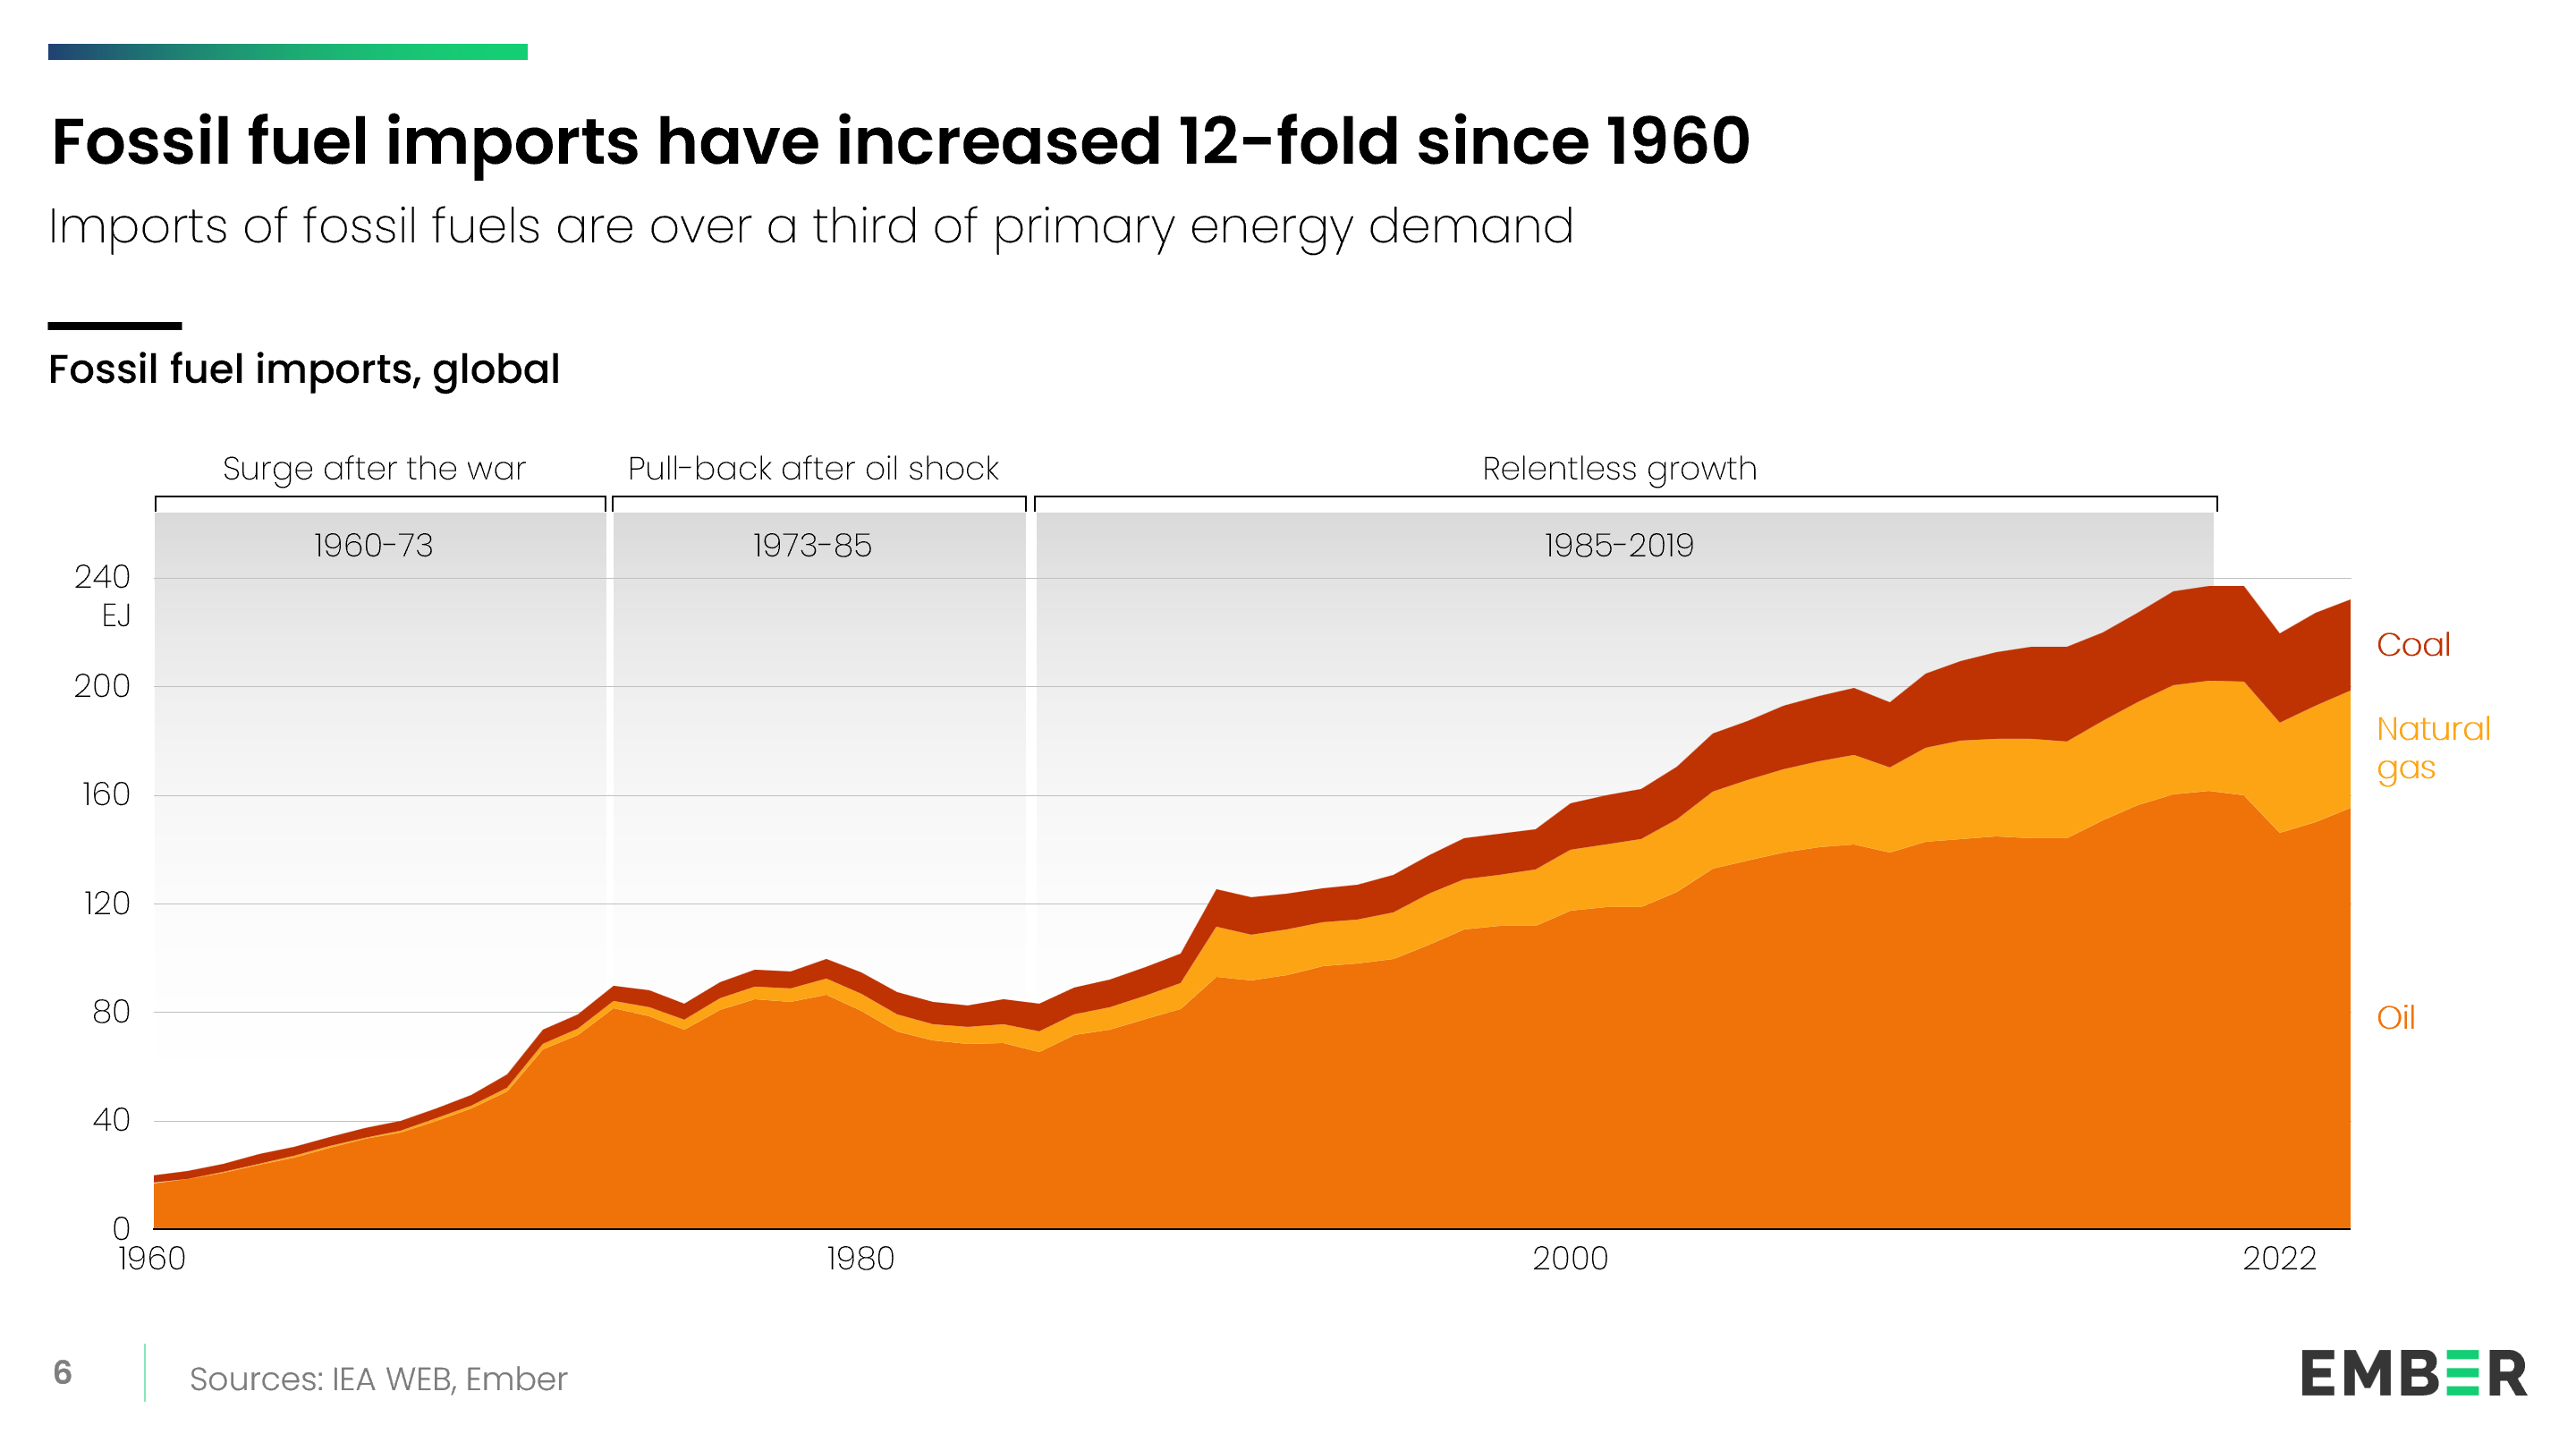
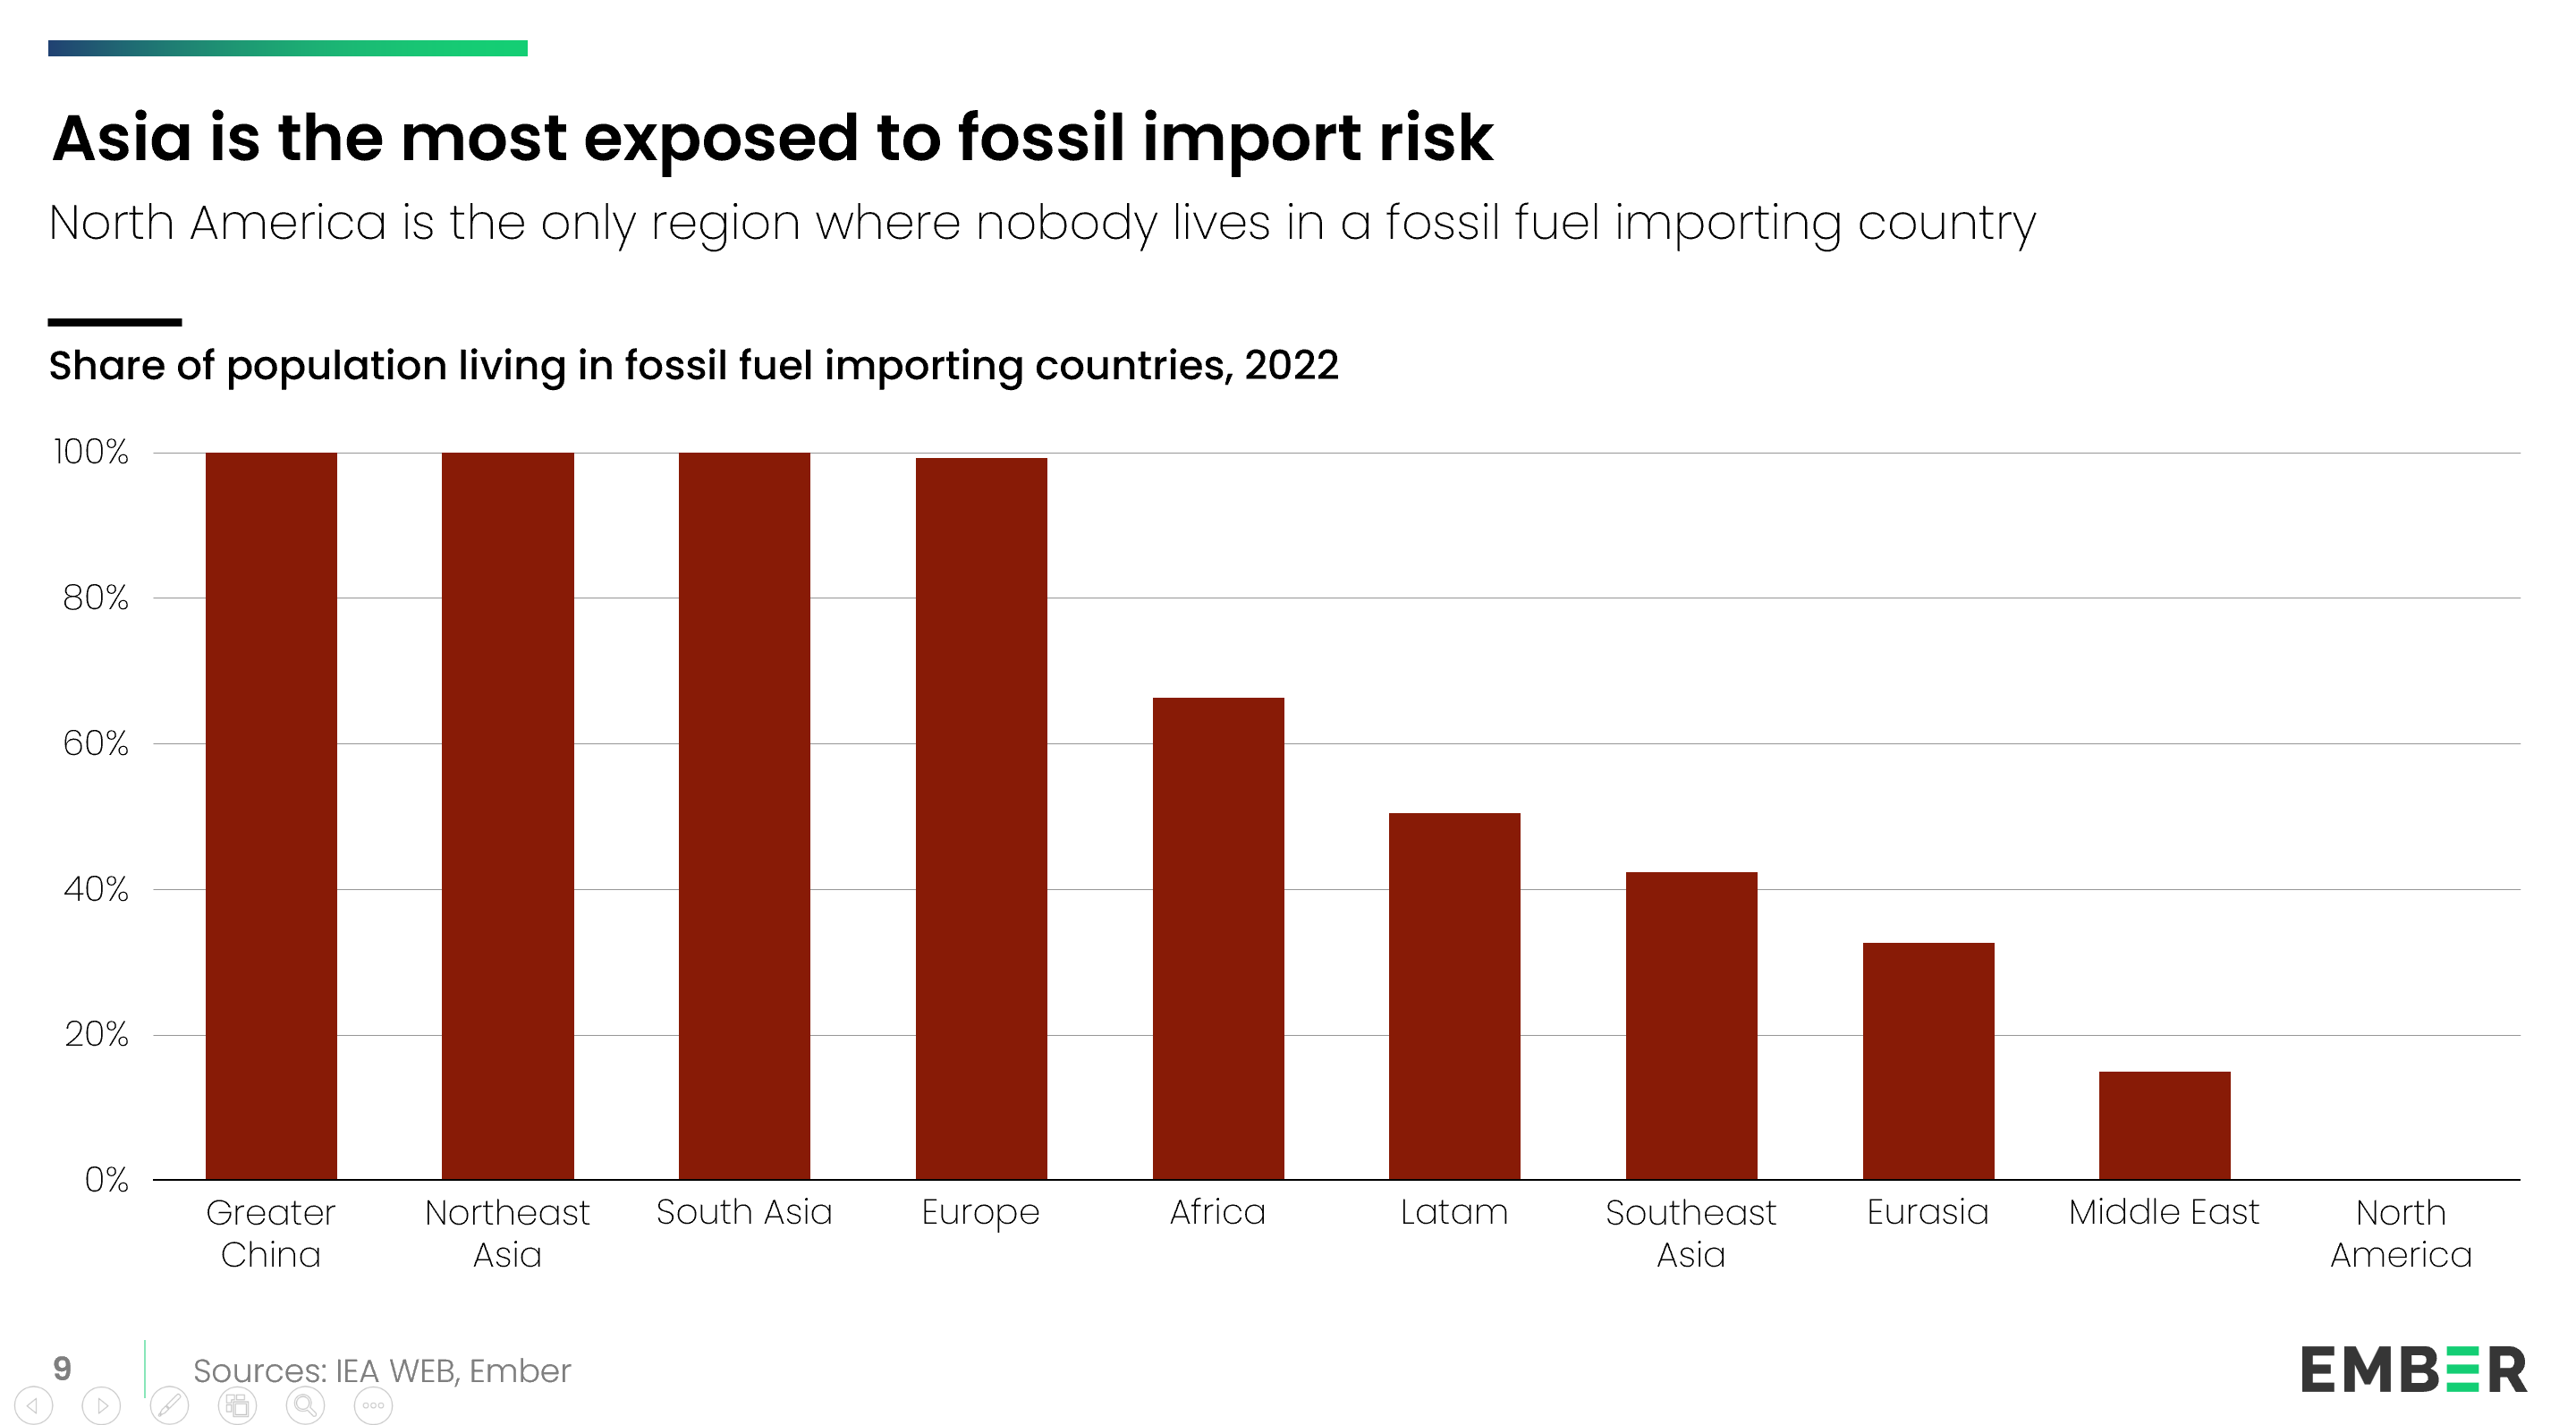
37% of primary energy is imported

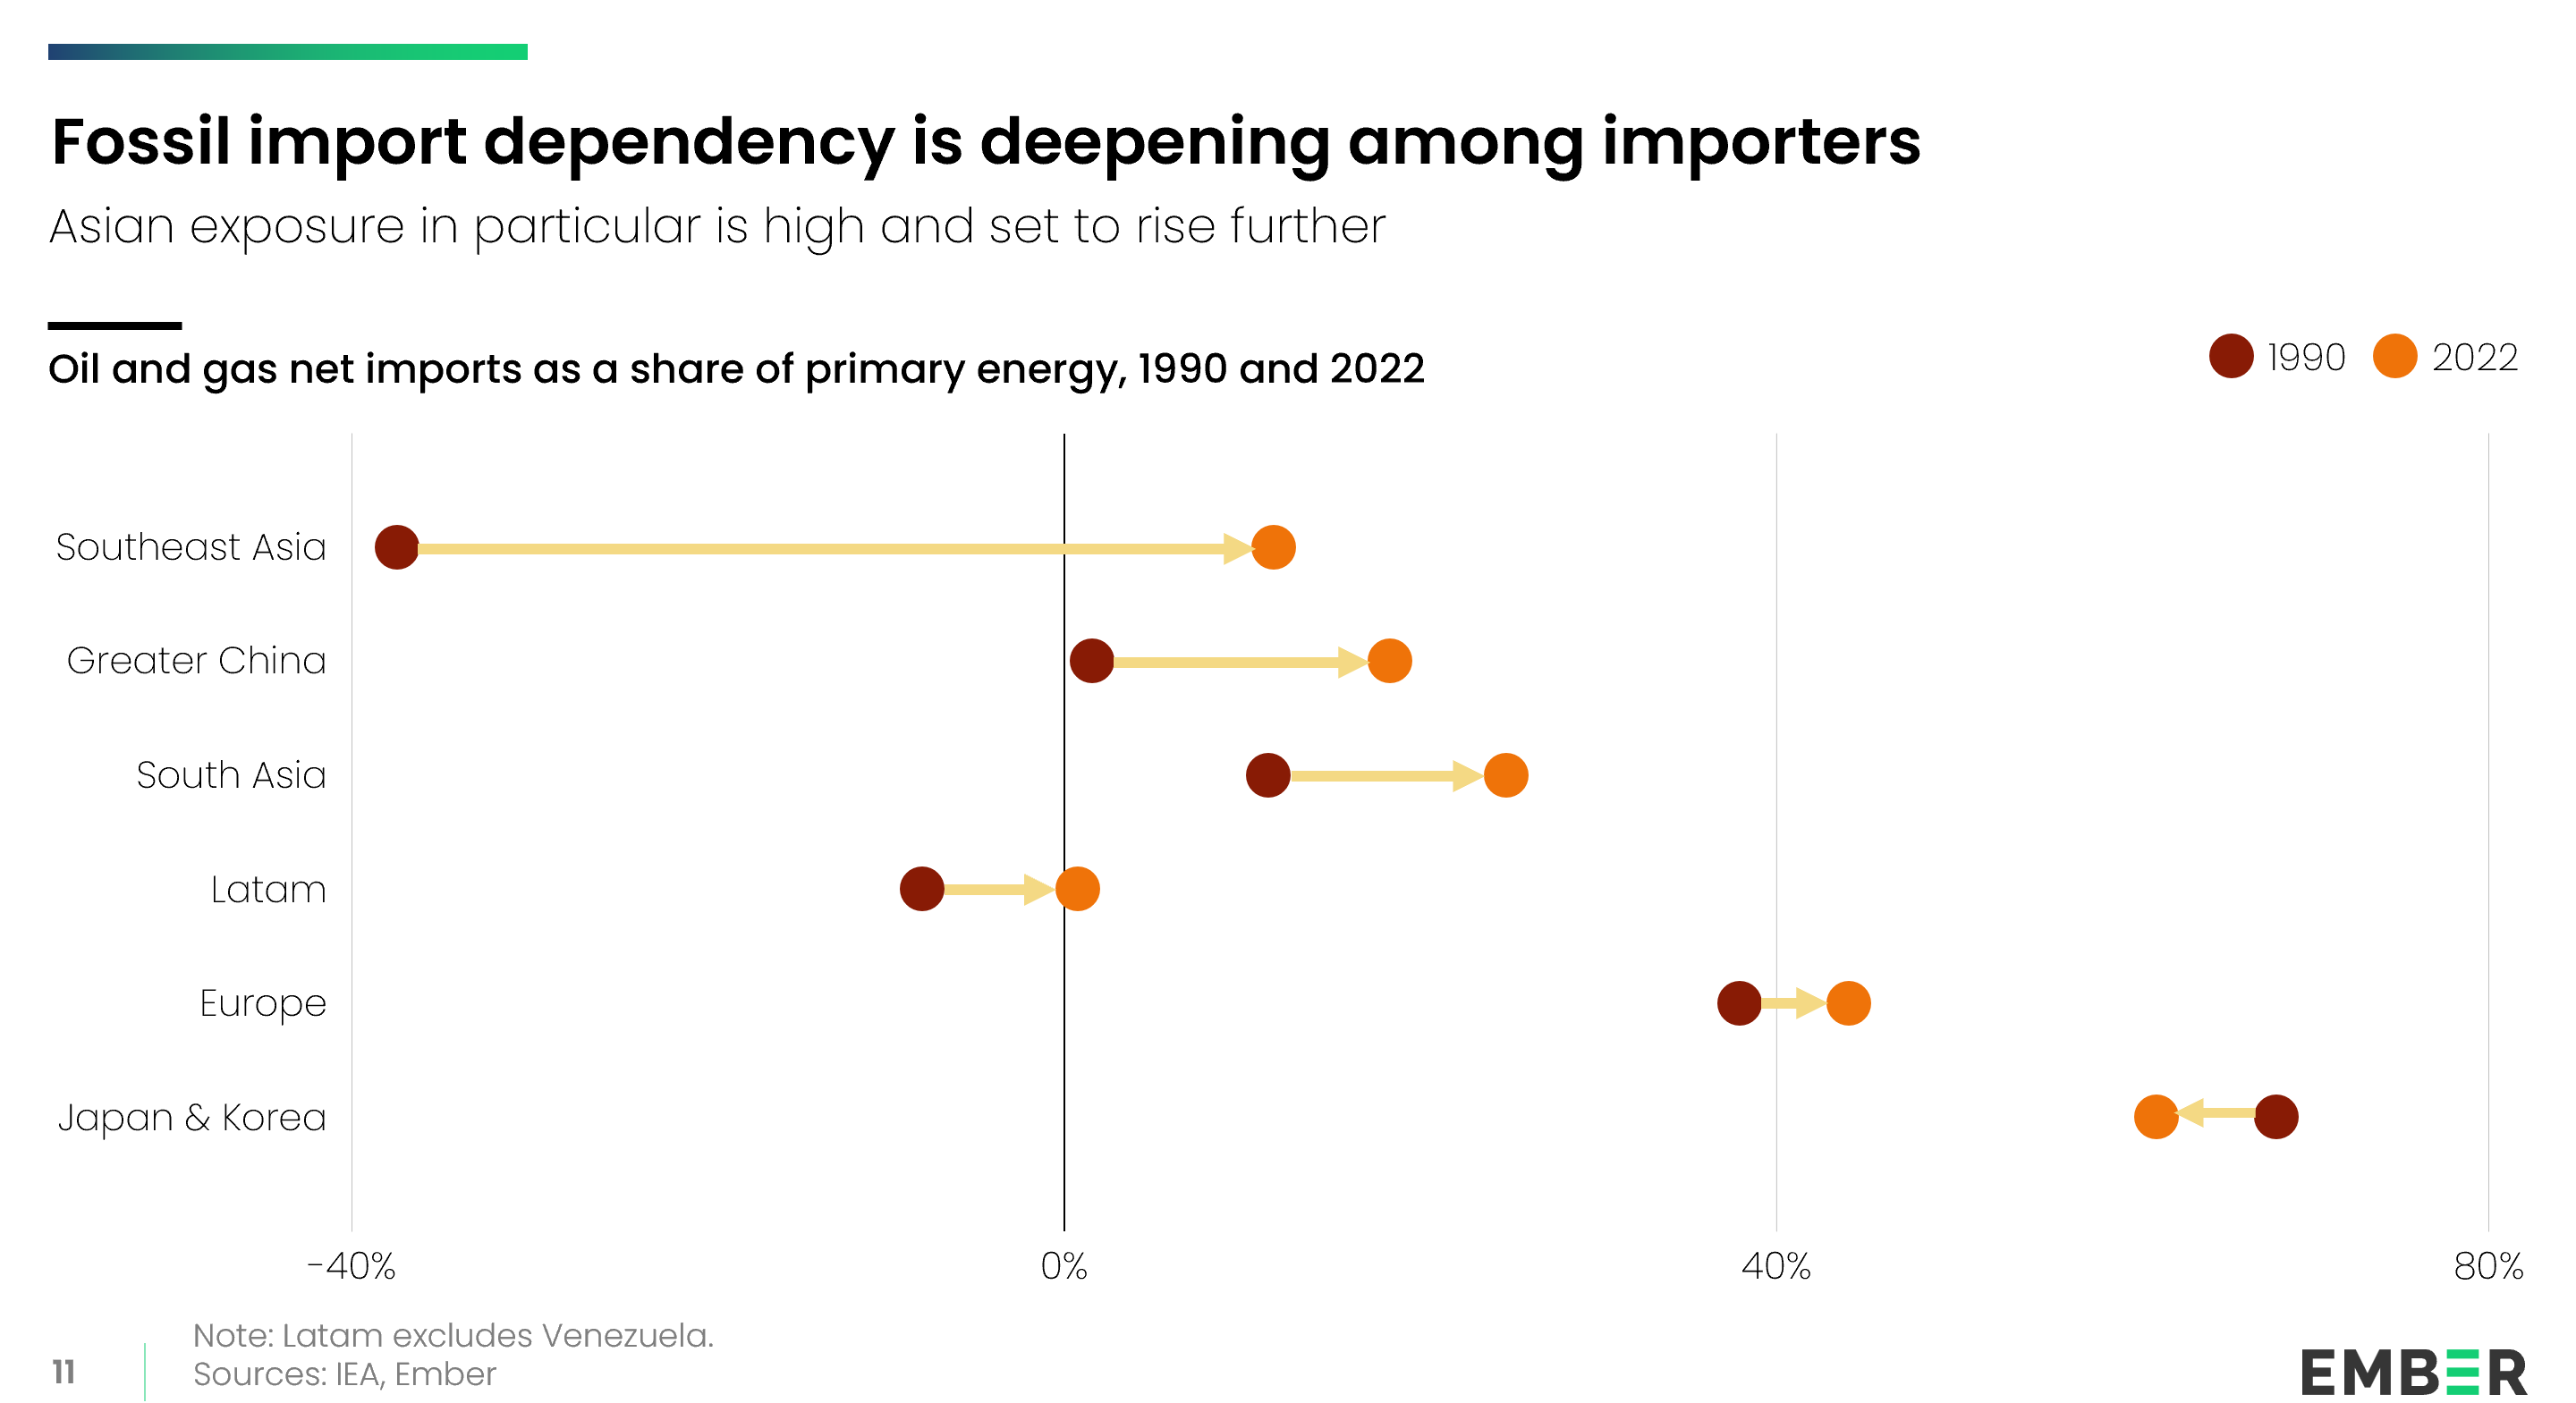
Under the Pax Americana, fossil fuel imports have risen twelvefold since 1960, reaching 37% of global primary energy demand in 2022. In 2022, net fossil fuel imports cost the global economy $1.8 trillion USD, equivalent to 1.8% of global GDP that year. 74% of the world’s population live in countries that are net importers of fossil fuels, according to Ember’s calculations from IEA energy balances data in 2022. This includes all of Greater China, South Asia and Northeast Asia; 99% of Europeans; two-thirds of Africans; and nearly half the populations of Southeast Asia and Latin America.

02

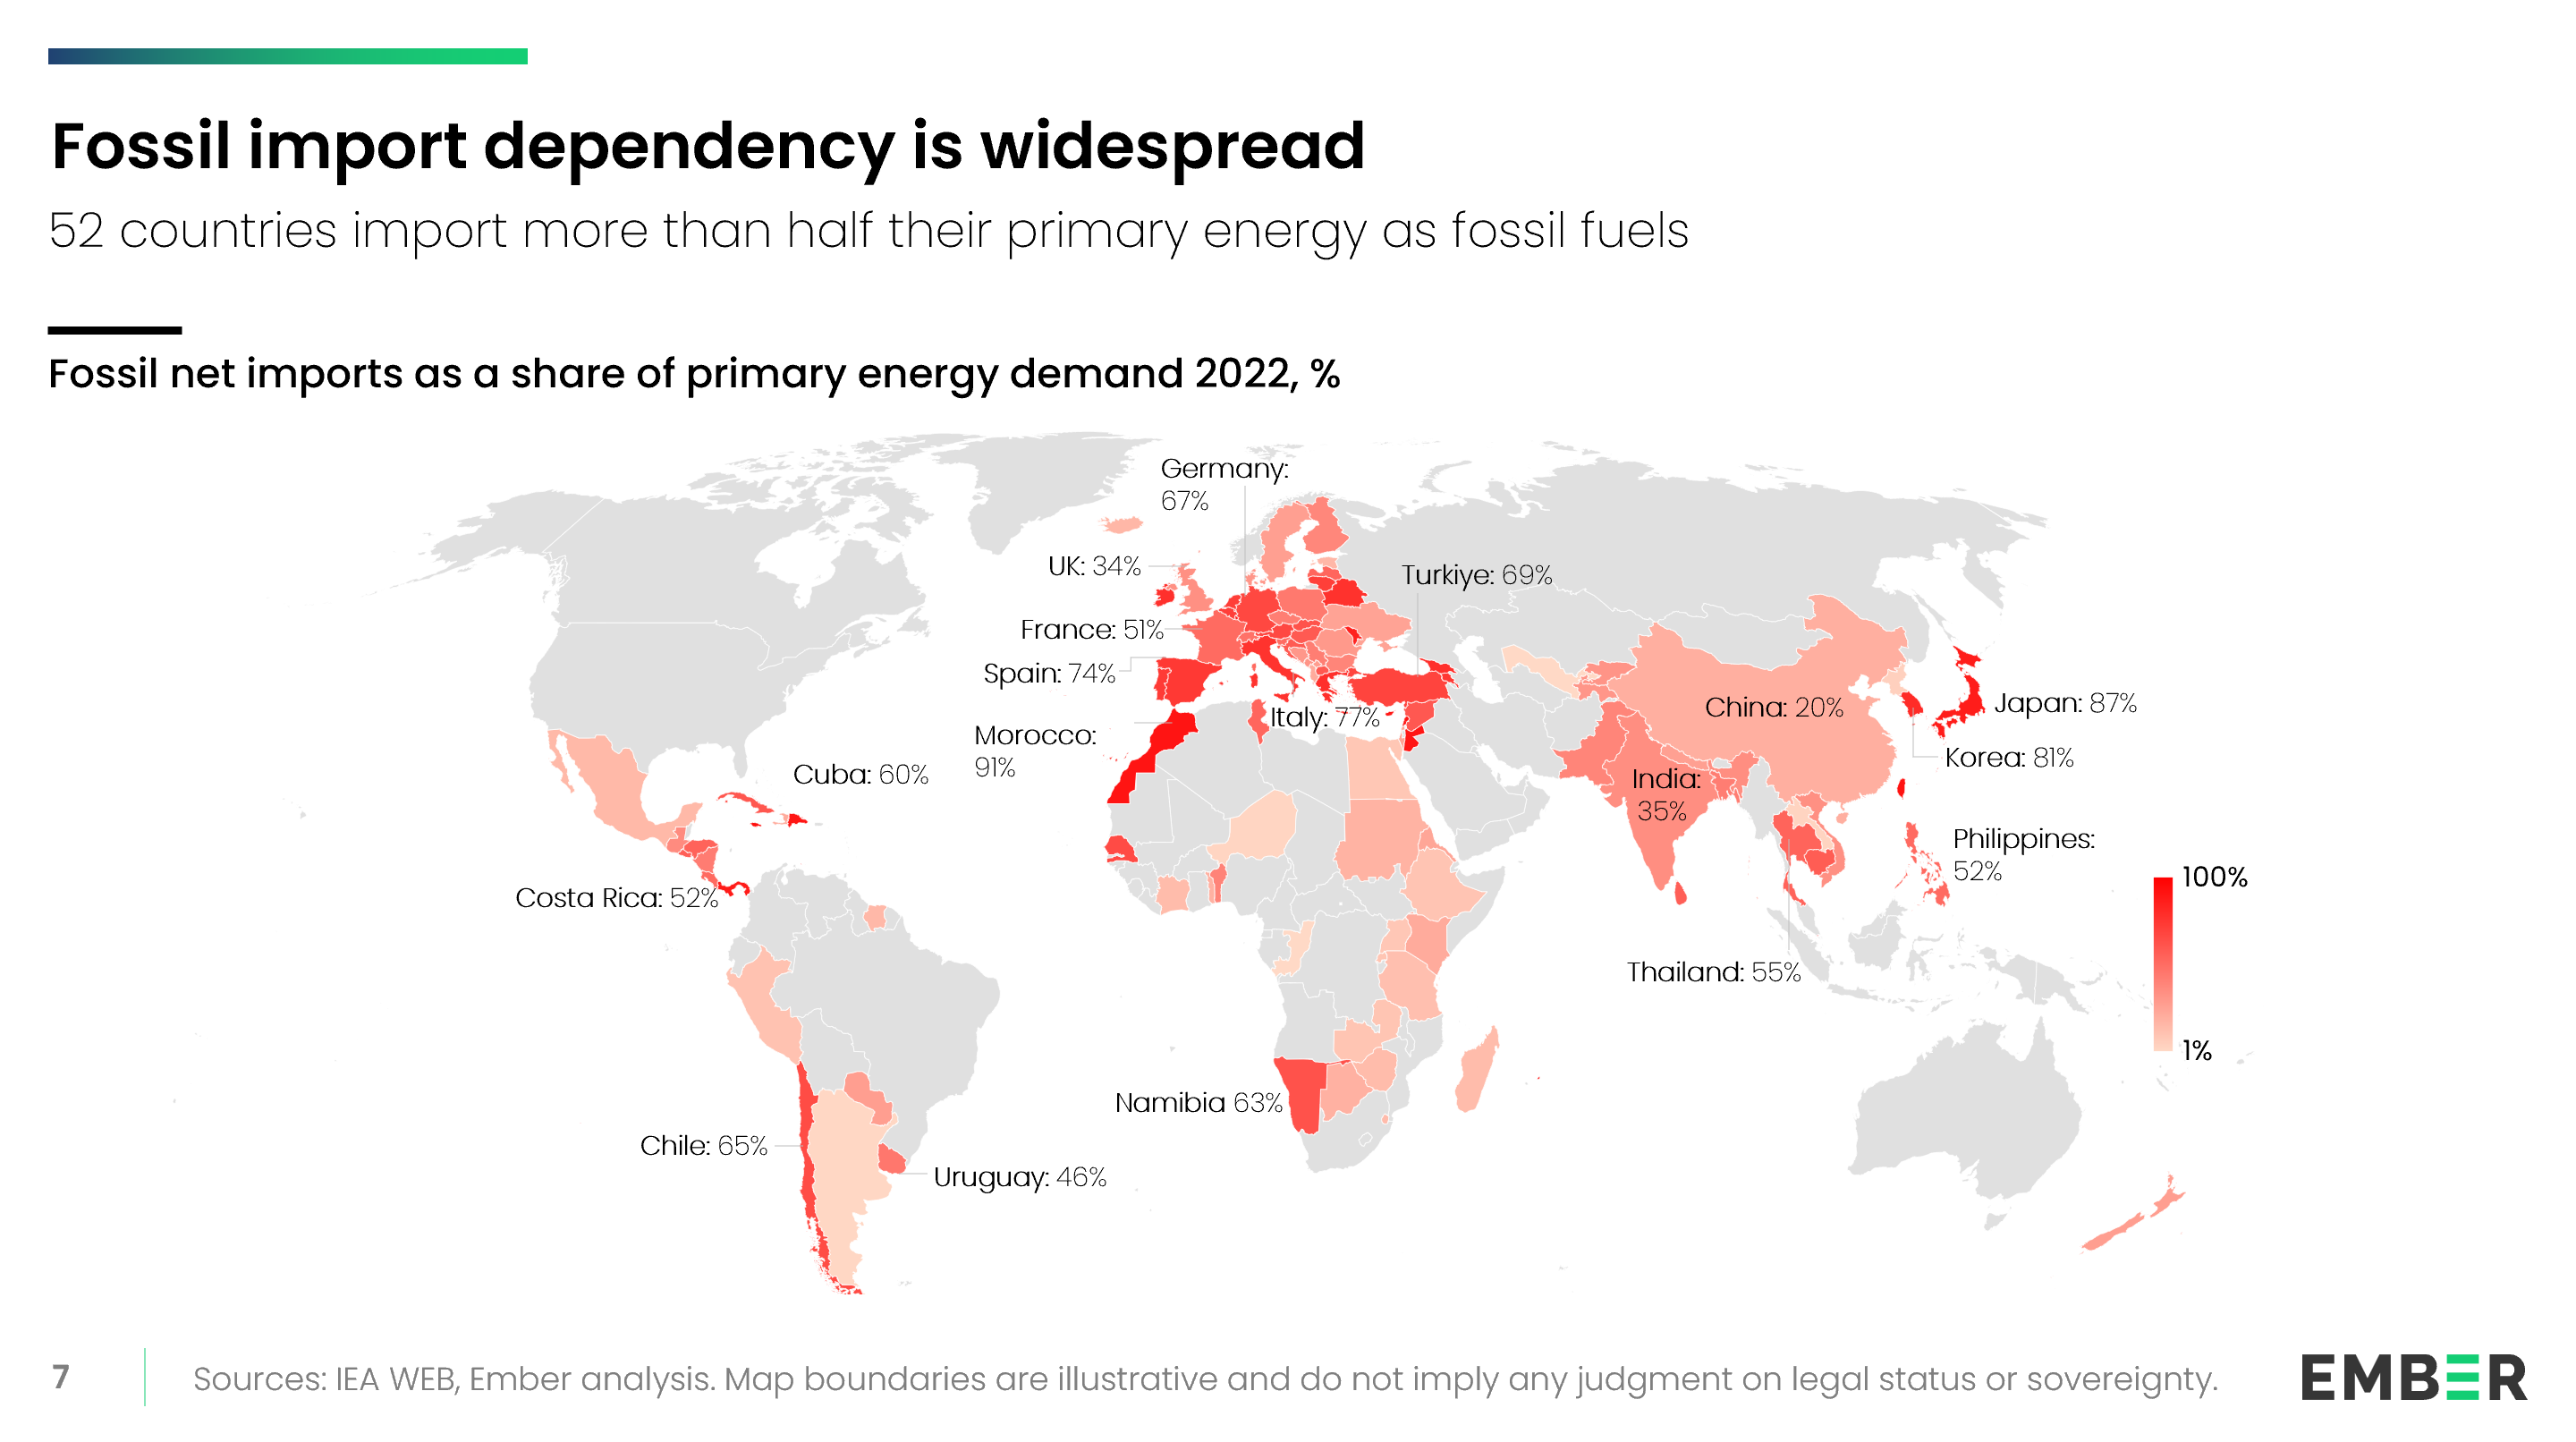
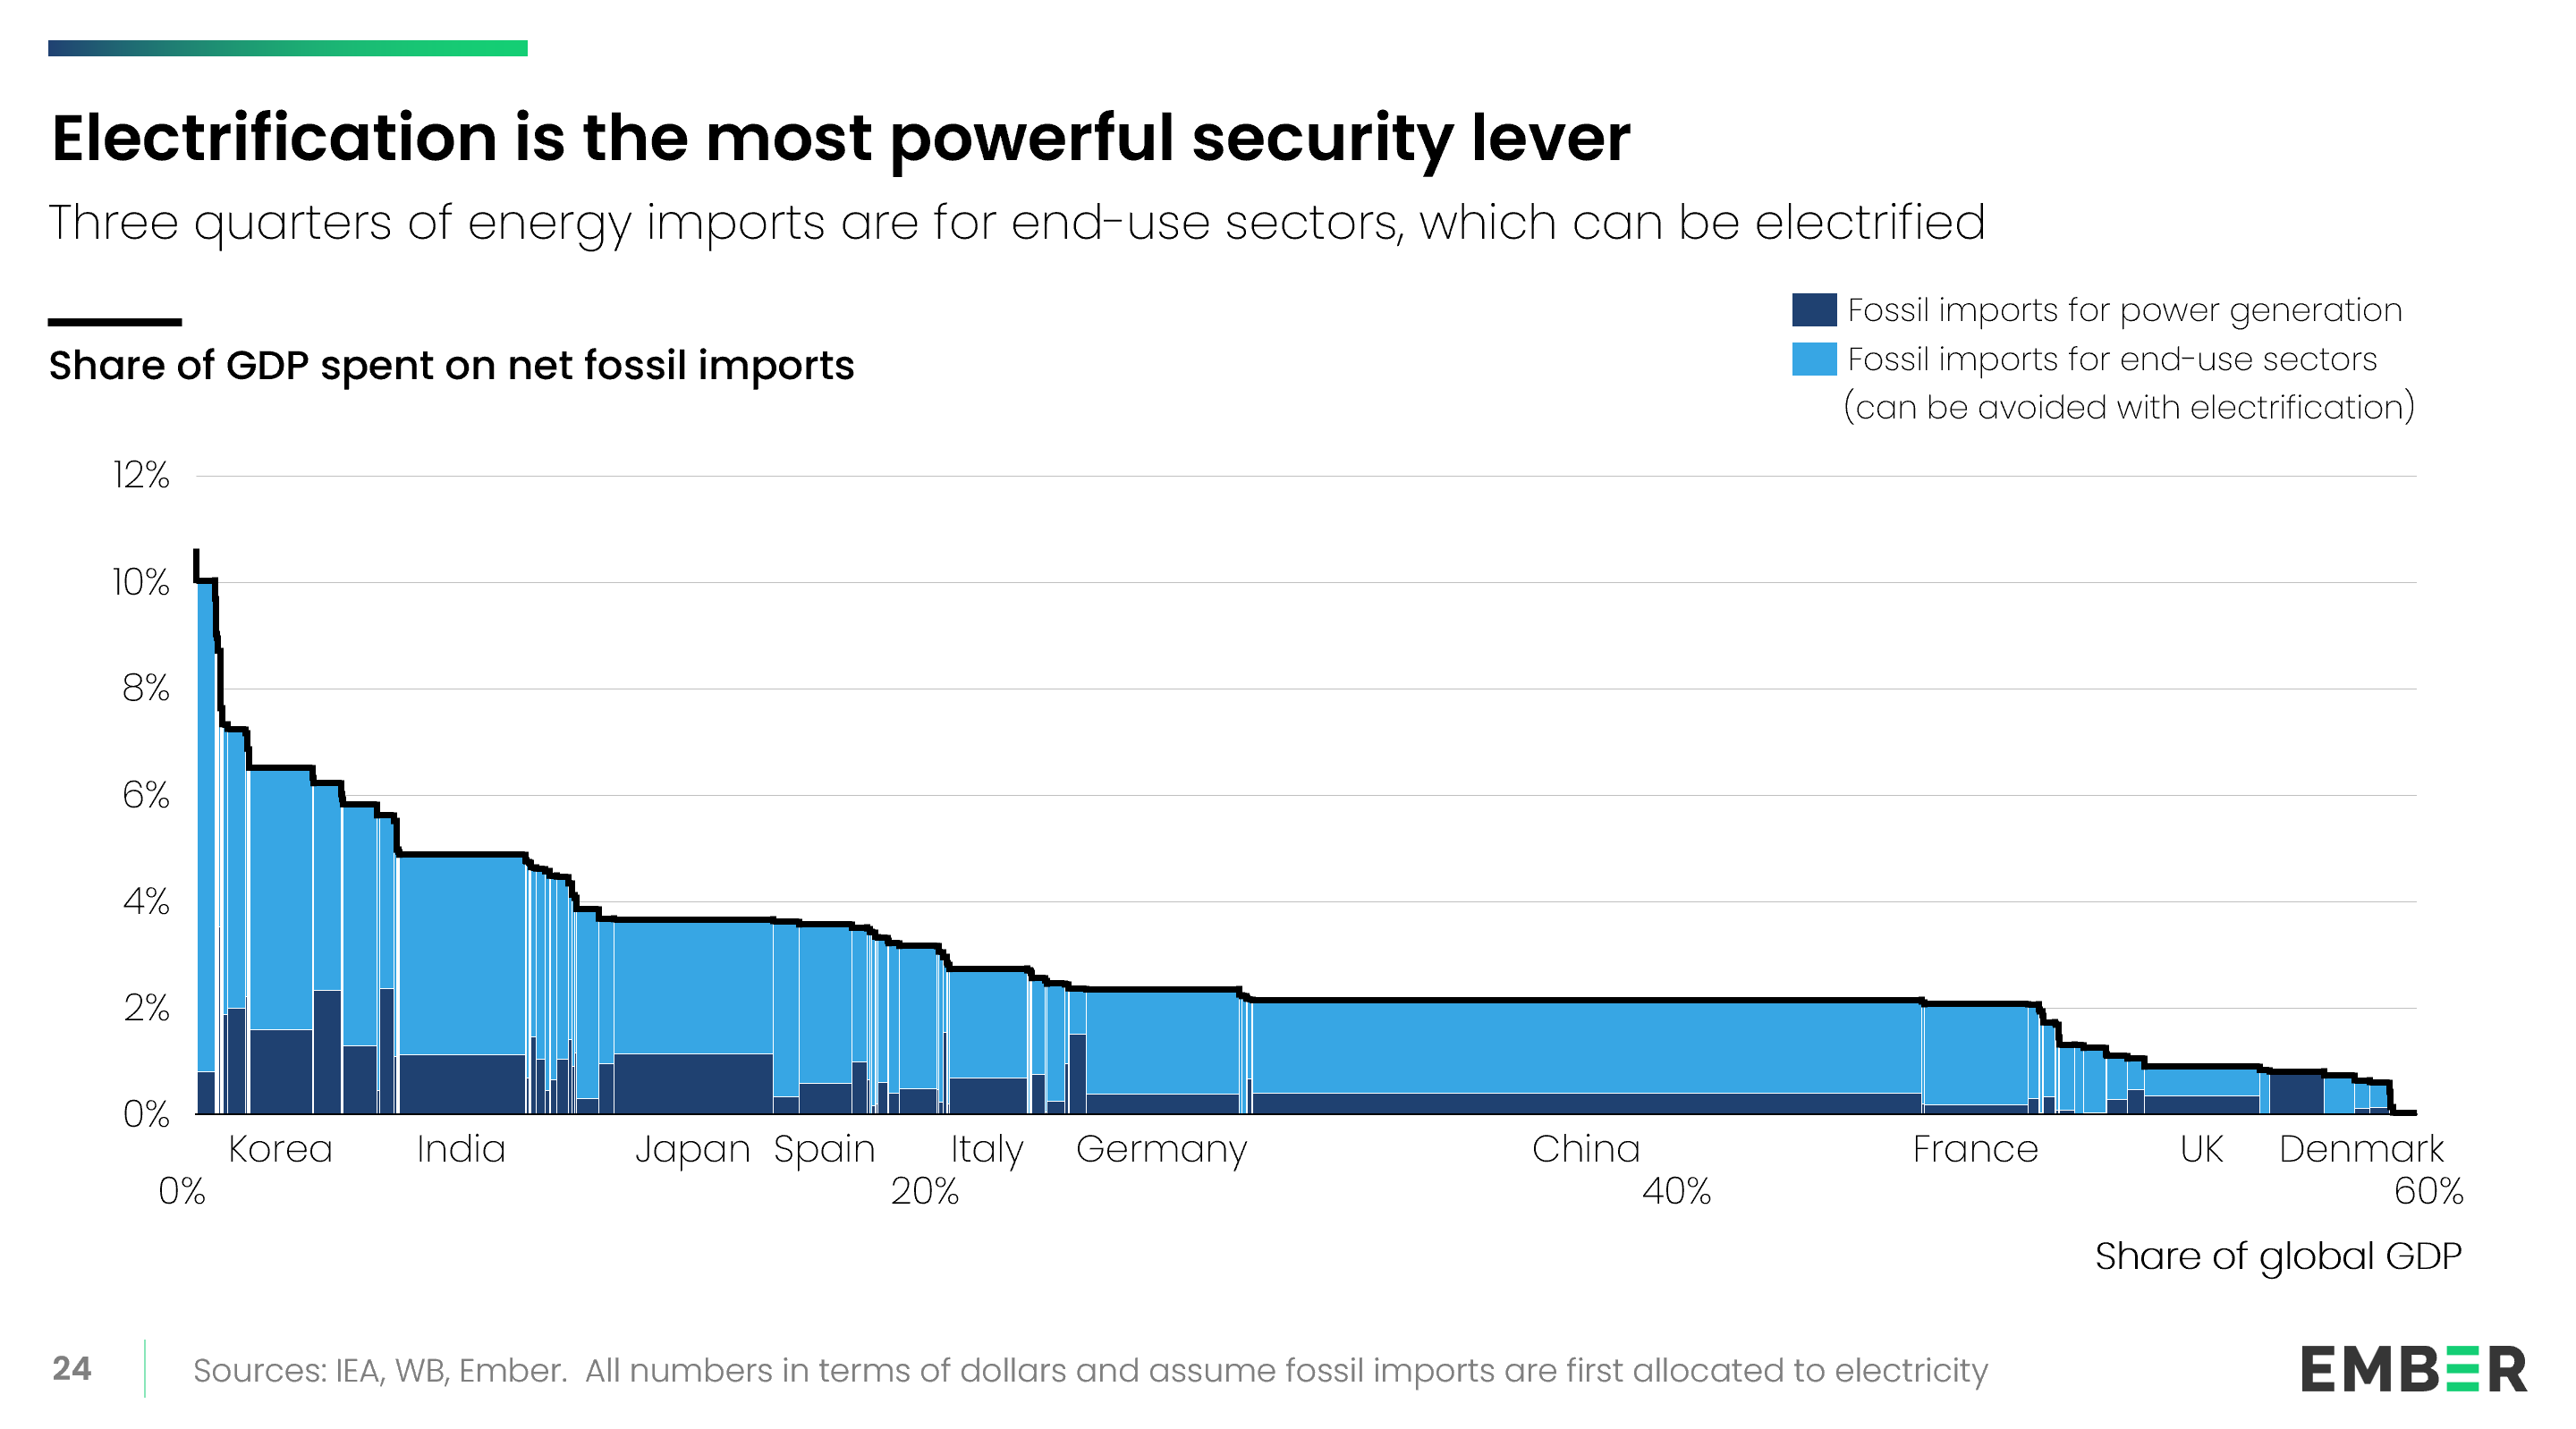
52 countries import over half their energy from fossil fuels

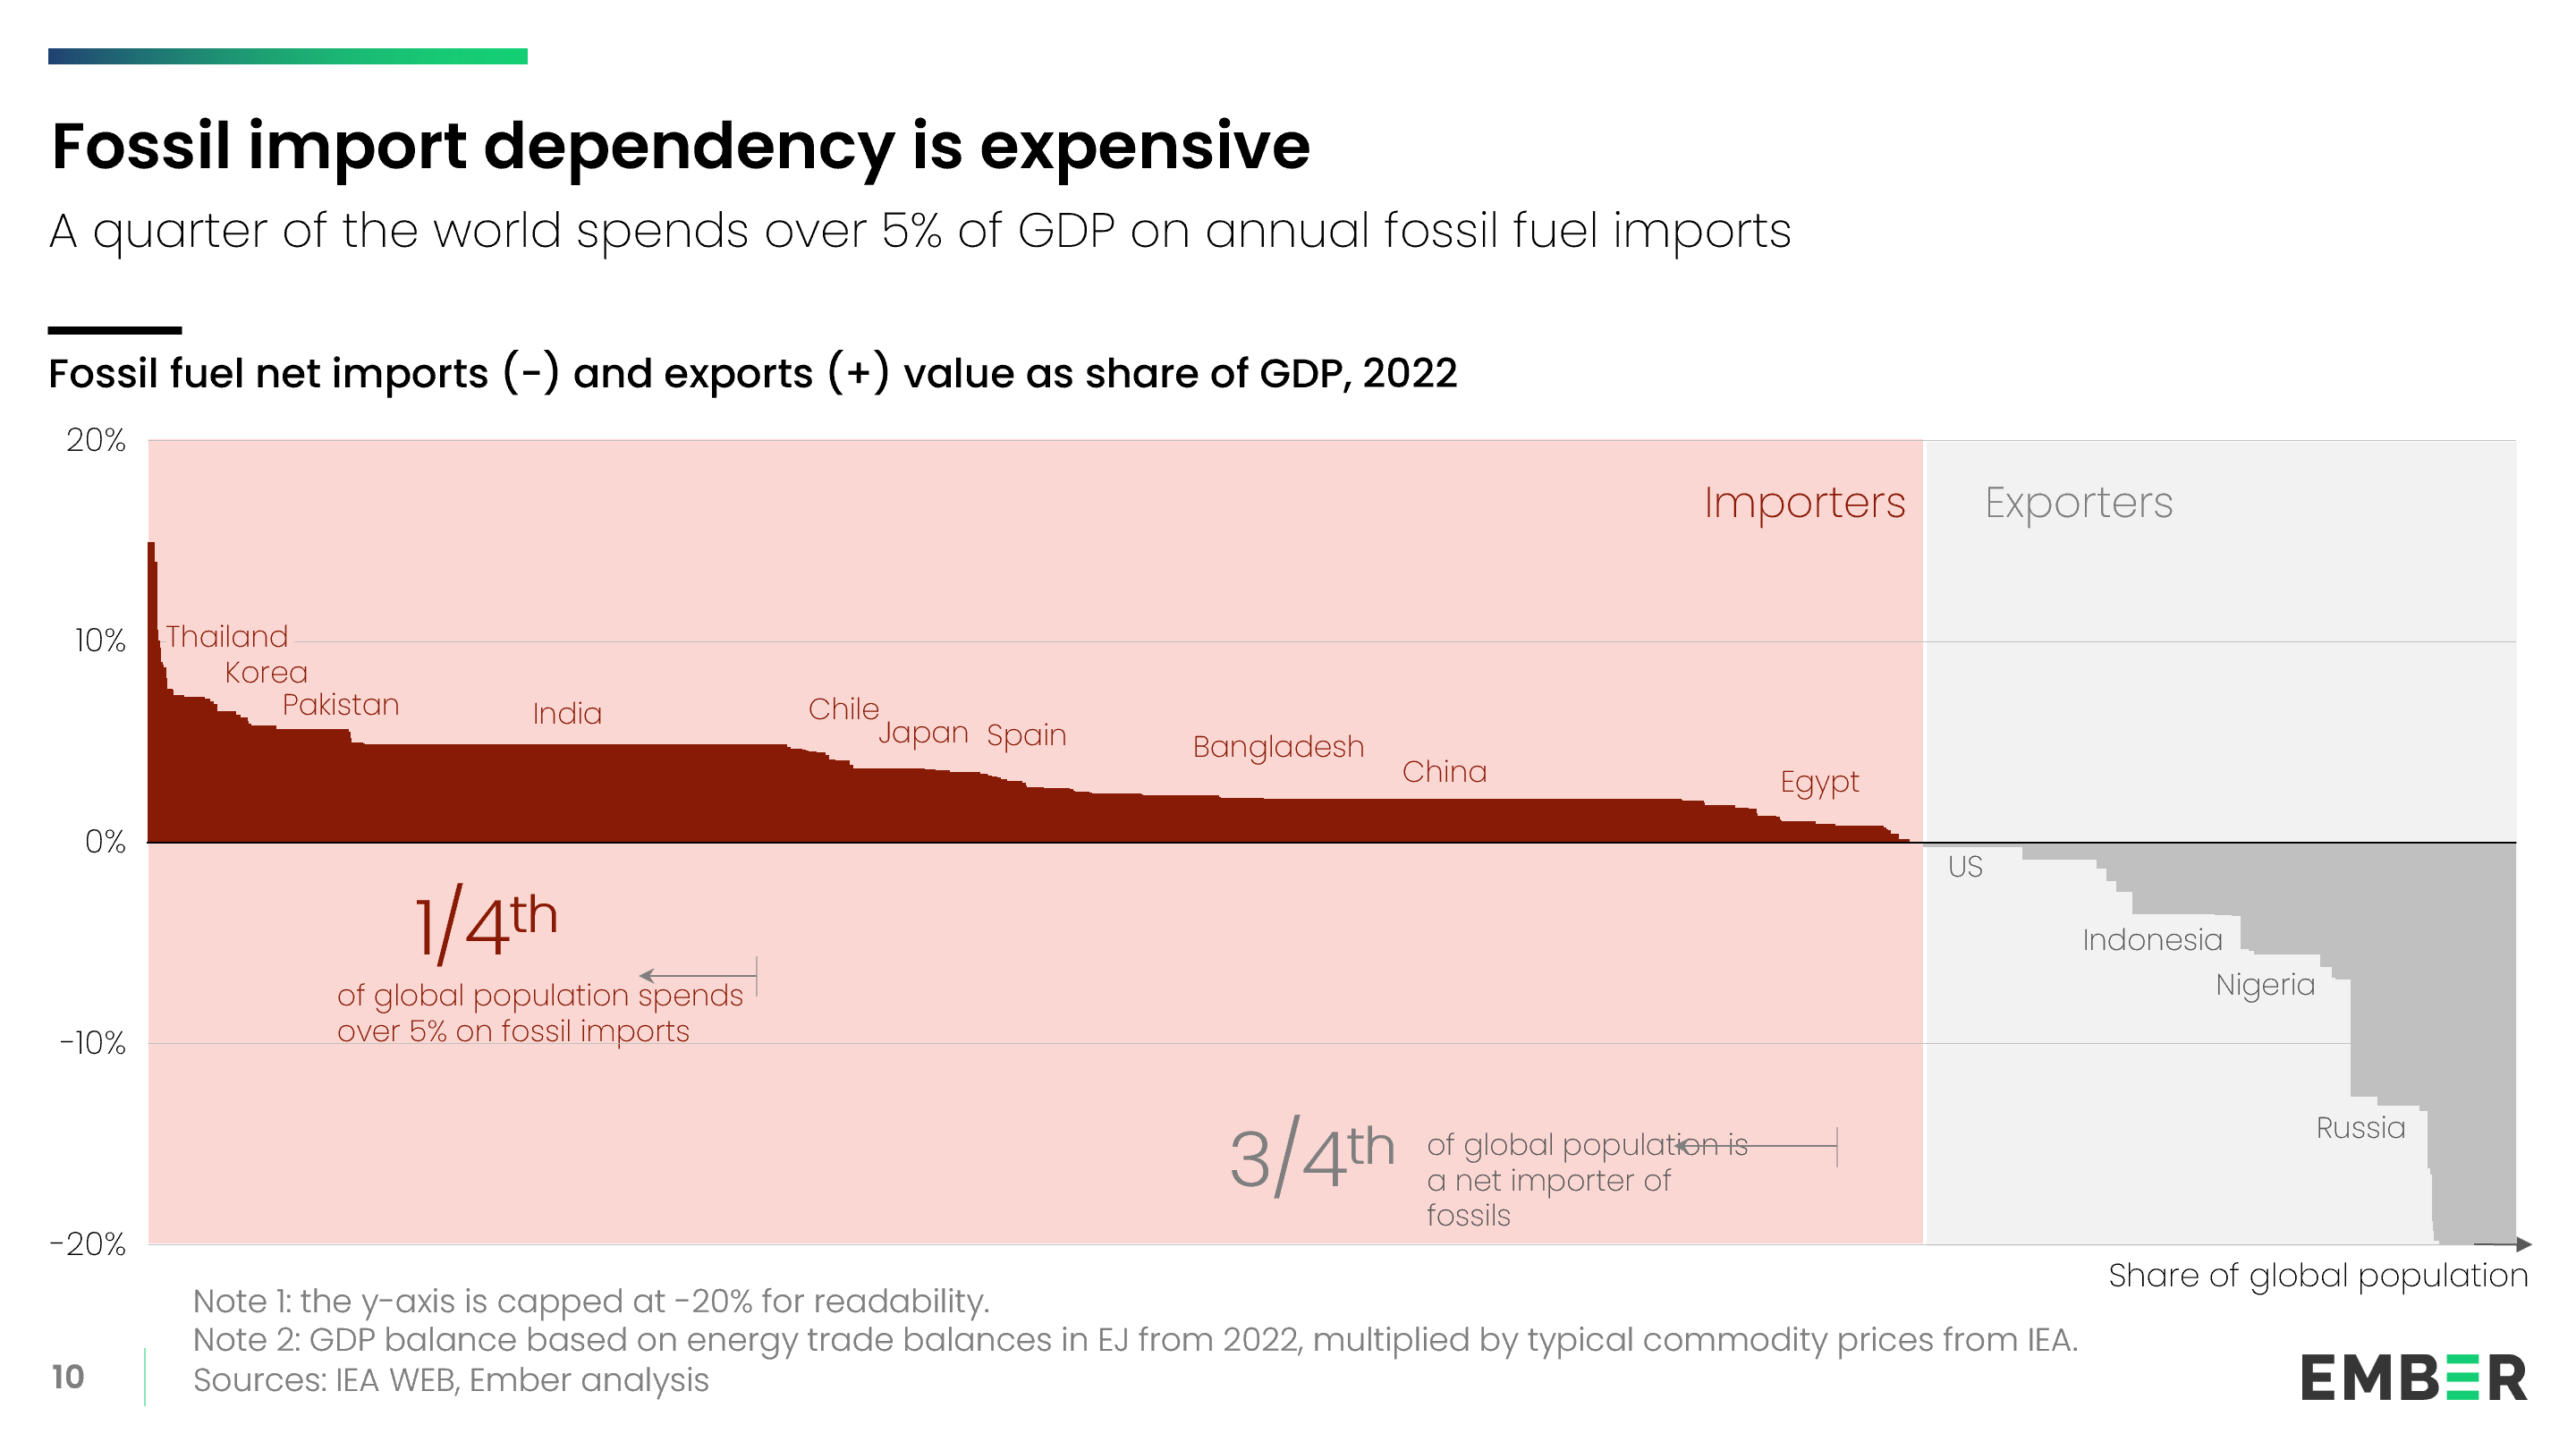
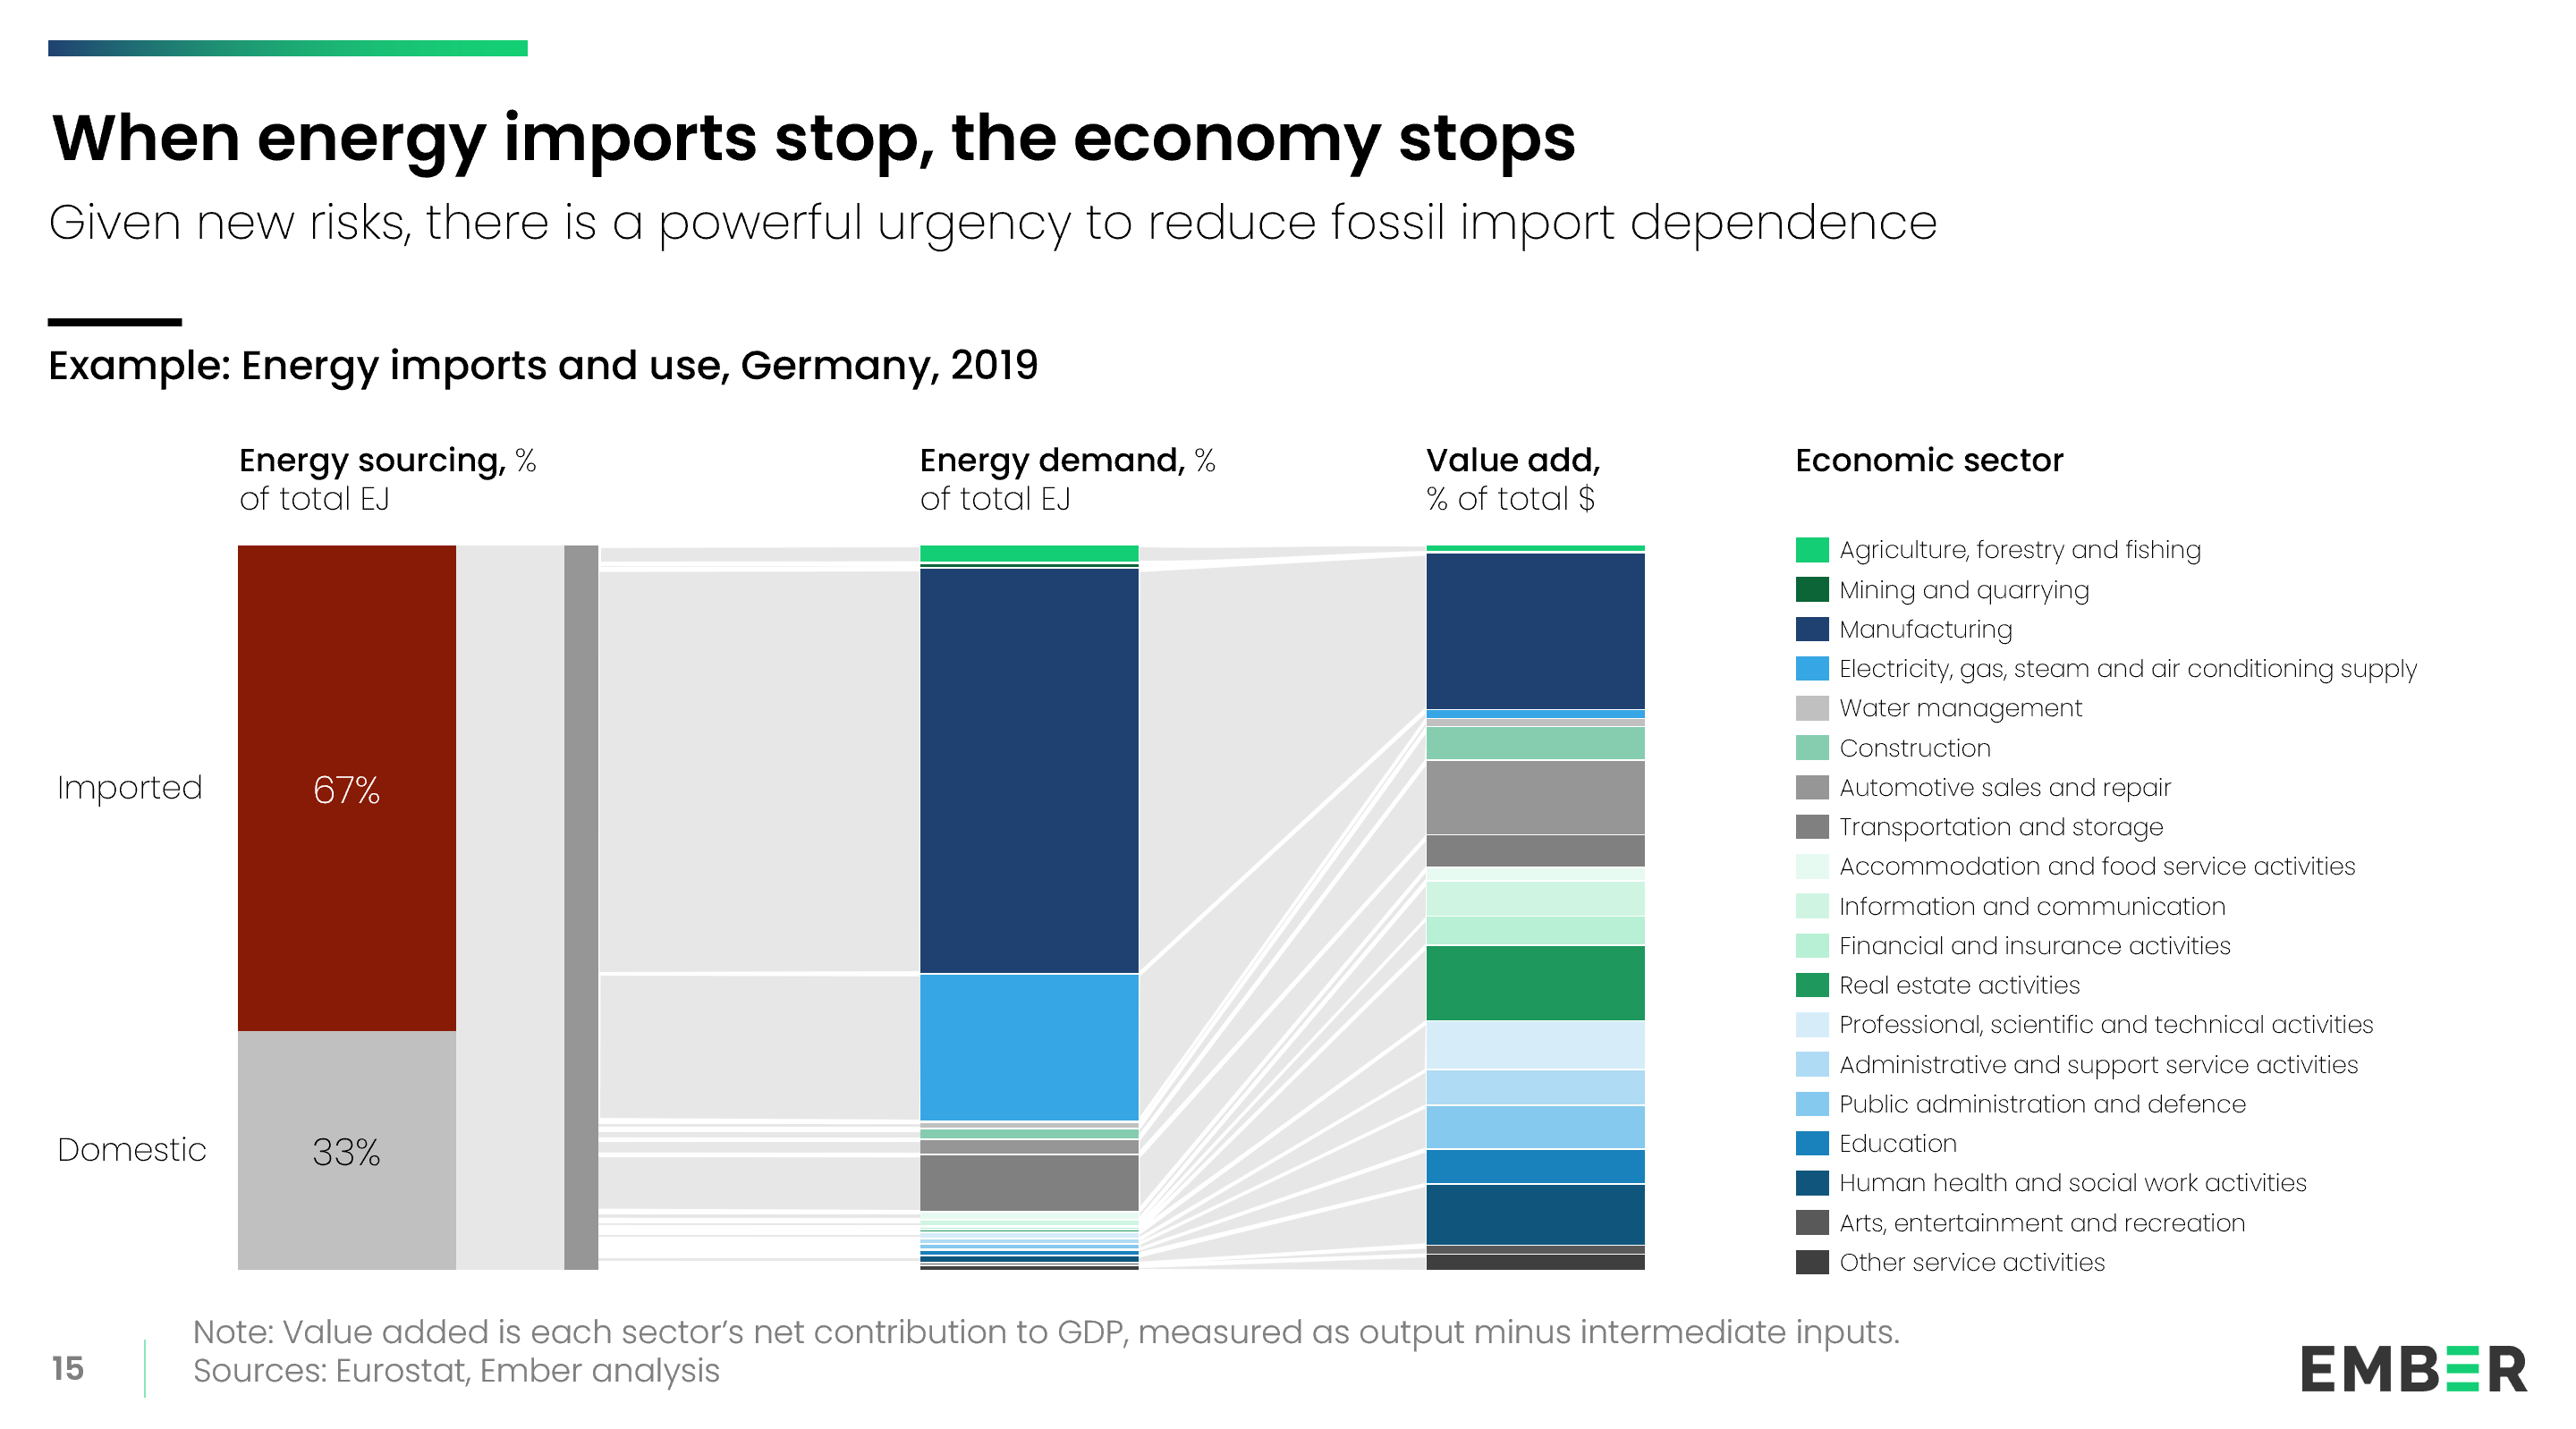
Many countries are considerably exposed. 52 countries import over half their energy in the form of fossil fuels. A fifth of global GDP comes from countries where net fossil fuel imports provide over two-thirds of their energy, including Germany, Japan and Italy. Globally, one in four people live in countries that spend at least 5% of their annual GDP on fossil fuel imports, most notably India which spent 5% in 2022.

03

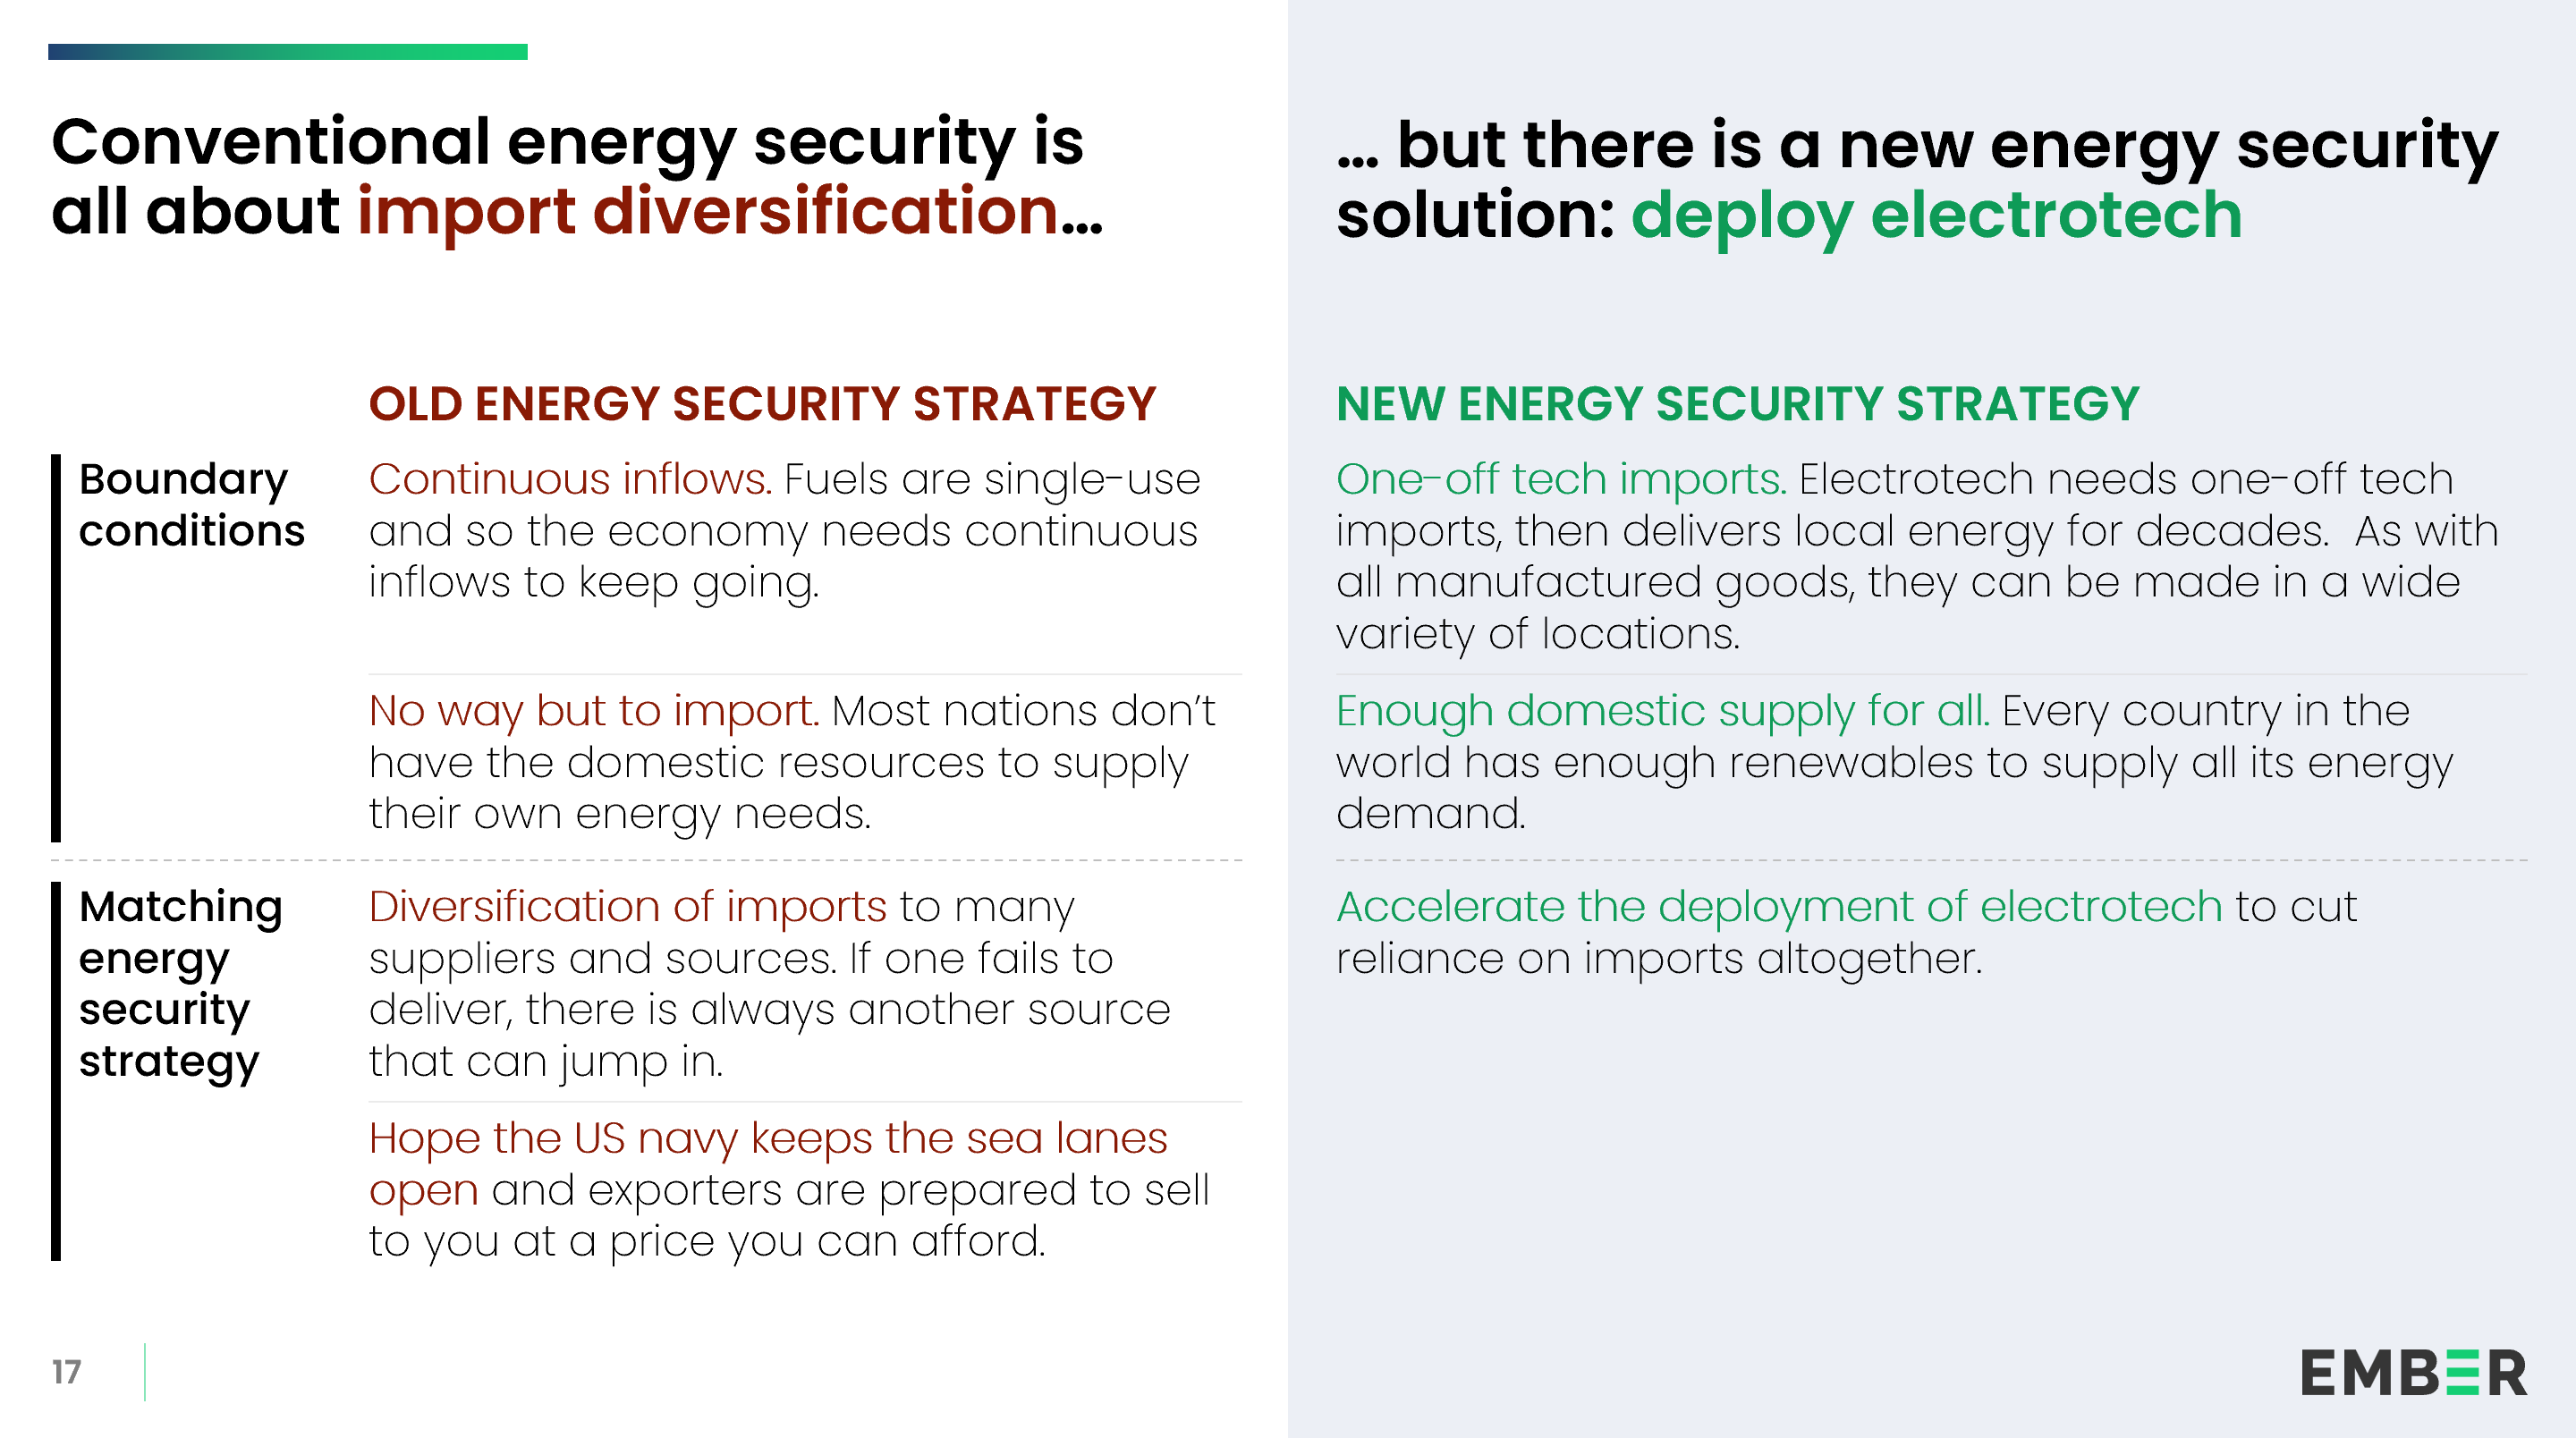
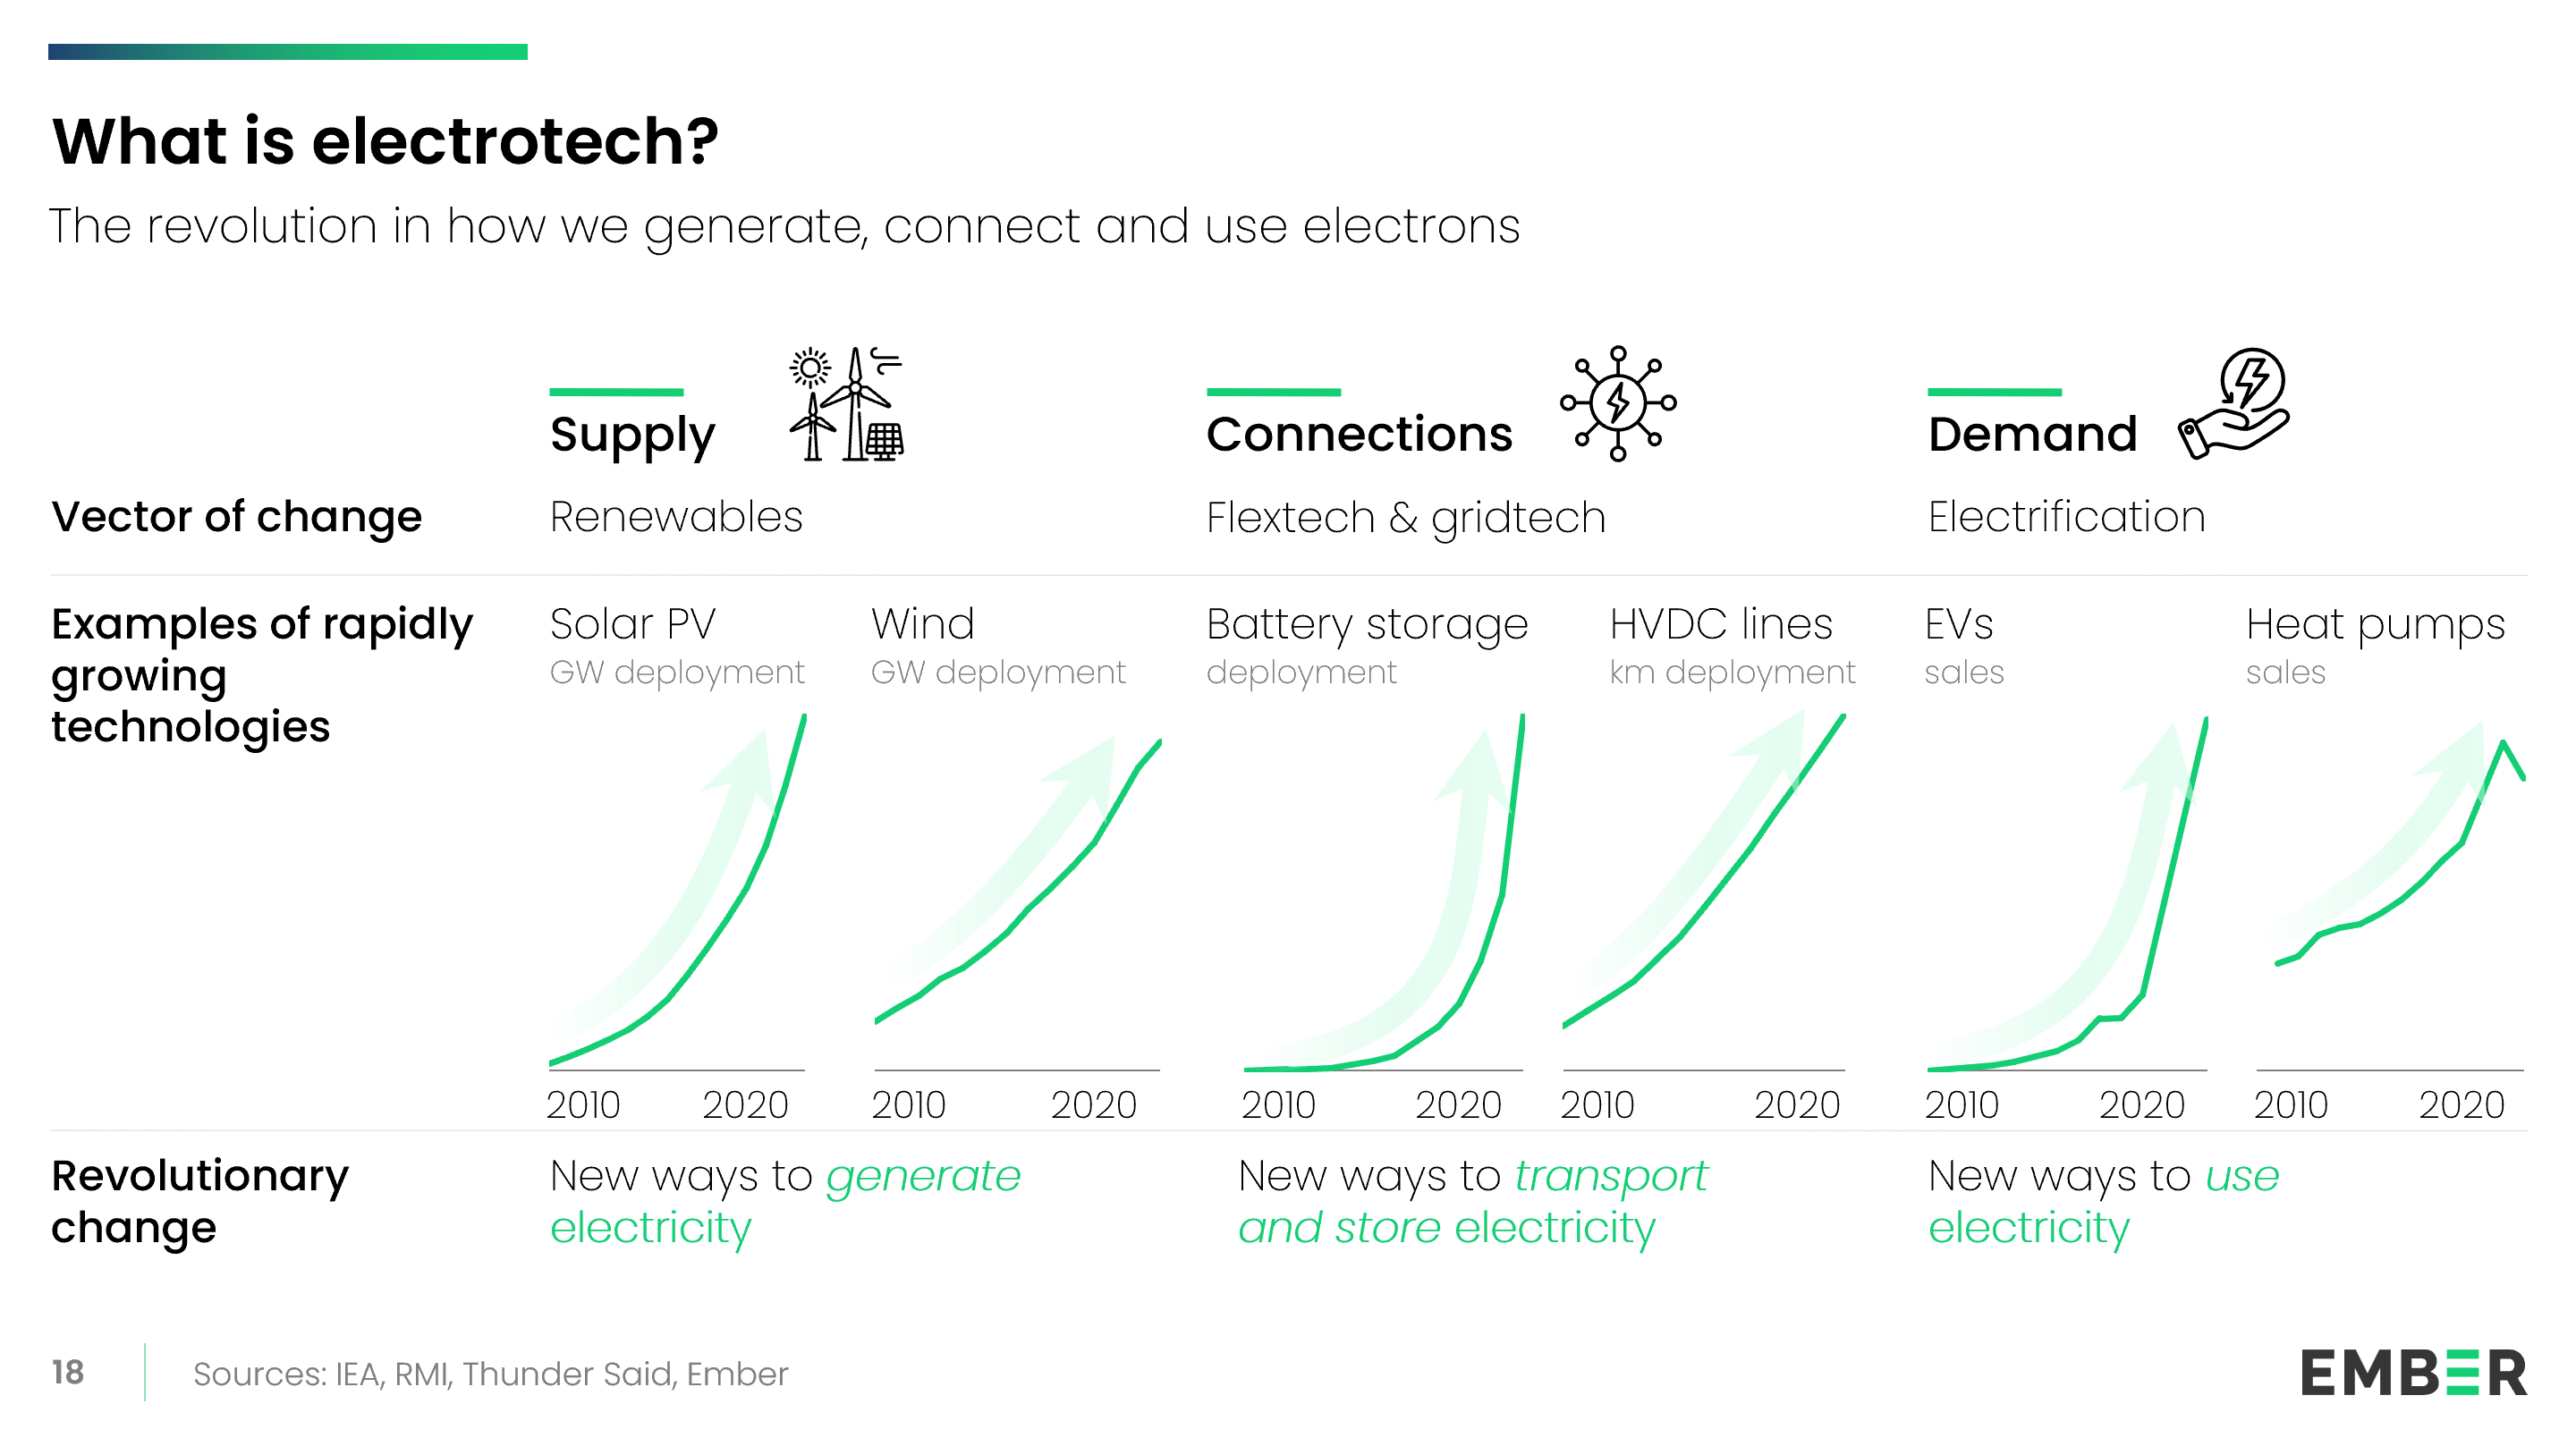
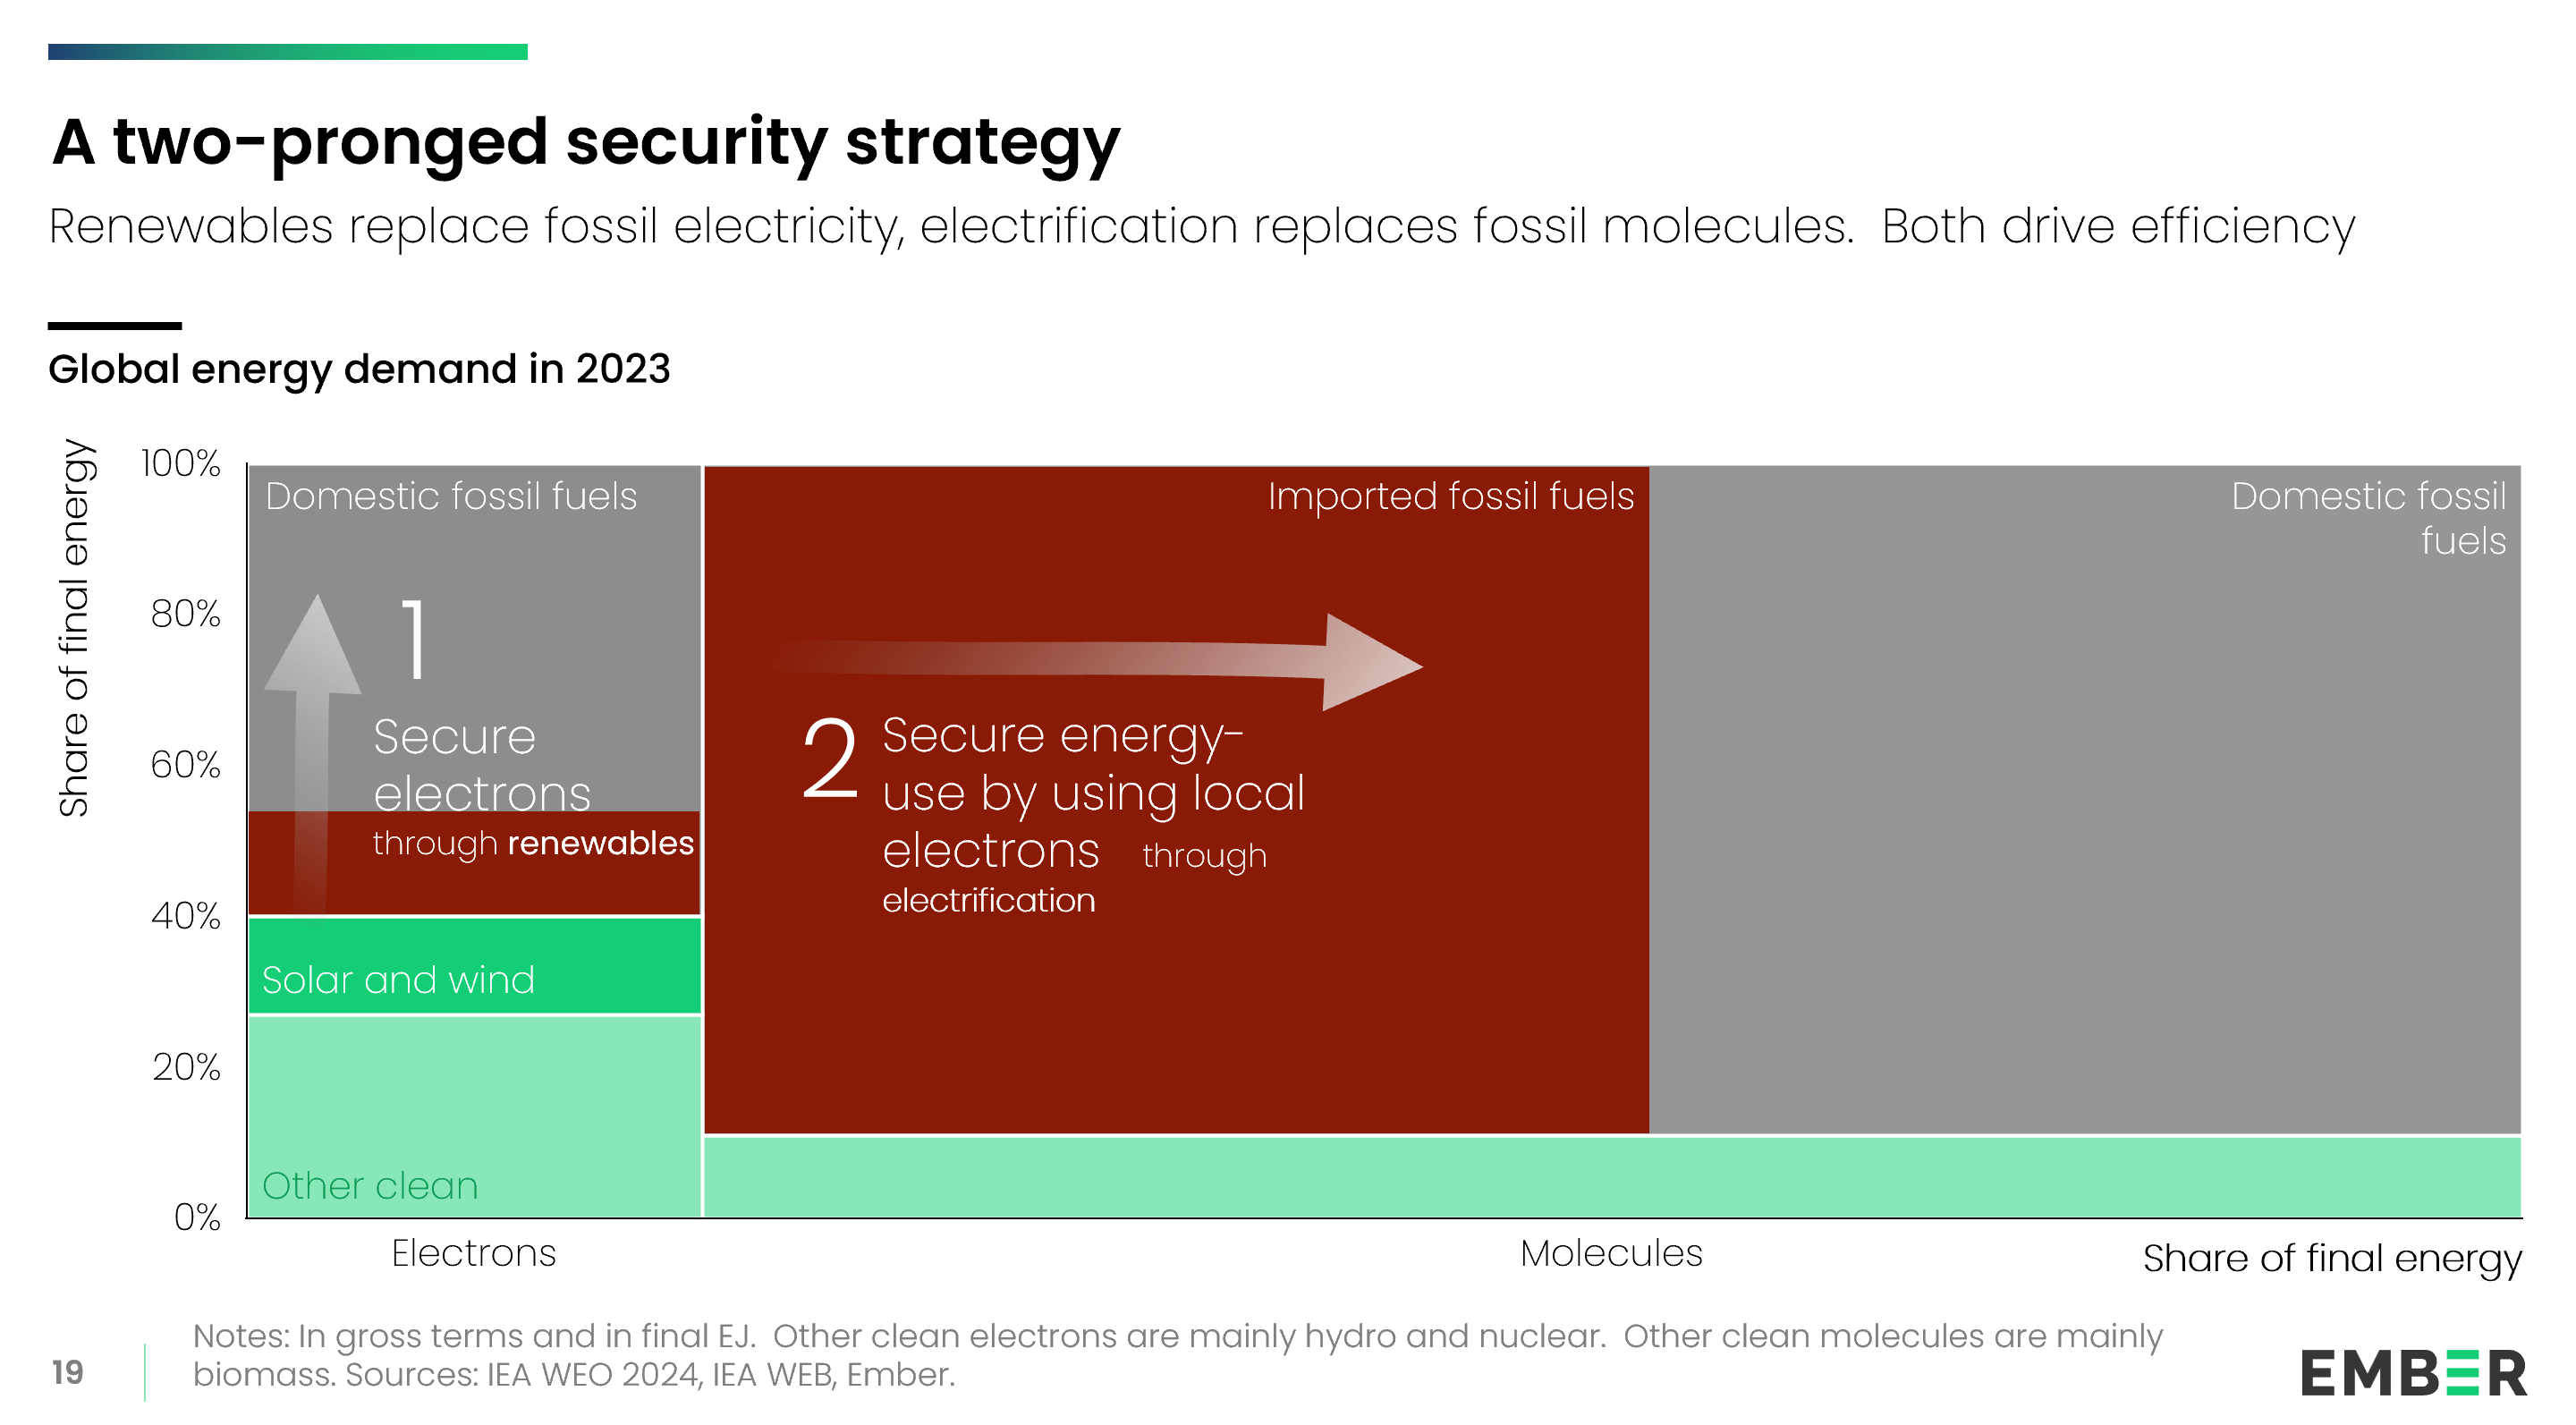
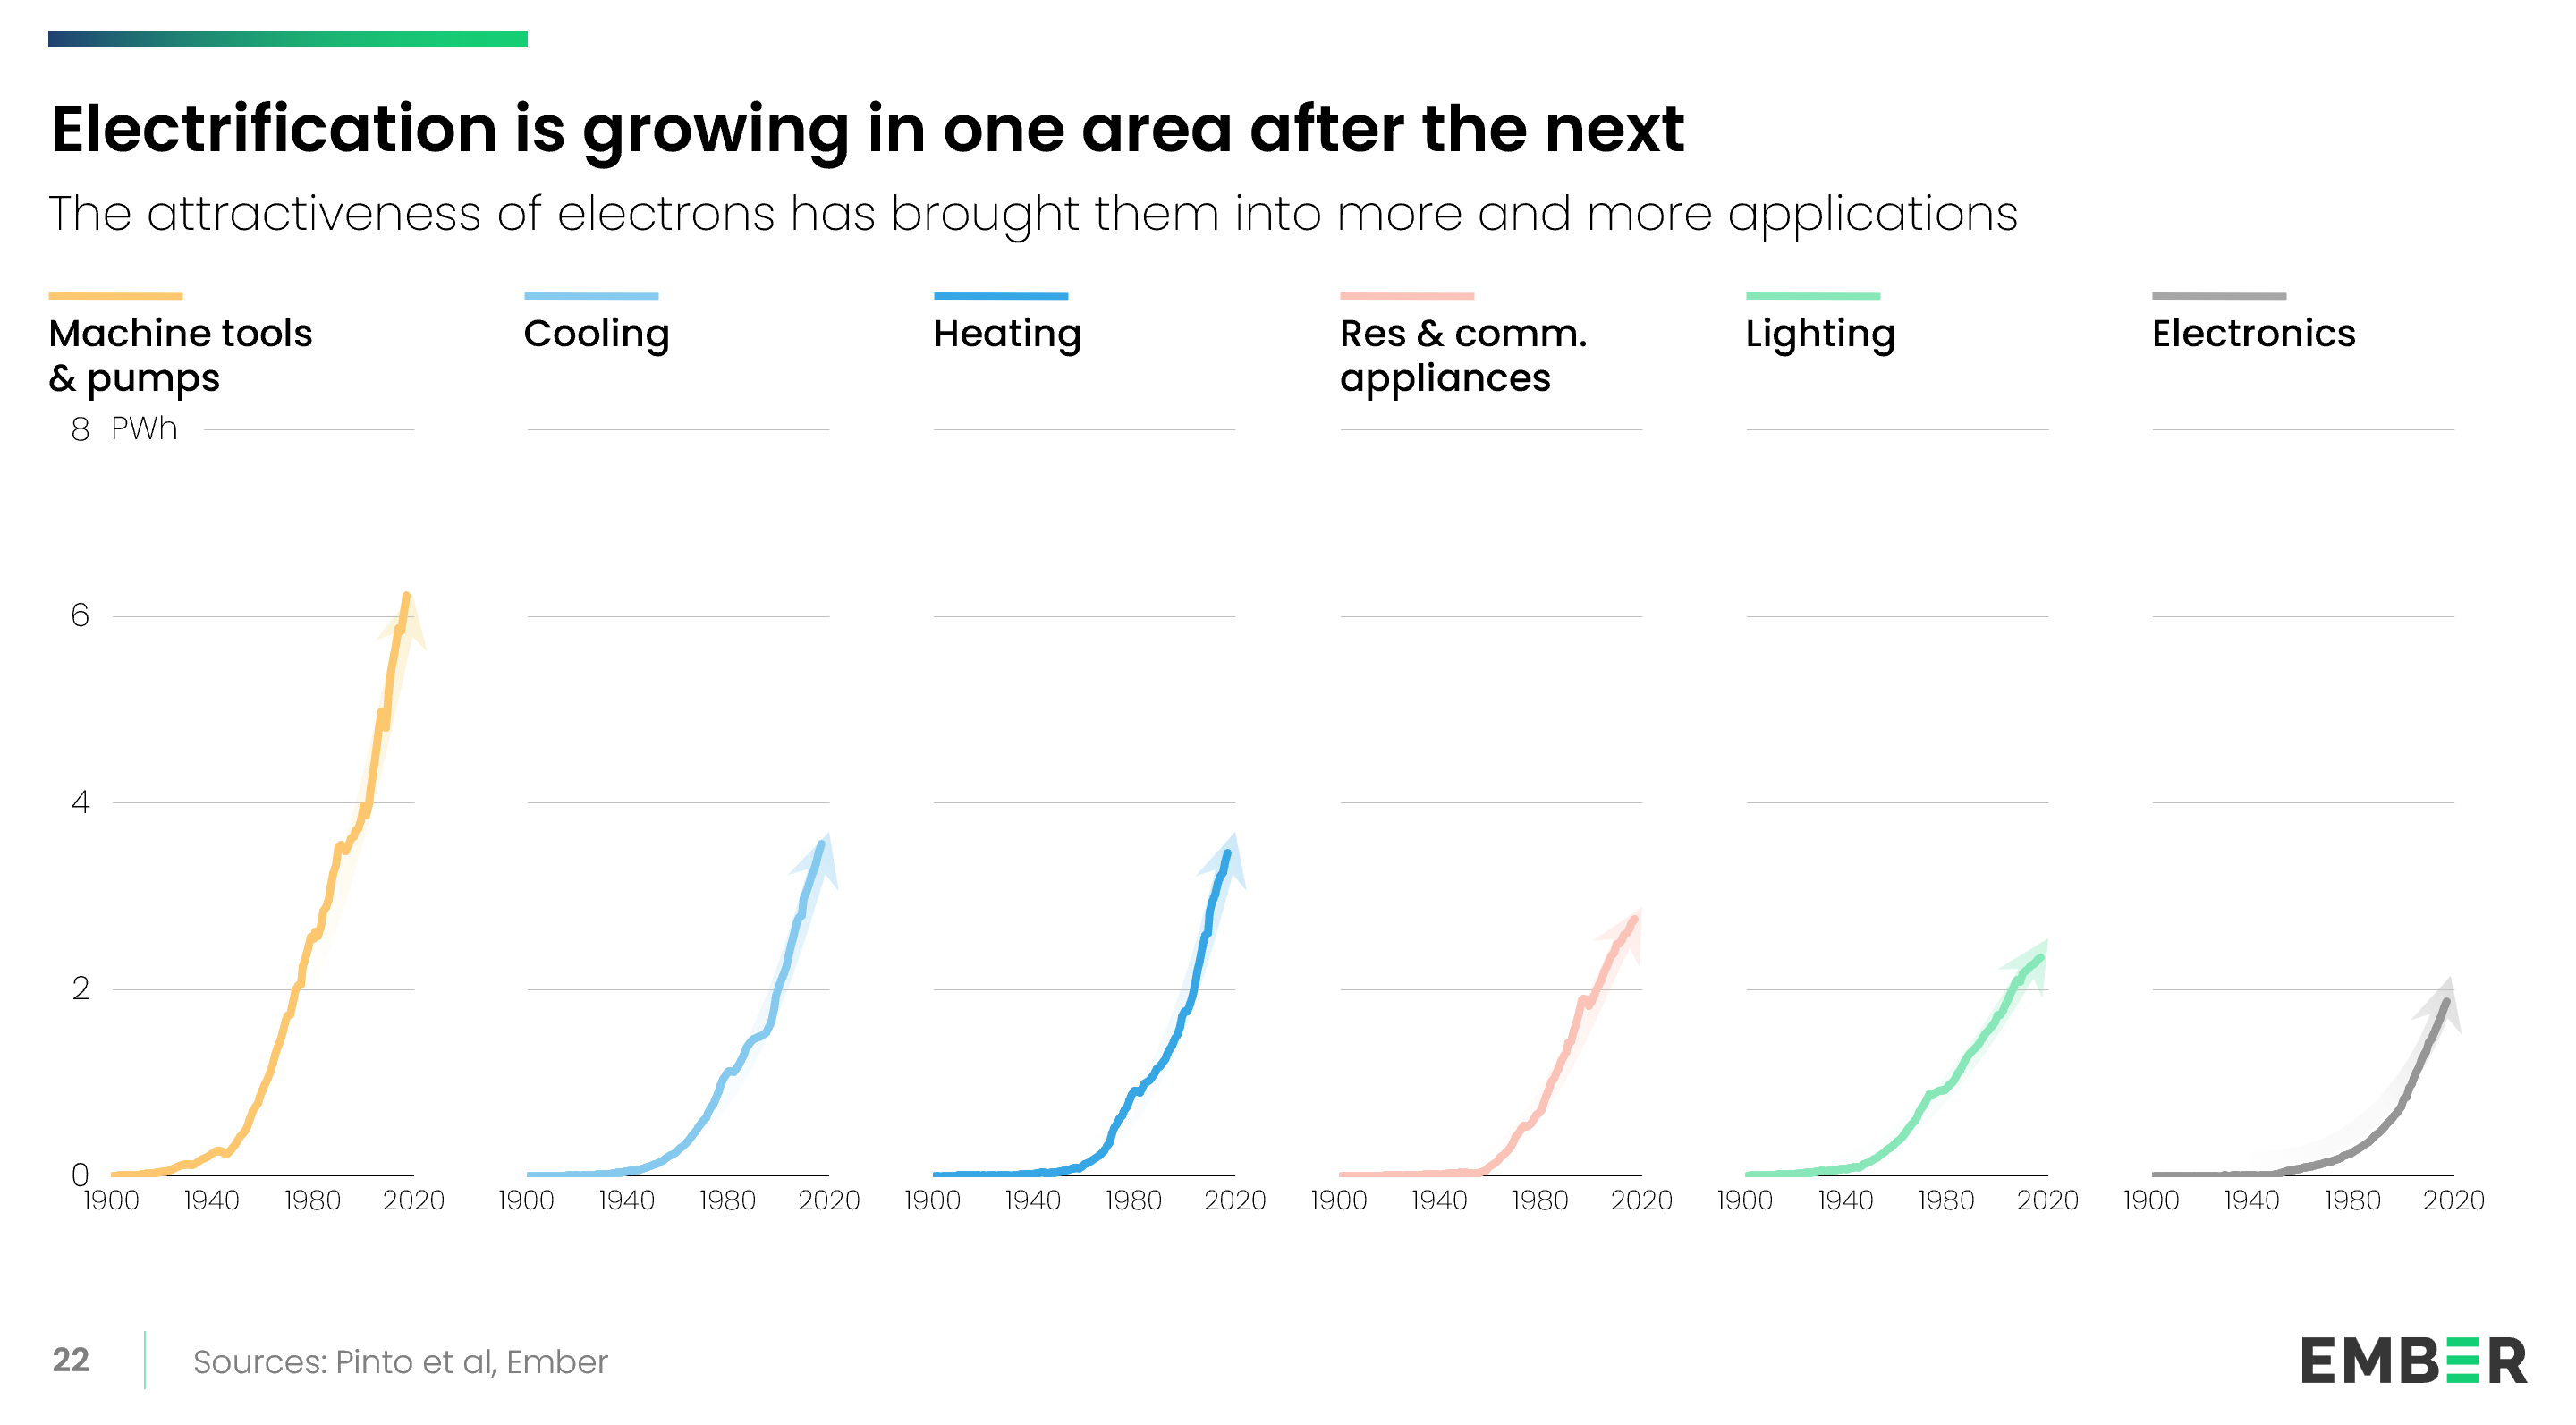
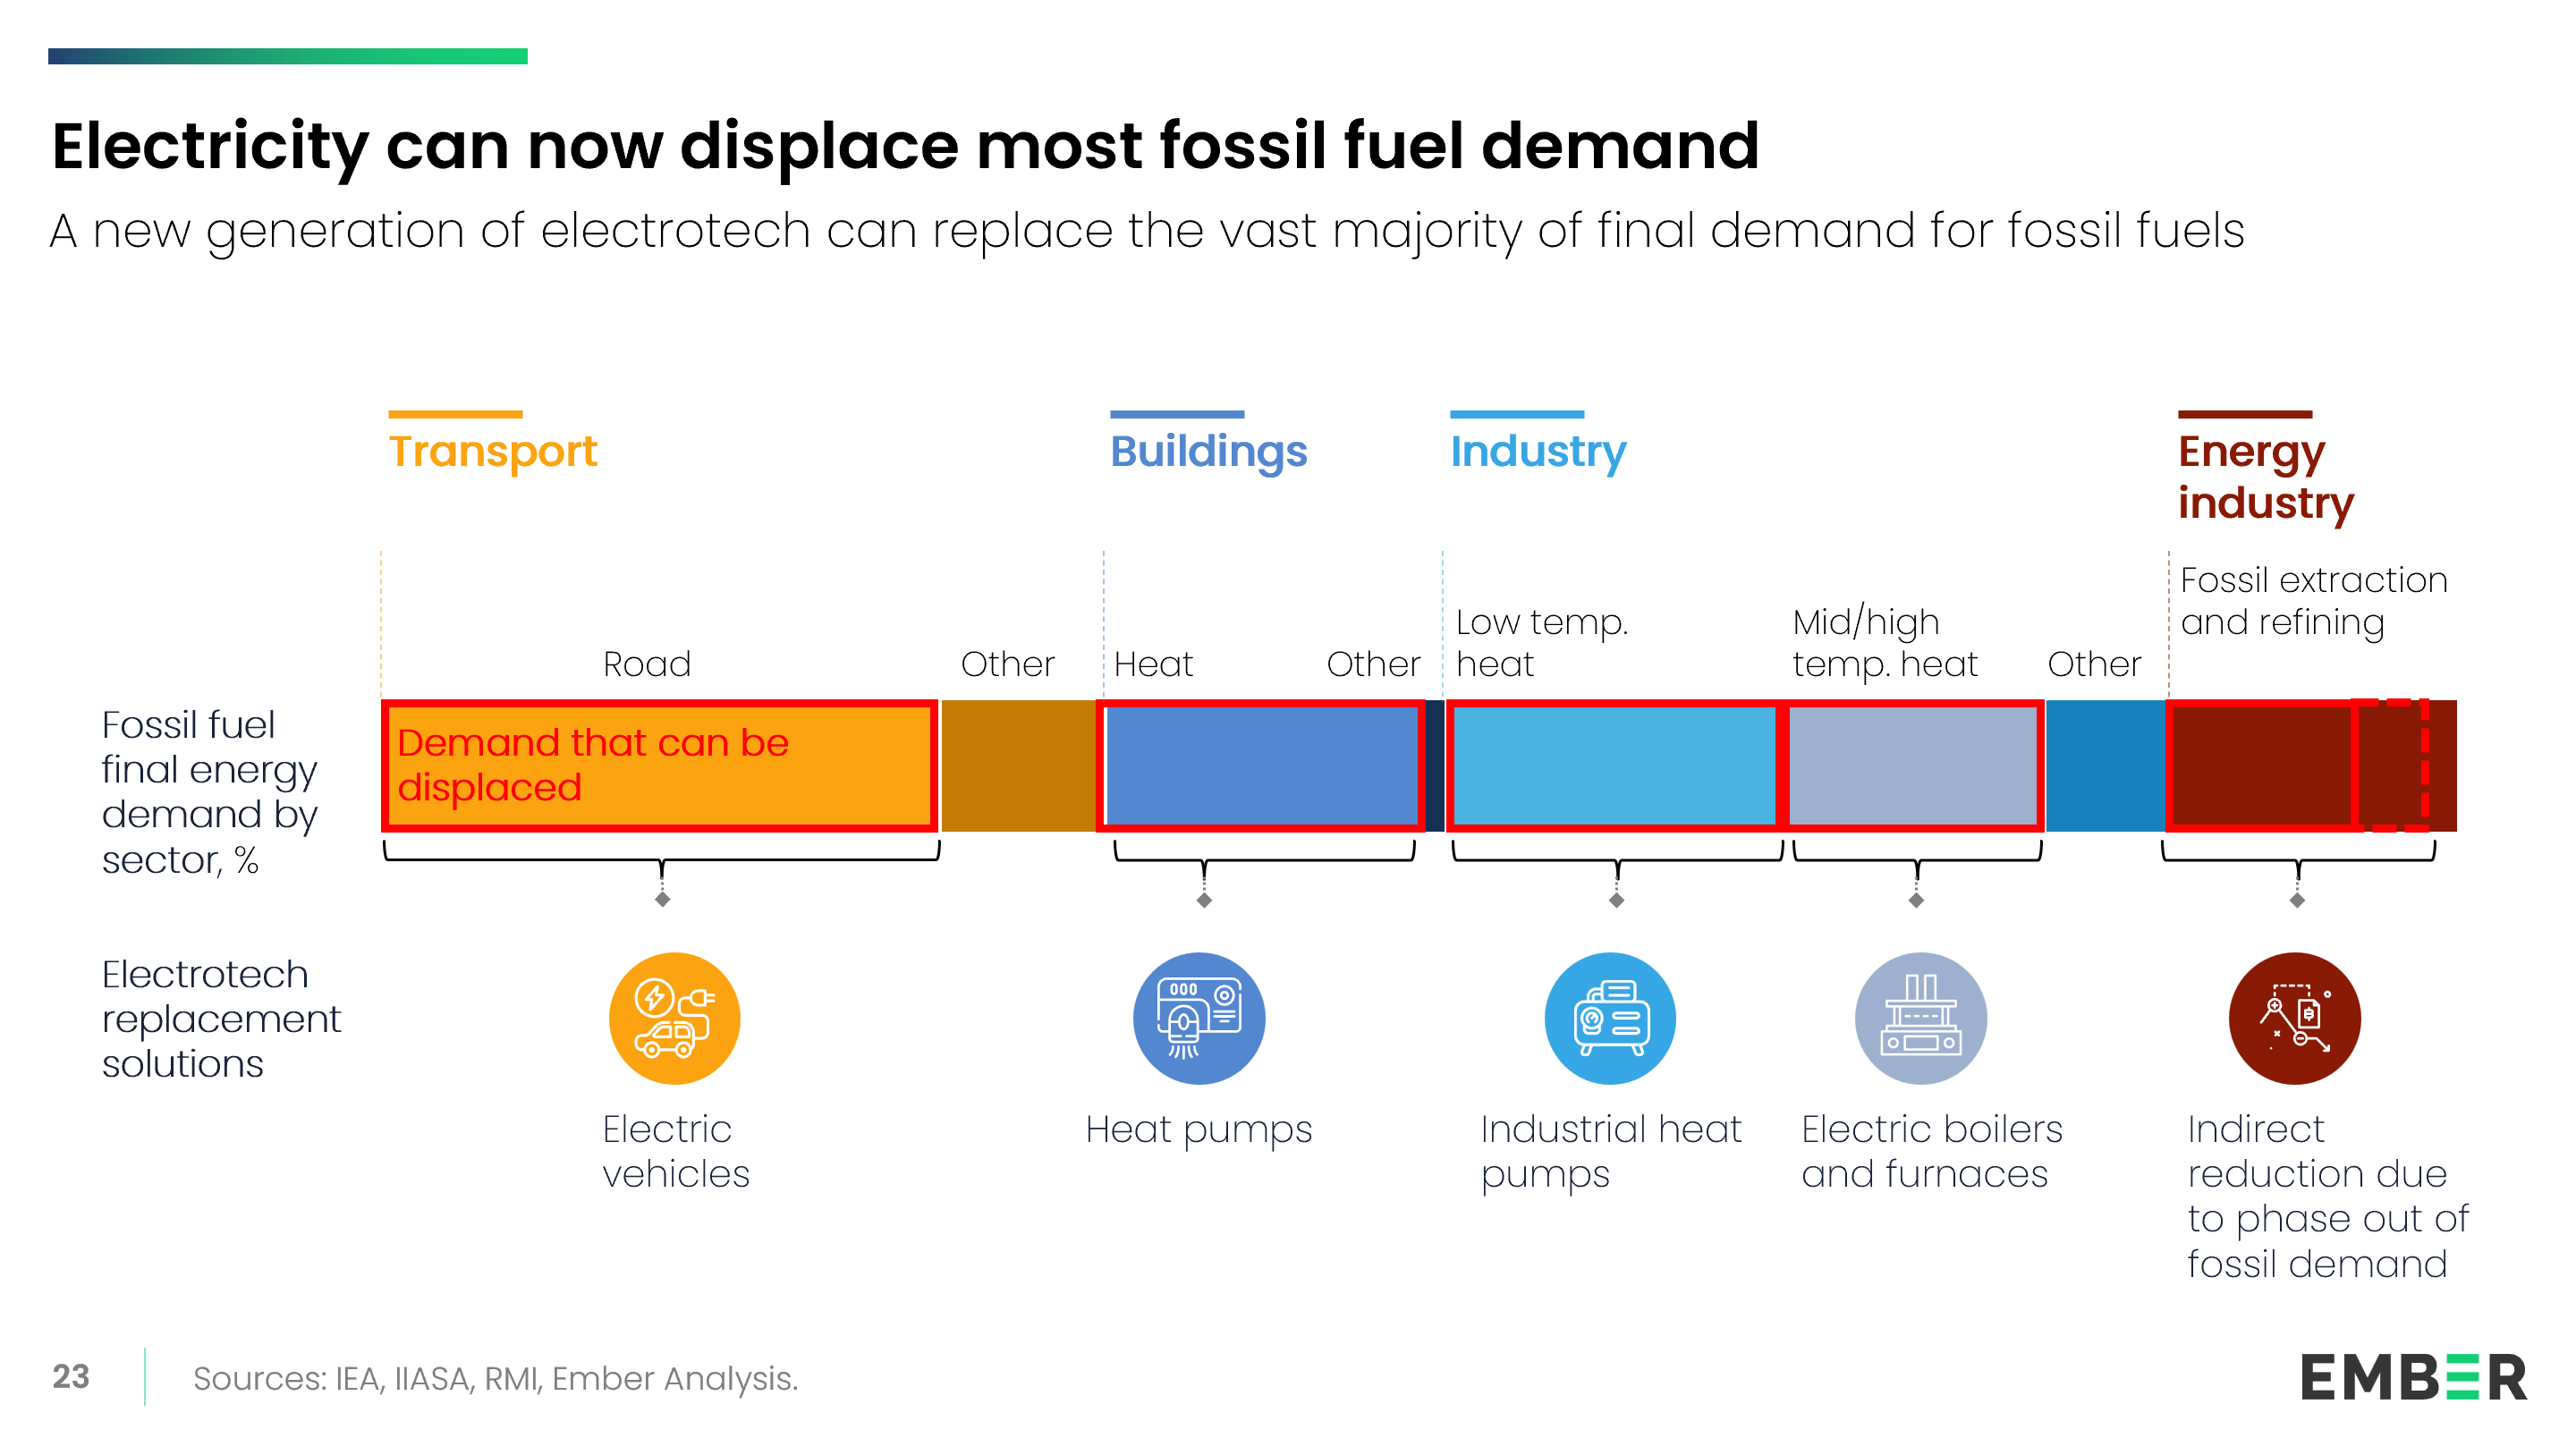
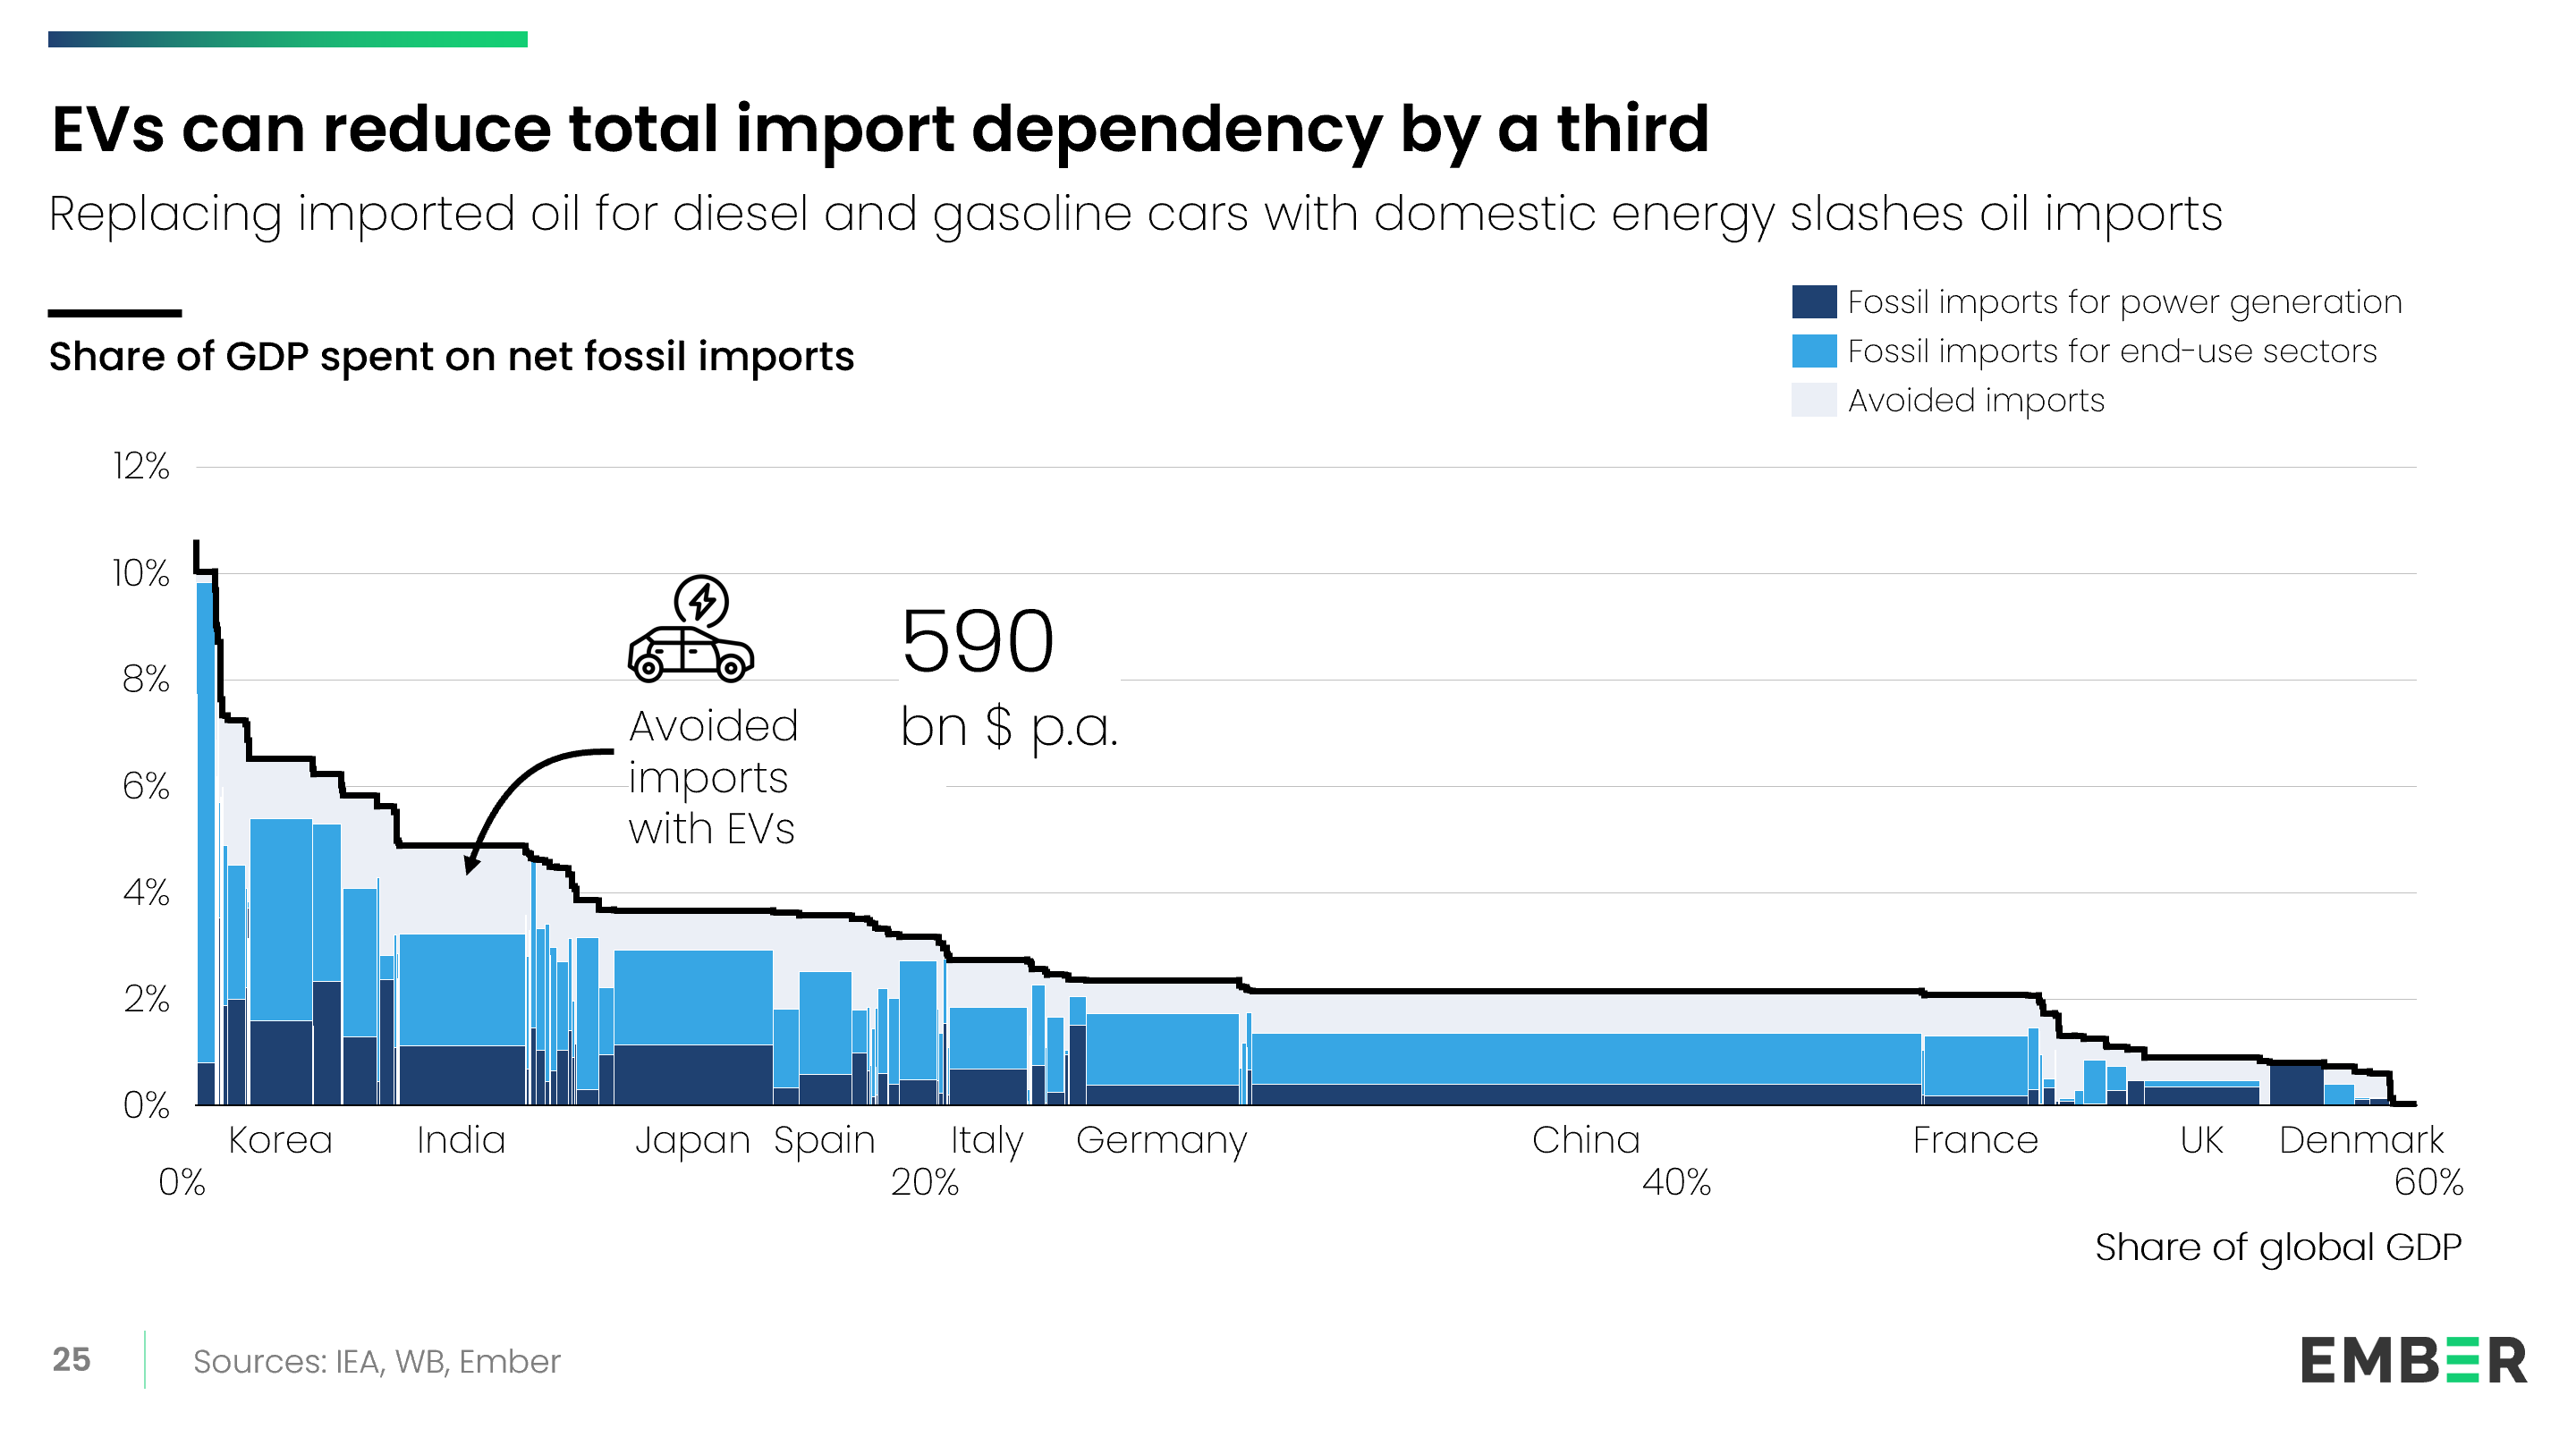
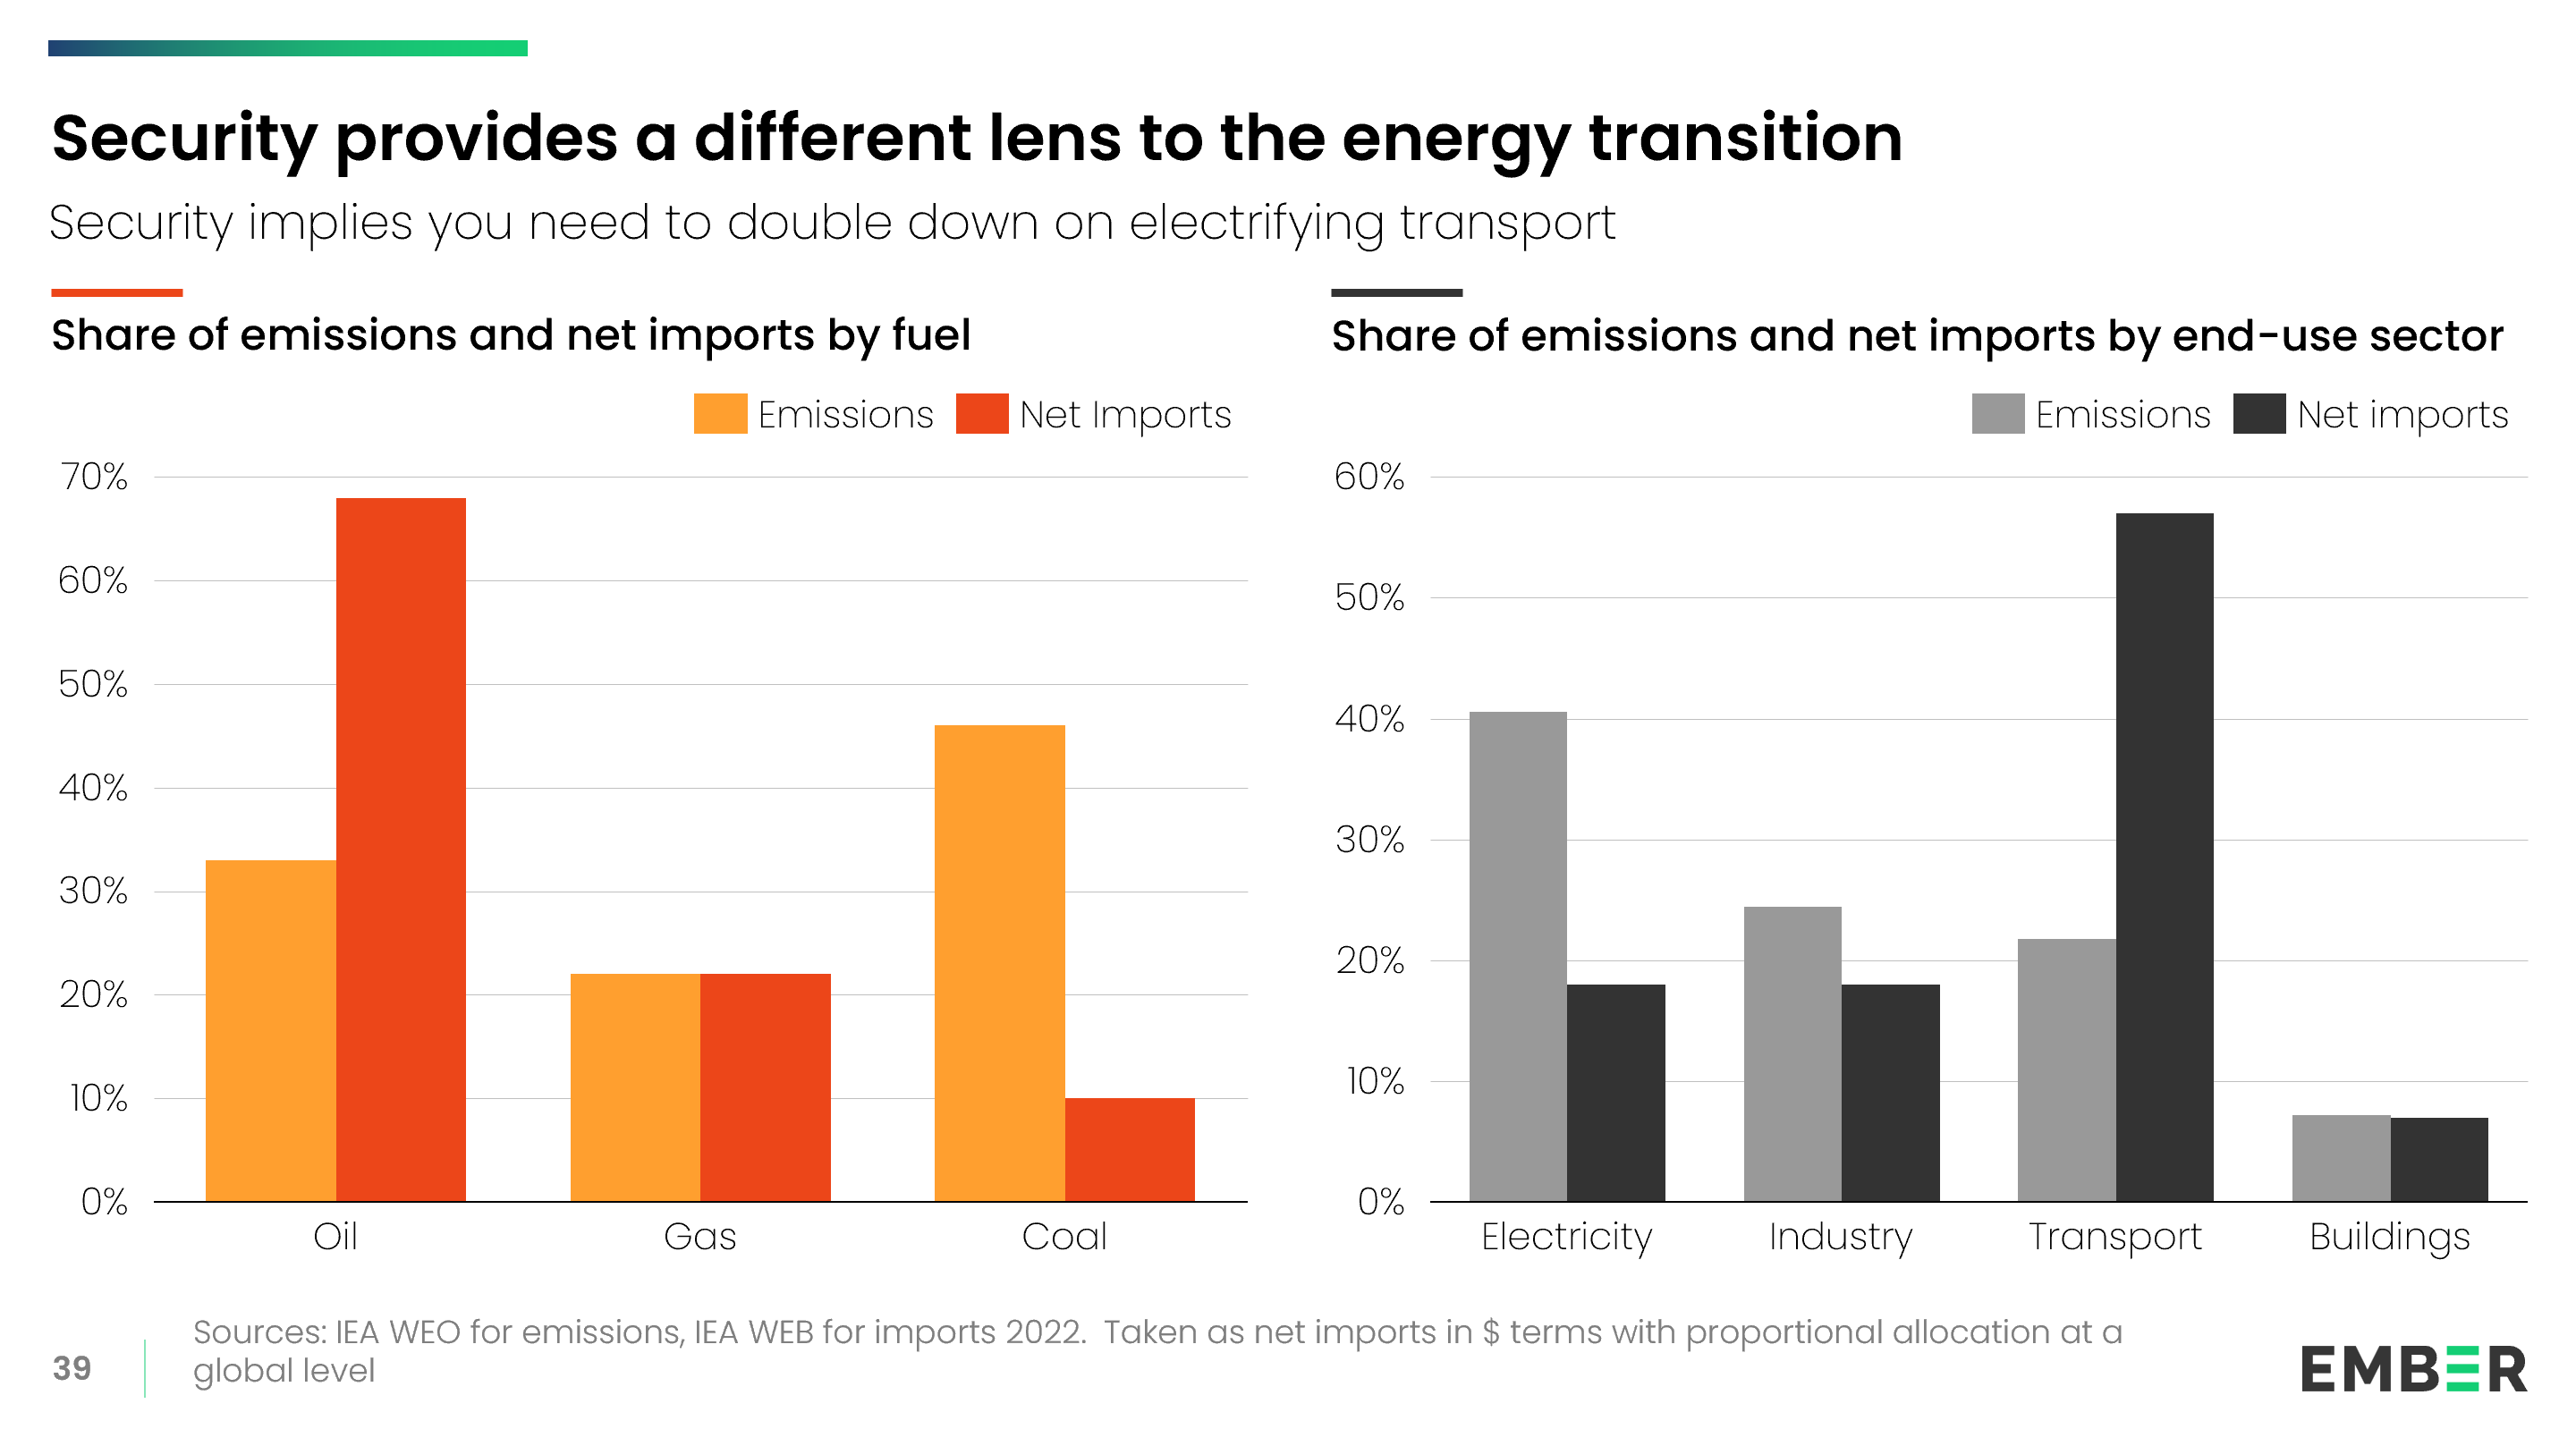
Electrotech can save 70% of imports

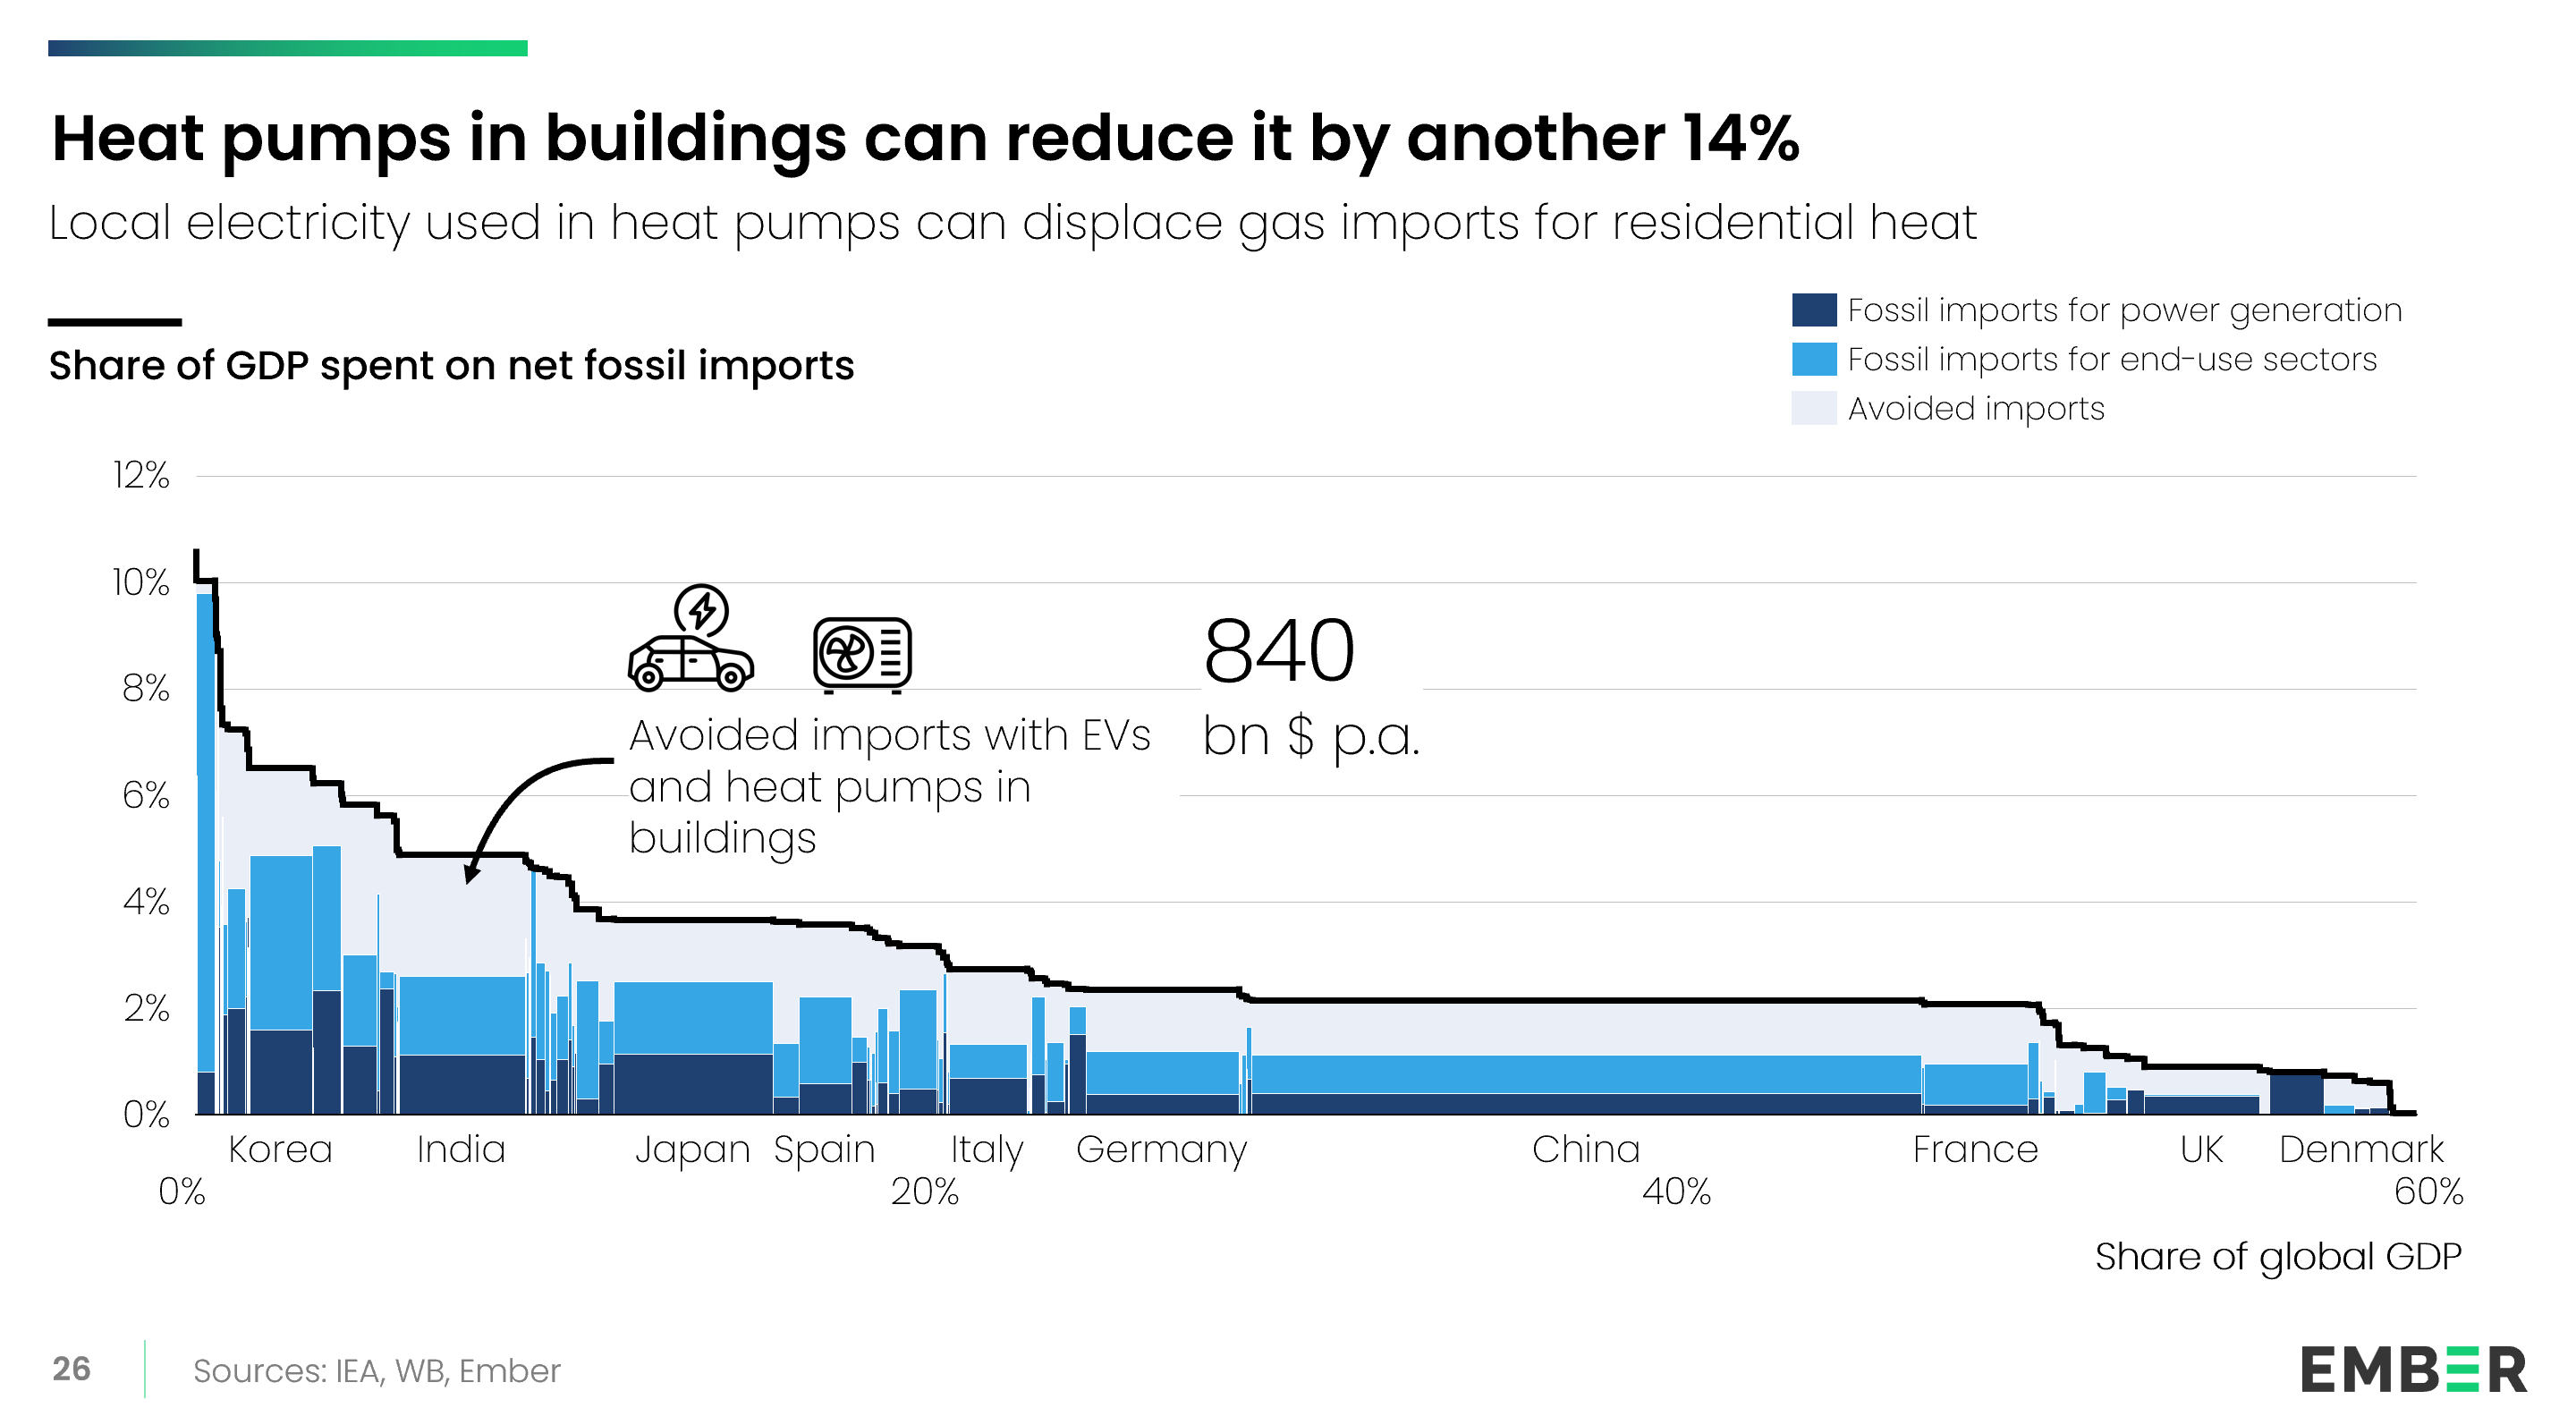
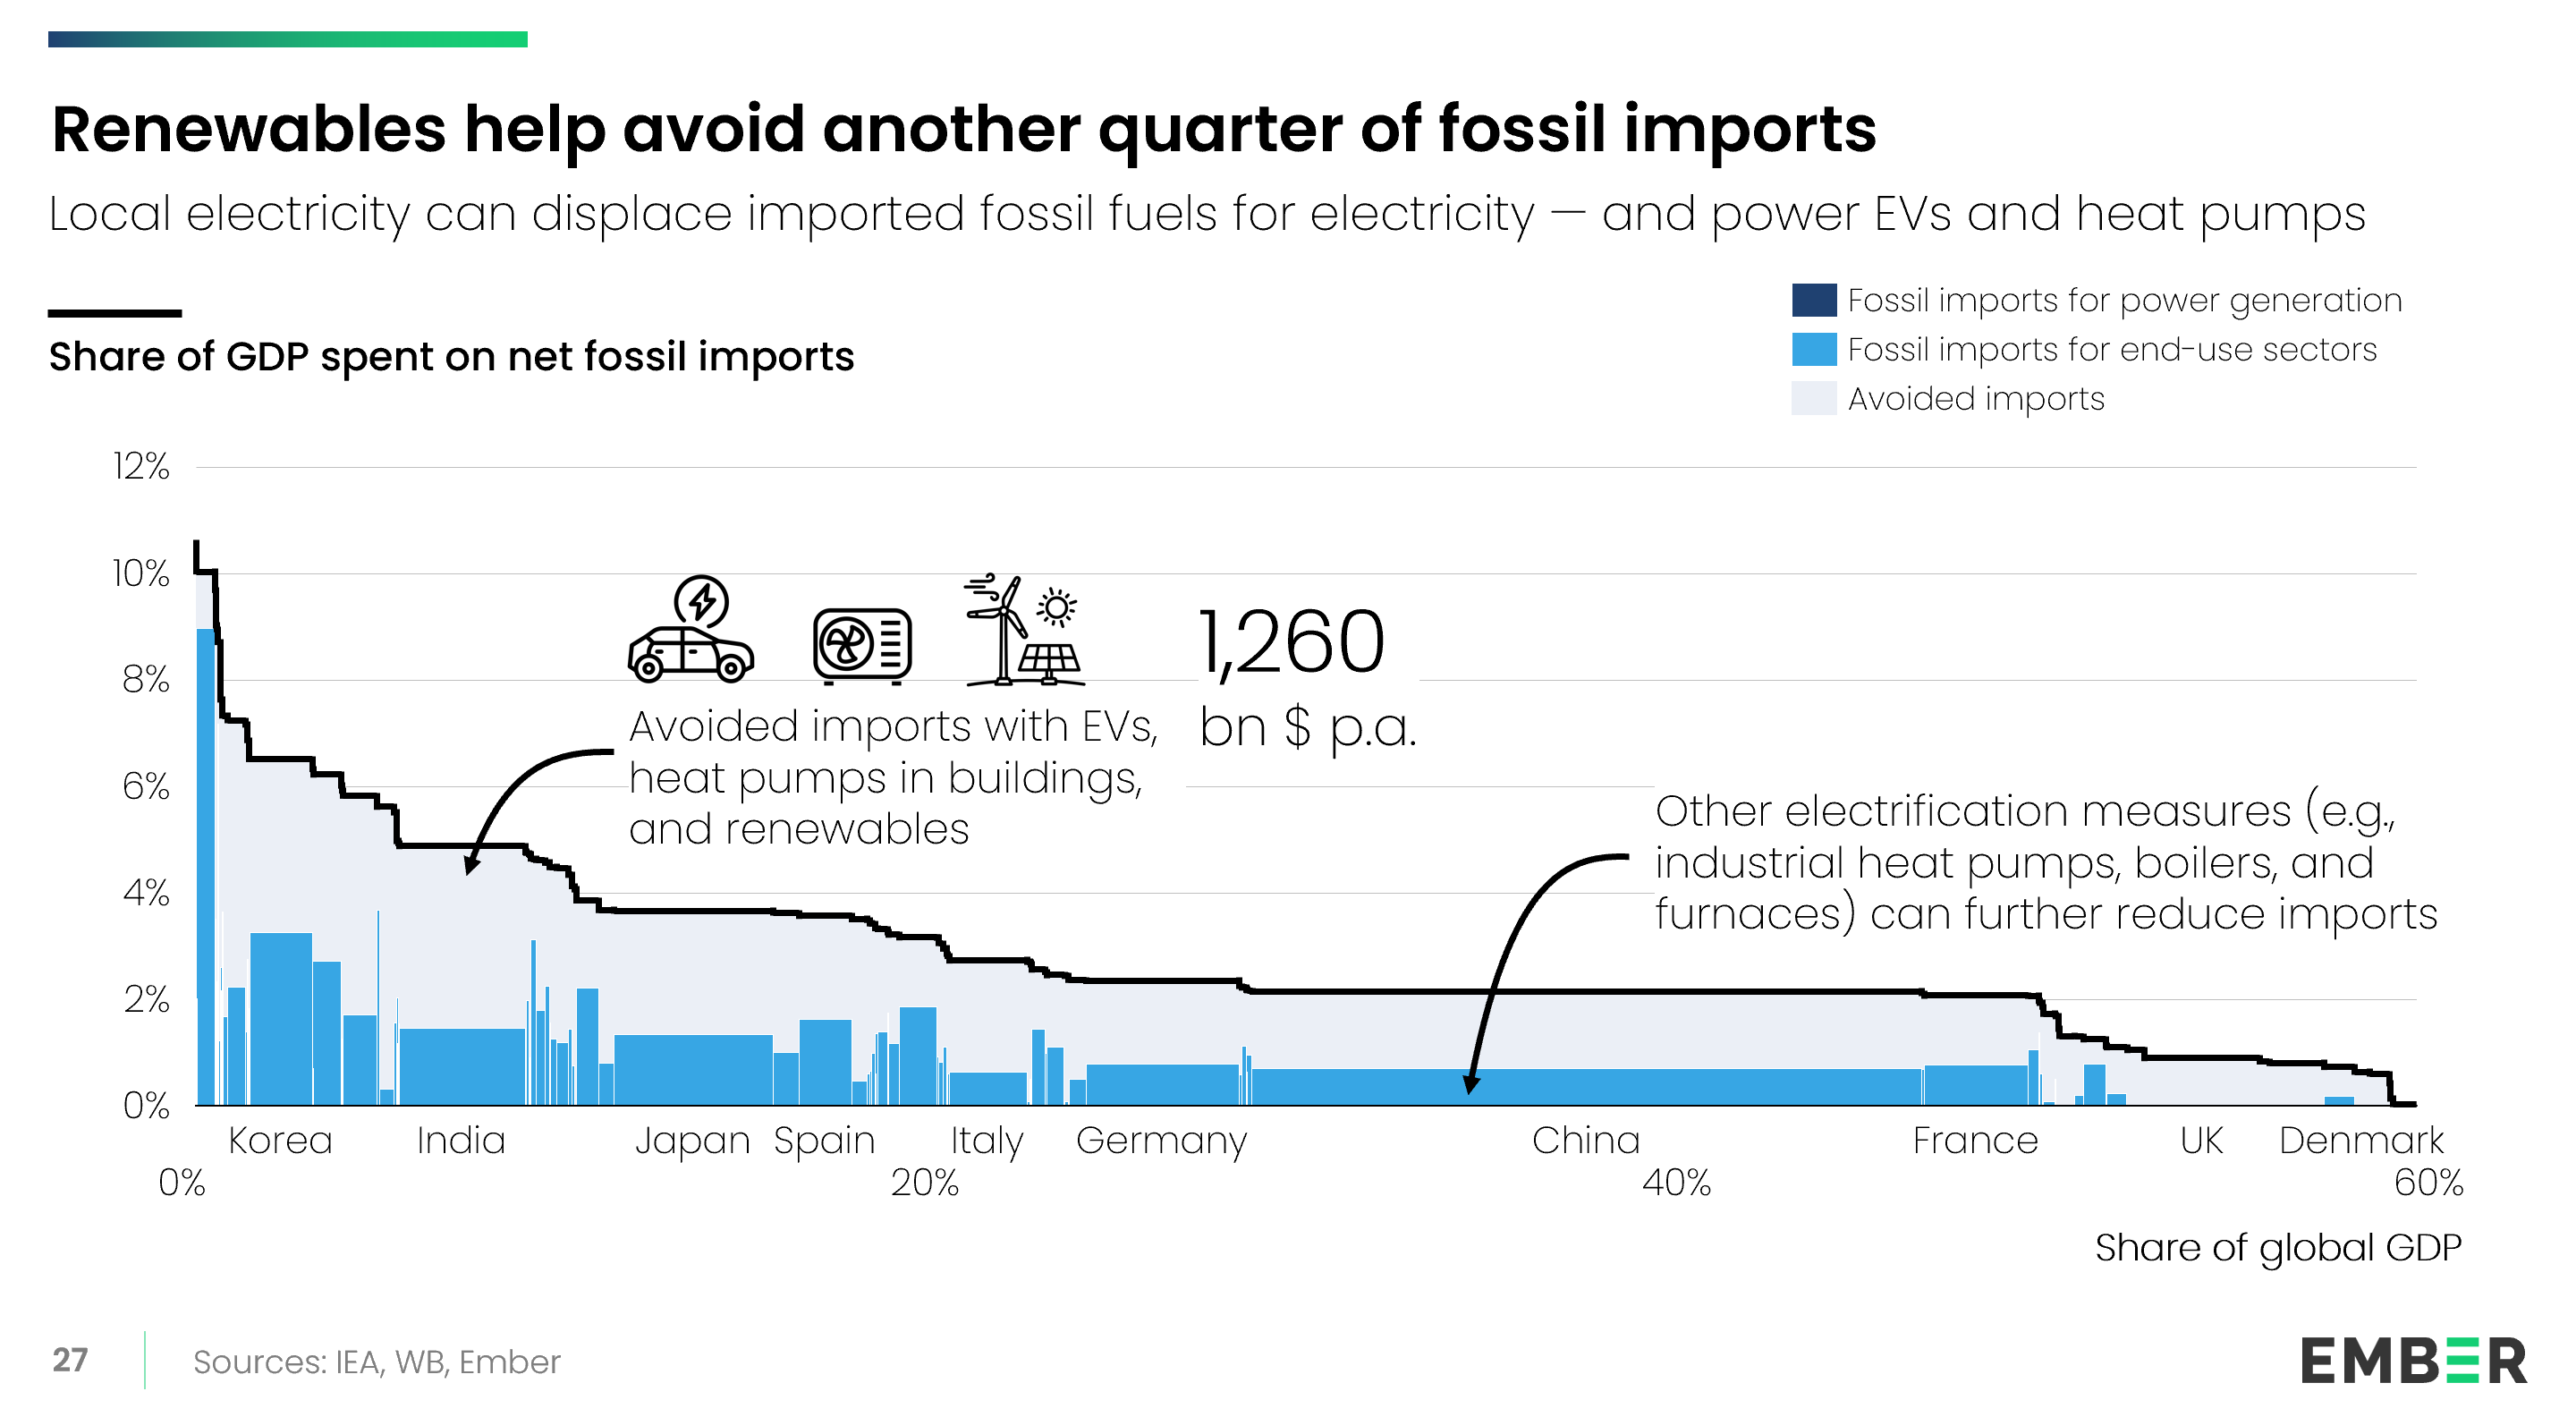
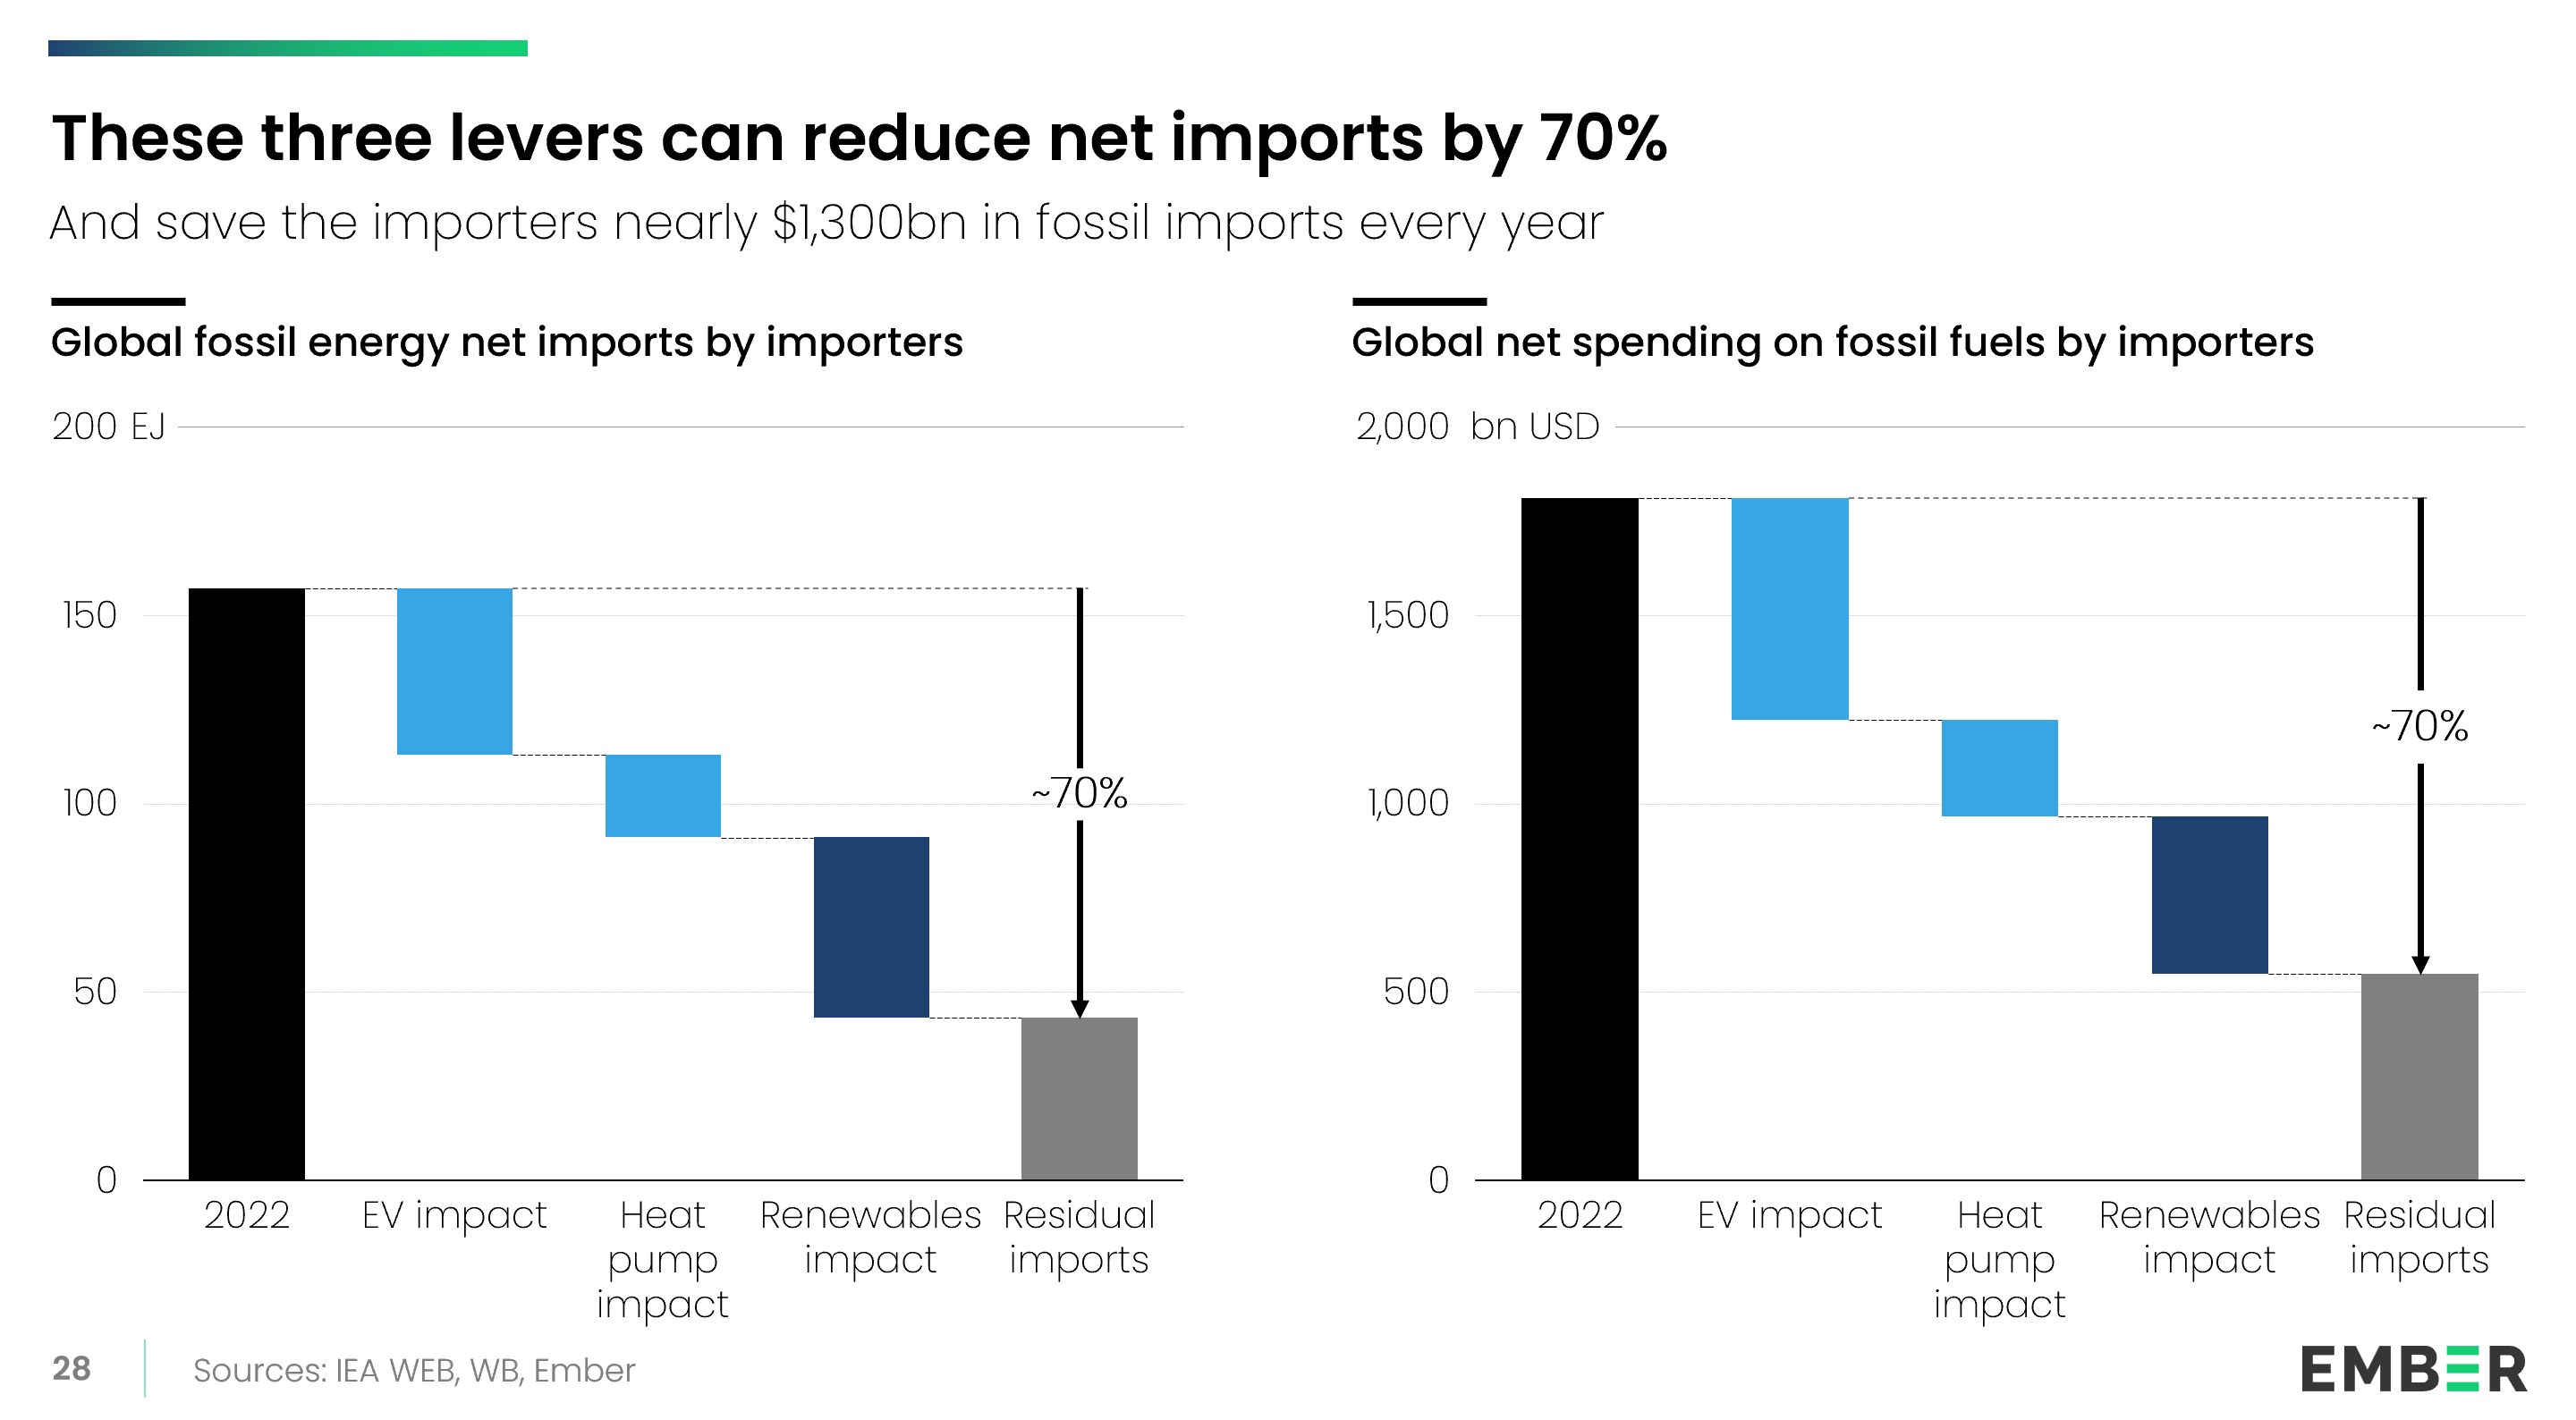
There is a new path to energy security: a two-pronged electrotech strategy: shifting electricity generation to renewables, and directing energy use to electricity. Replacing imported fossil fuels using three key levers—electric vehicles, heat pumps and renewables—can cut net fossil fuel imports by 70%, saving $1.3 trillion globally each year. The biggest impact comes from replacing all imported oil for road transport globally with EVs (33%). Scaling wind and solar to displace all imported fossil fuels in global power generation saves 23%. Heat pumps replacing all imported fossil fuels used for building heat worldwide add 14%. Together, they unlock a faster, cheaper route to energy independence.

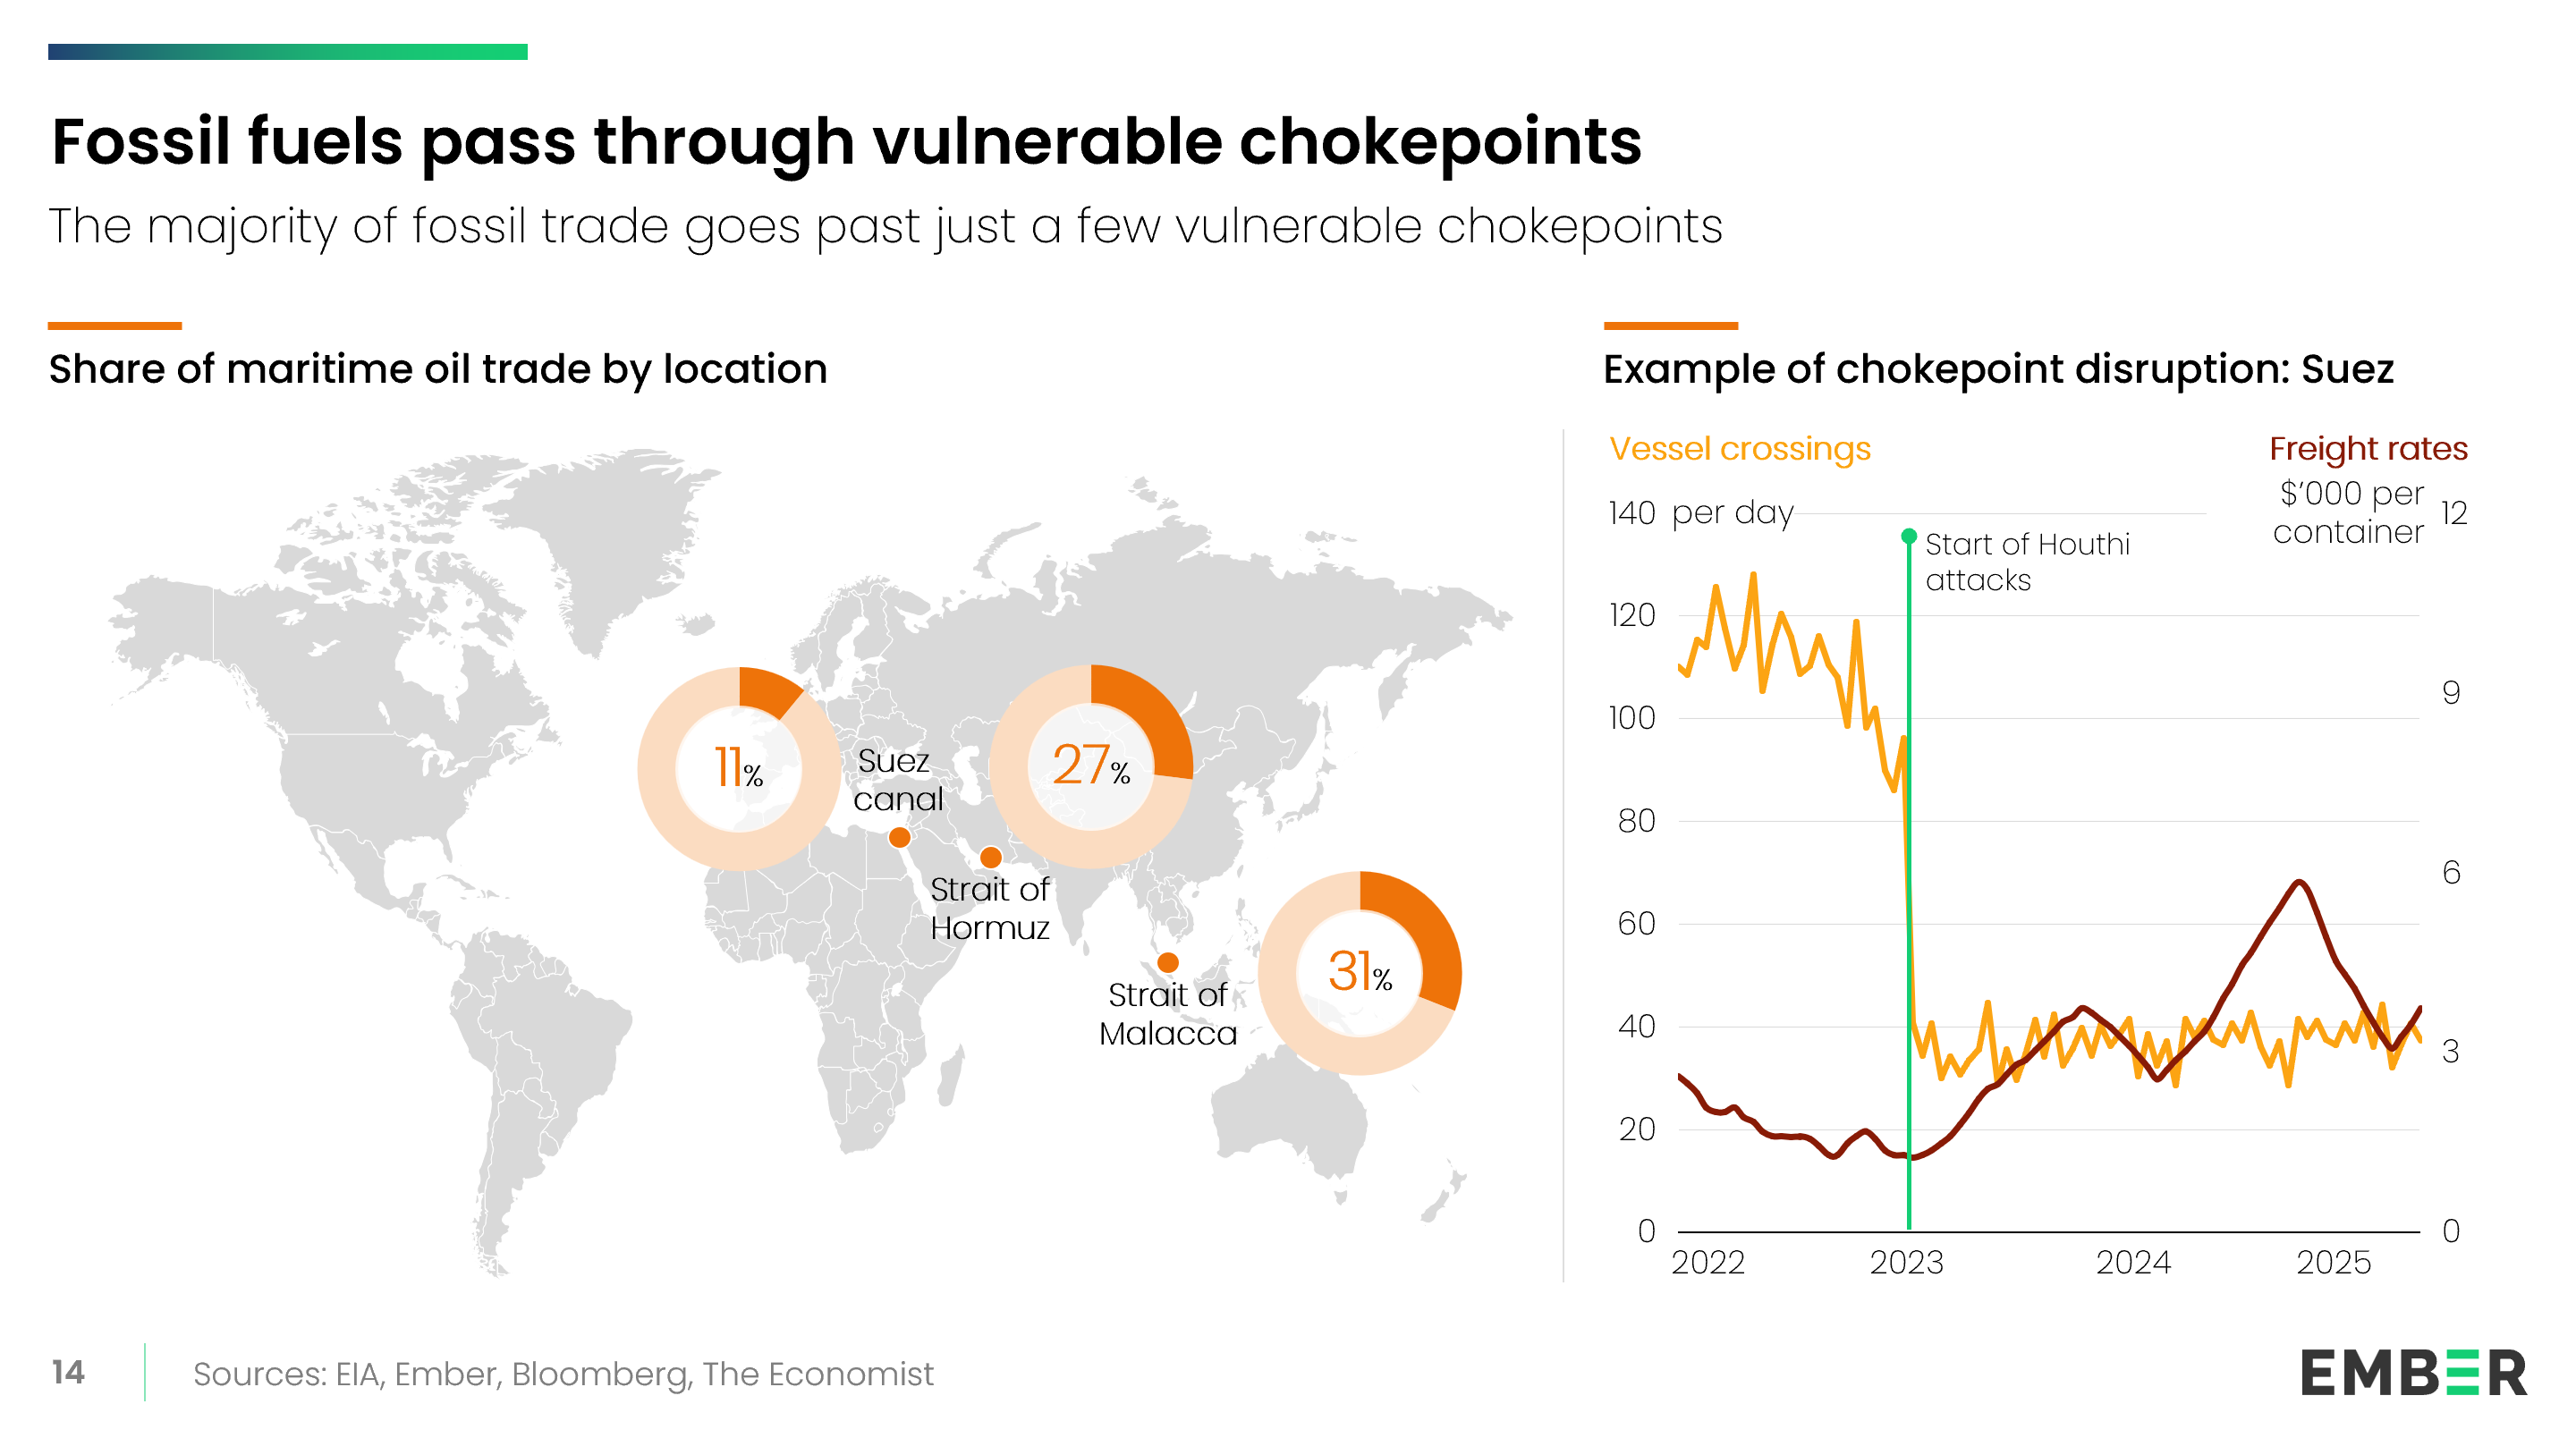
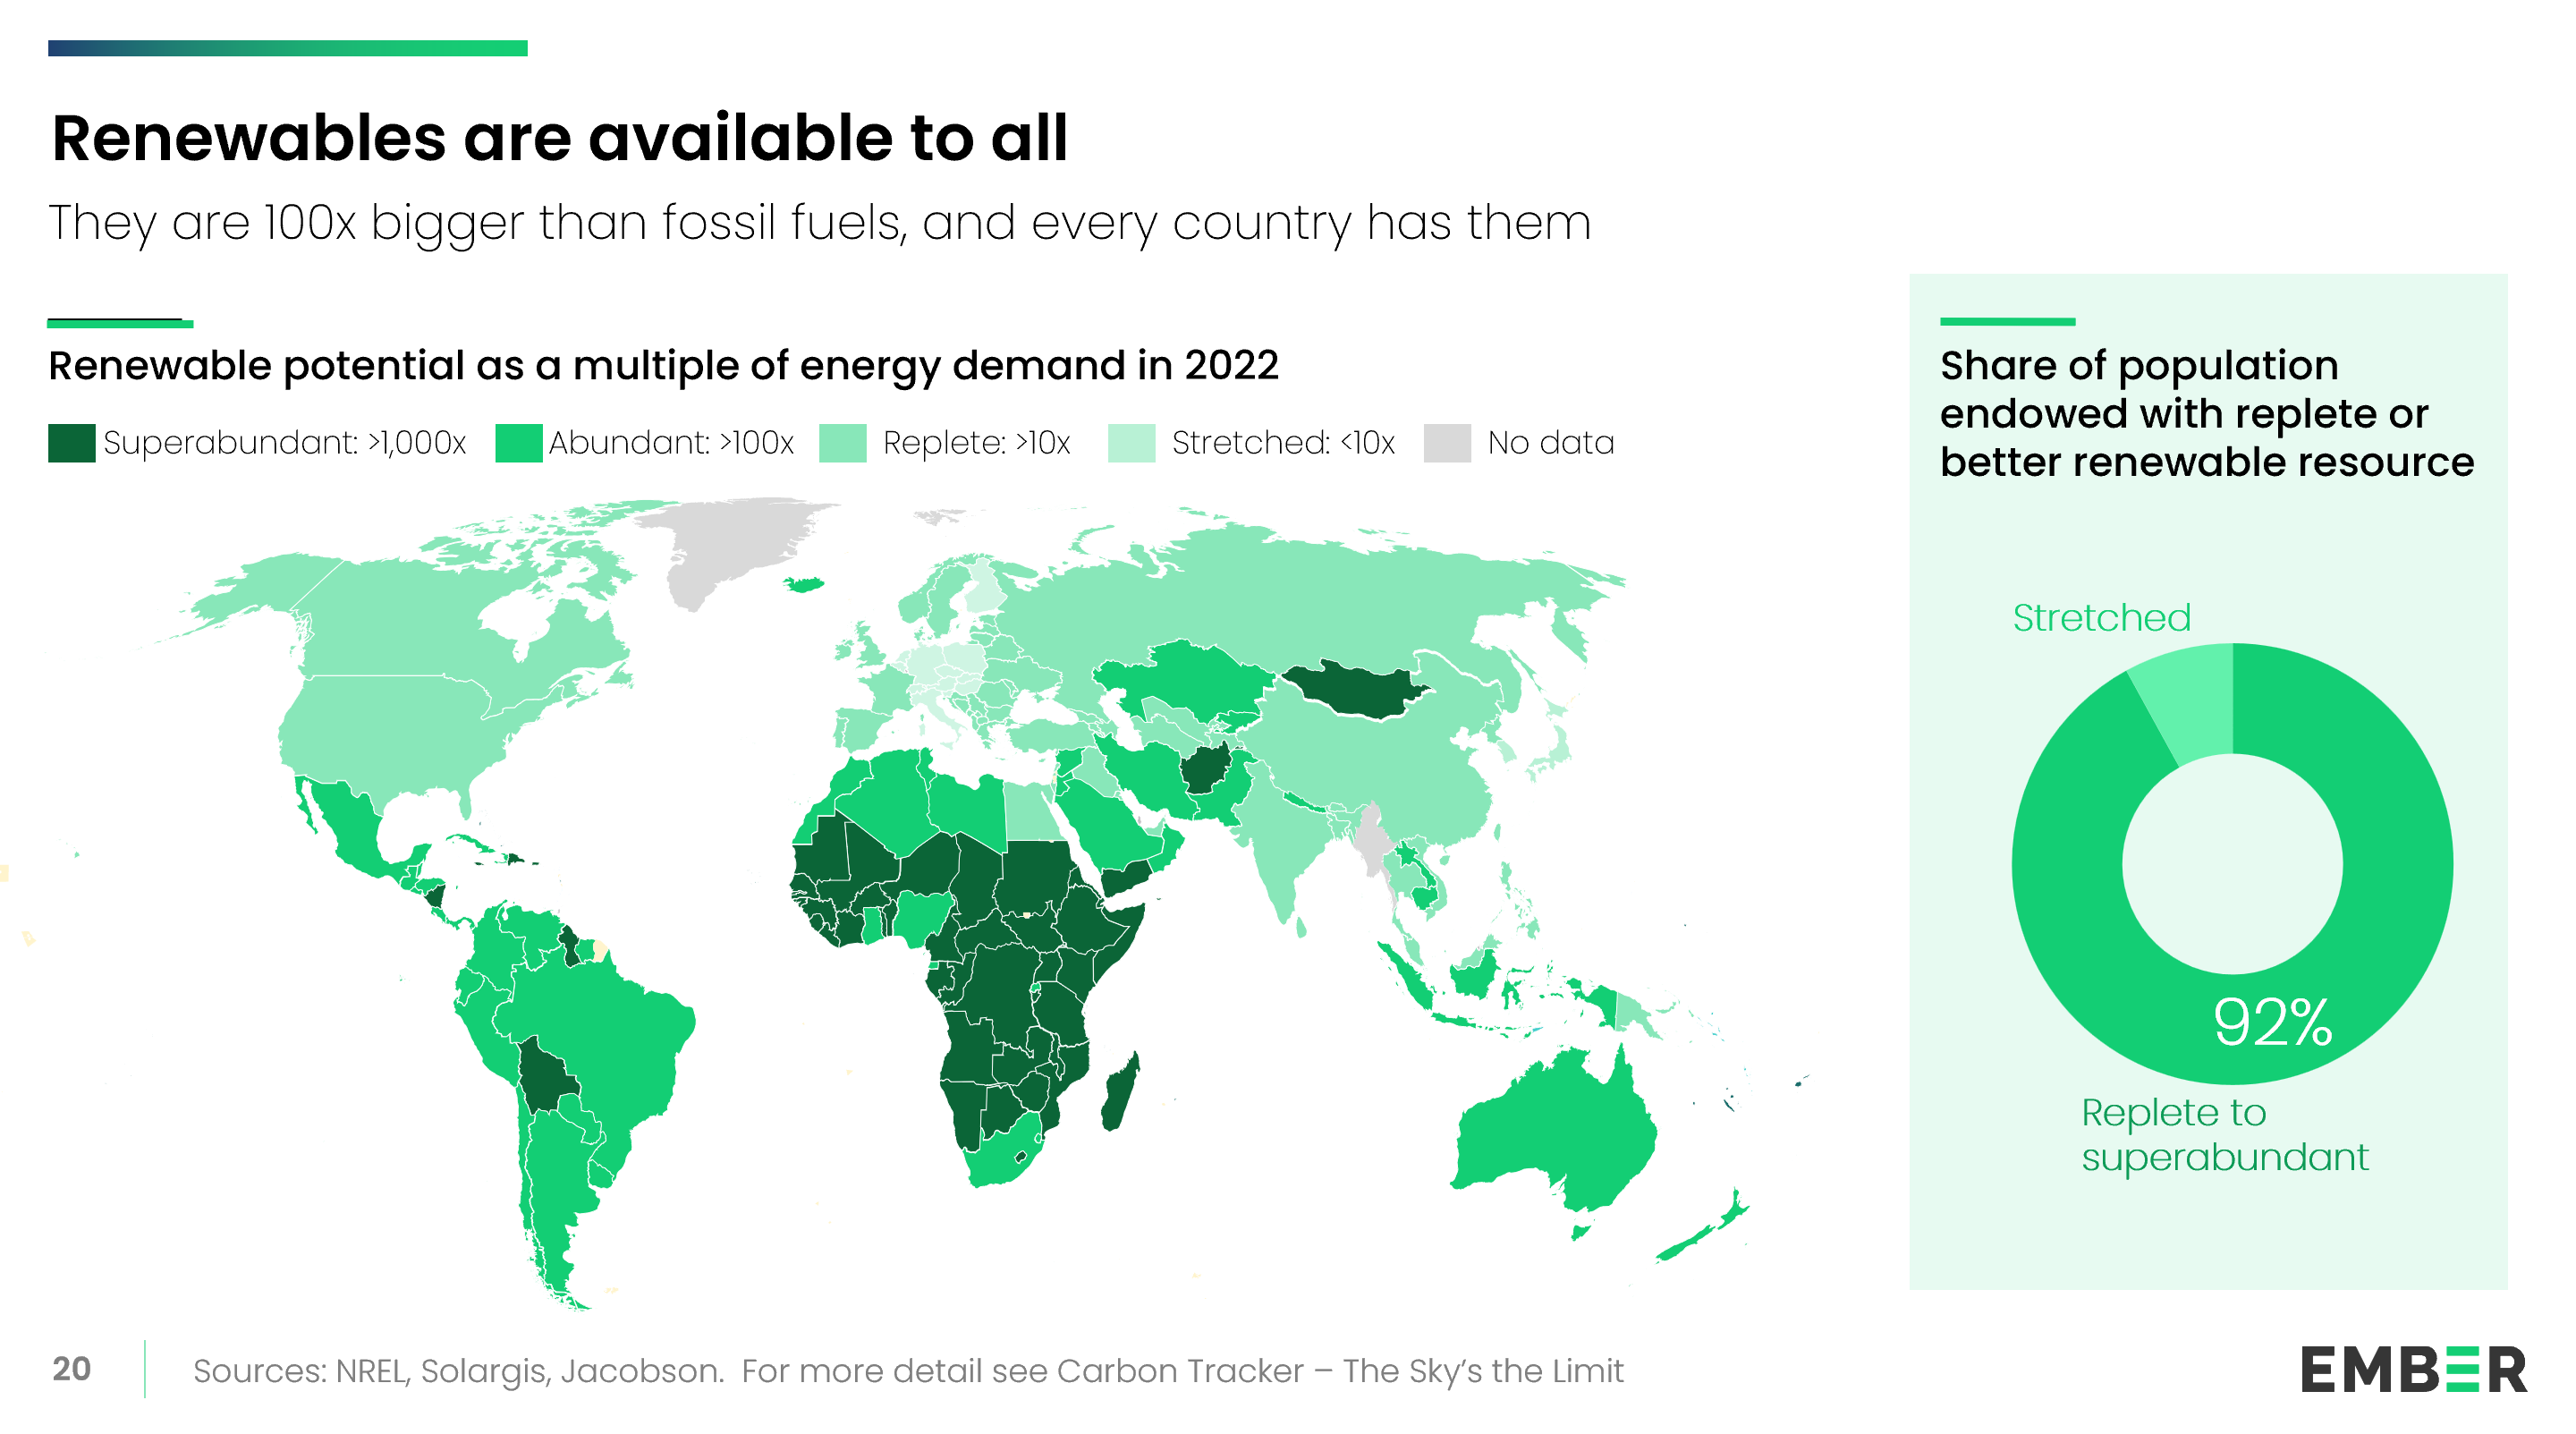
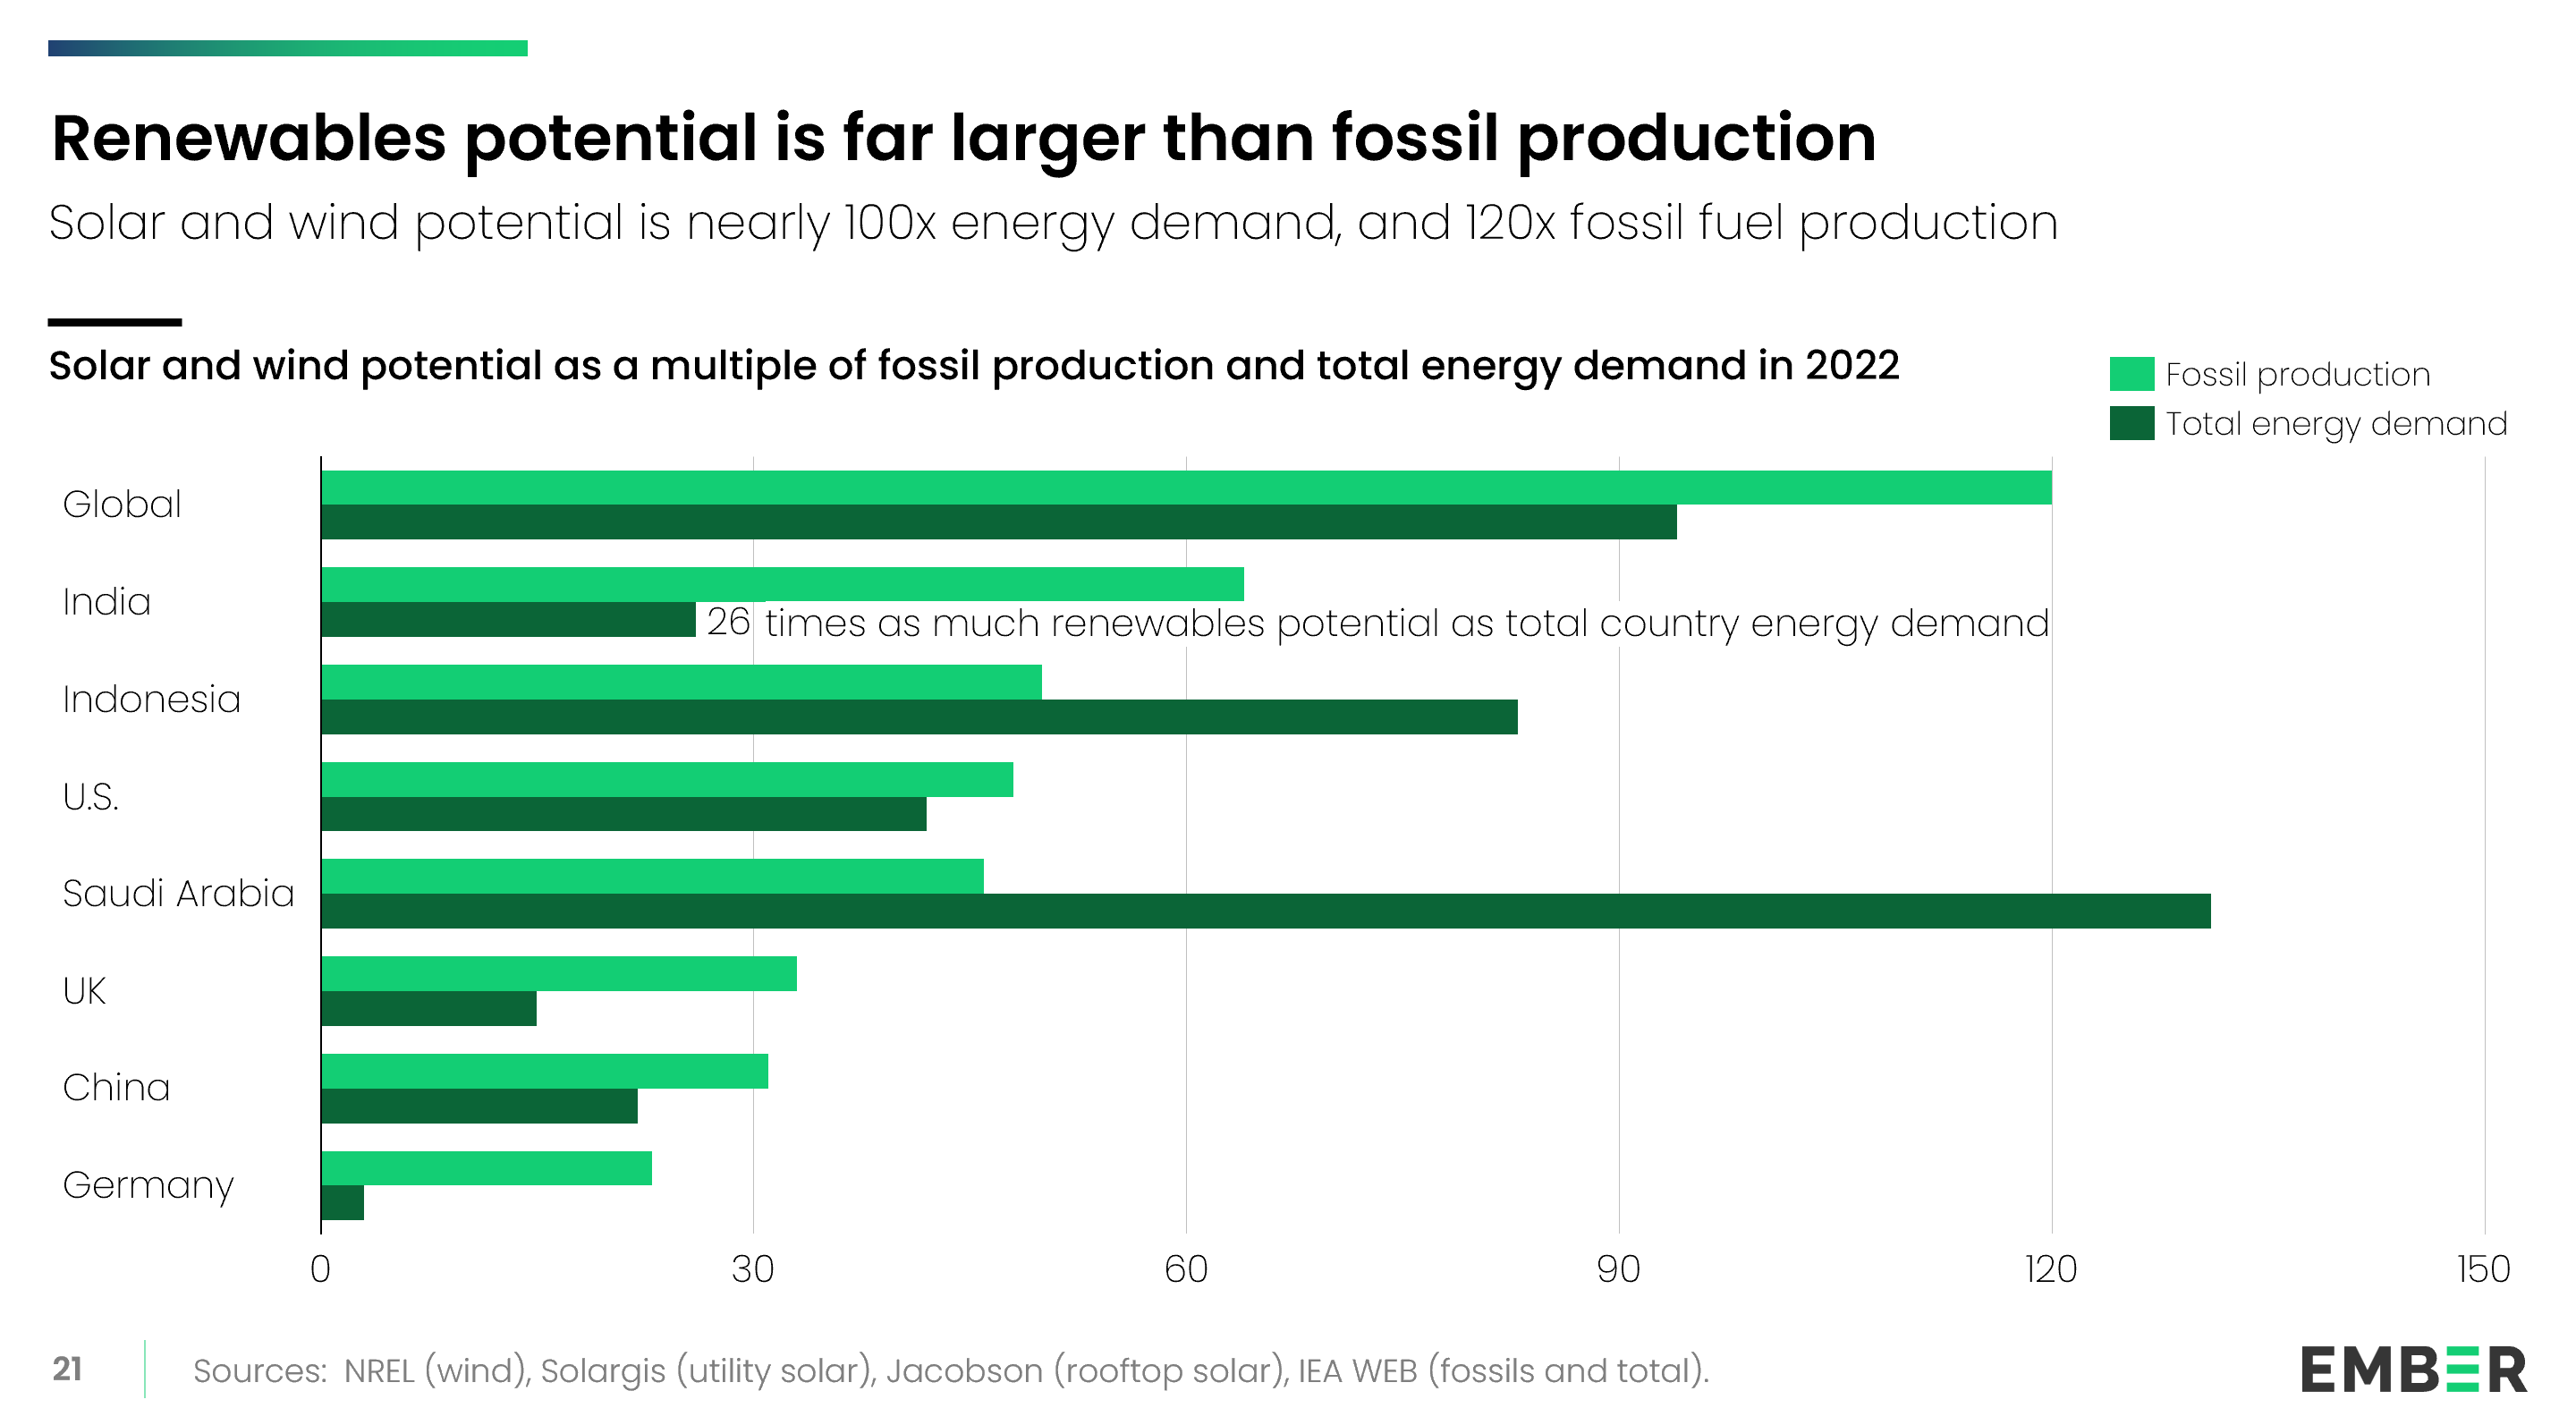
The electrotech opportunity is open to any country. Where fossil fuels are geographically concentrated, renewables are widely available and abundant. 92% of the world’s population has the potential to meet more than ten times their energy demand with renewables. Global solar and wind potential is nearly 100 times the world’s current energy demand, and 120 times total fossil fuel production.

Fossil-importing nations are like frogs in boiling water, failing to detect the gradually increasing danger. Import dependency has been rising for decades, and now Donald Trump has turned up the heat to a boil. Electrotech offers the fastest escape route from this escalating threat.

This analysis has been prepared in a slide deck format, which is shown below. For optimal viewing, kindly refer to the downloadable PDF here.

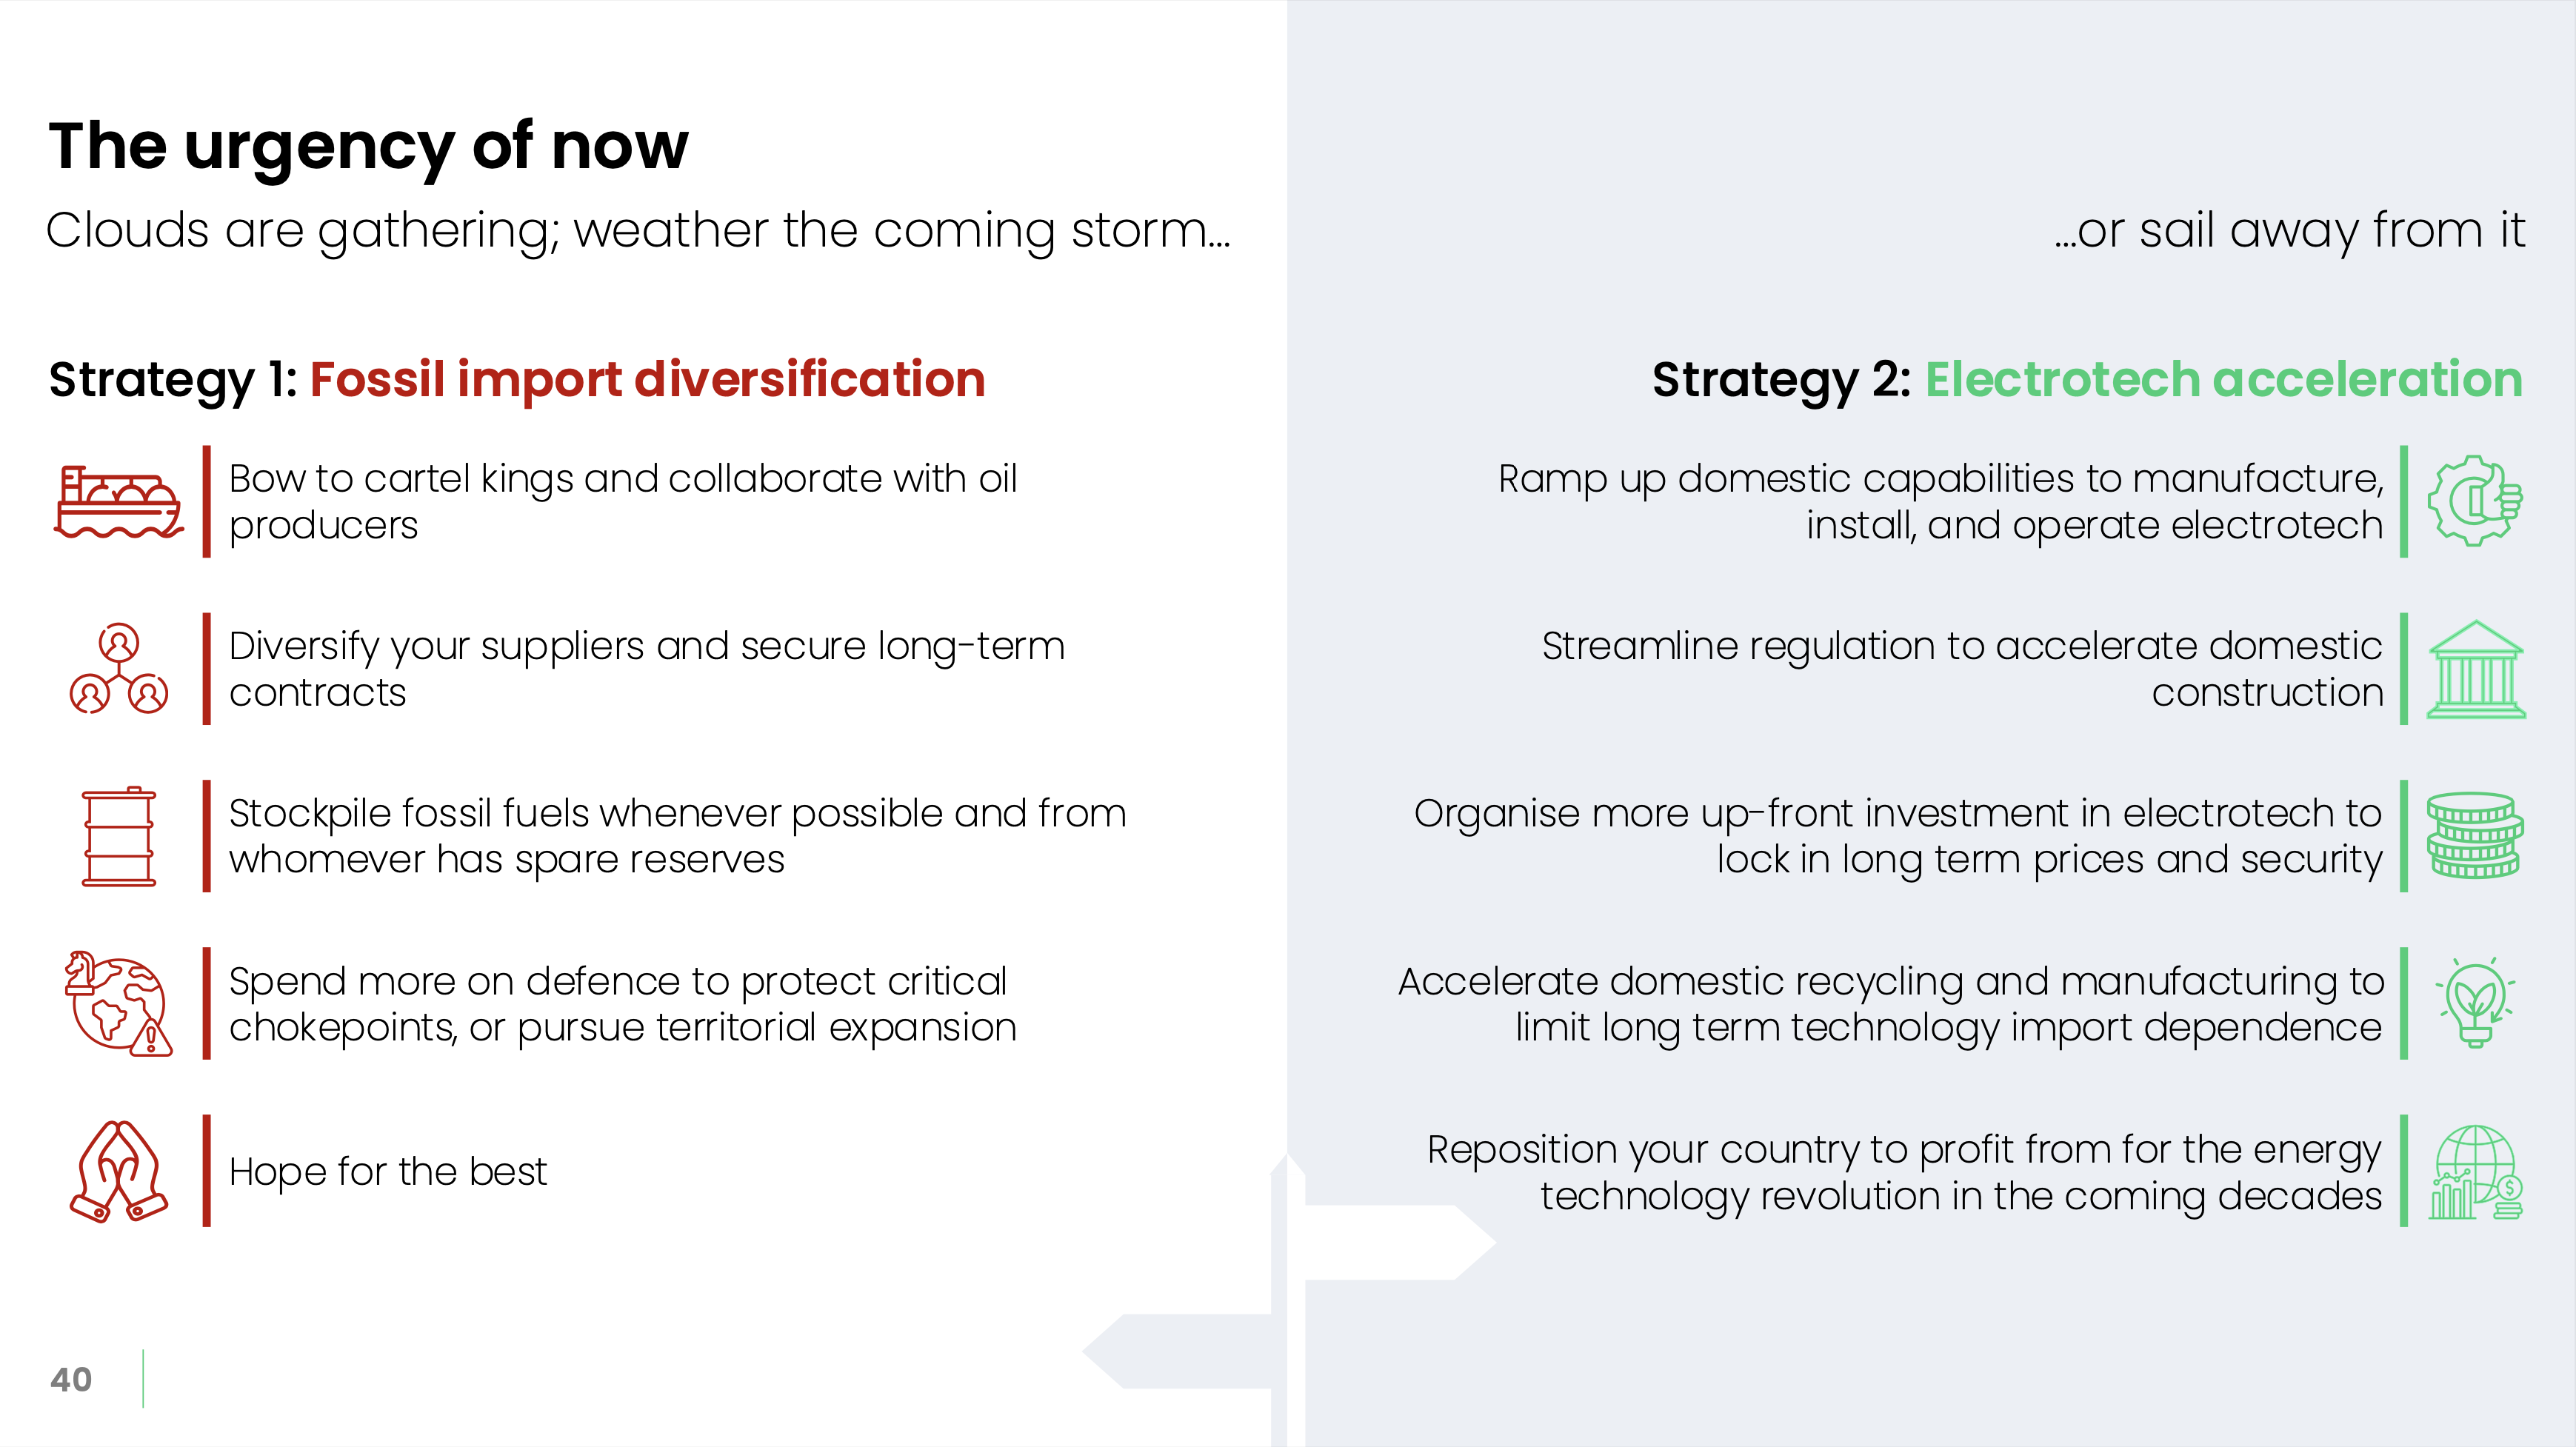
Fossil fuel import dependency is high— and the risk is rising

An area chart showing the 12-fold increase in global fossil fuel imports since 1960 - broken down into coal, gas and oil. After a surge in trade after the war, there was a pull-back after an oil shock, then relentless growth from 1985 to 2019.
A world map displays fossil net imports as a percentage of primary energy demand in 2022. Fossil import dependency is widespread. 52 countries import more than half their primary energy as fossil fuels
A column chart shows that three-quarters of the global population live in net fossil fuel importing countries. 76% in coal importers, 79% in oil, 62% in natural gas, and 74% for all fossil fuels combined.
A regional column chart compares the percentage of people in each region living in fossil-fuel importing countries in 2022. North America is shown at 0%, while Asia and Europe have much higher values- closer to 100%.
A marimekko chart shows the value of fossil fuel imports and exports as a share of GDP (height) for selected countries in 2022 and the population living in these countries (width). Text at the side indicates that one quarter of the global population spends over 5% of GDP on fossil imports. Another annotations writes that three-quarters of the global population is a net importer of fossil fuels.
A connected dot plot showing oil and gas net imports as a share of primary energy in 1990 and 2022 across six global regions. The data shows increases or decreases in almost all regions showing fossil import dependency is deepening.
A line chart shows U.S. fossil fuel imports as a percentage of energy use from 1940 - reaching more than 30% at its peak in the 2000s - falling to below 0 in 2019 making the US now a net exporter of fossil fuels, after once being highly dependent on imported fossil fuels.
A line graph tracks the Global Trade Policy Uncertainty Index from 2009 to 2025. There is a sharp increase after 2025, when Trump began his second term in office.
A map with pie charts overlaid illustrates the high share of maritime oil trade passing through certain chokepoints: Suez Canal (11%), Strait of Hormuz (27%) and Strait of Malacca (31%).
Three stacked bar charts break down Germany’s 2019 energy data by energy source, demand by sector, and value-added contribution to GDP. The graphic highlights that when energy imports stop, all sectors of the economy are at risk.

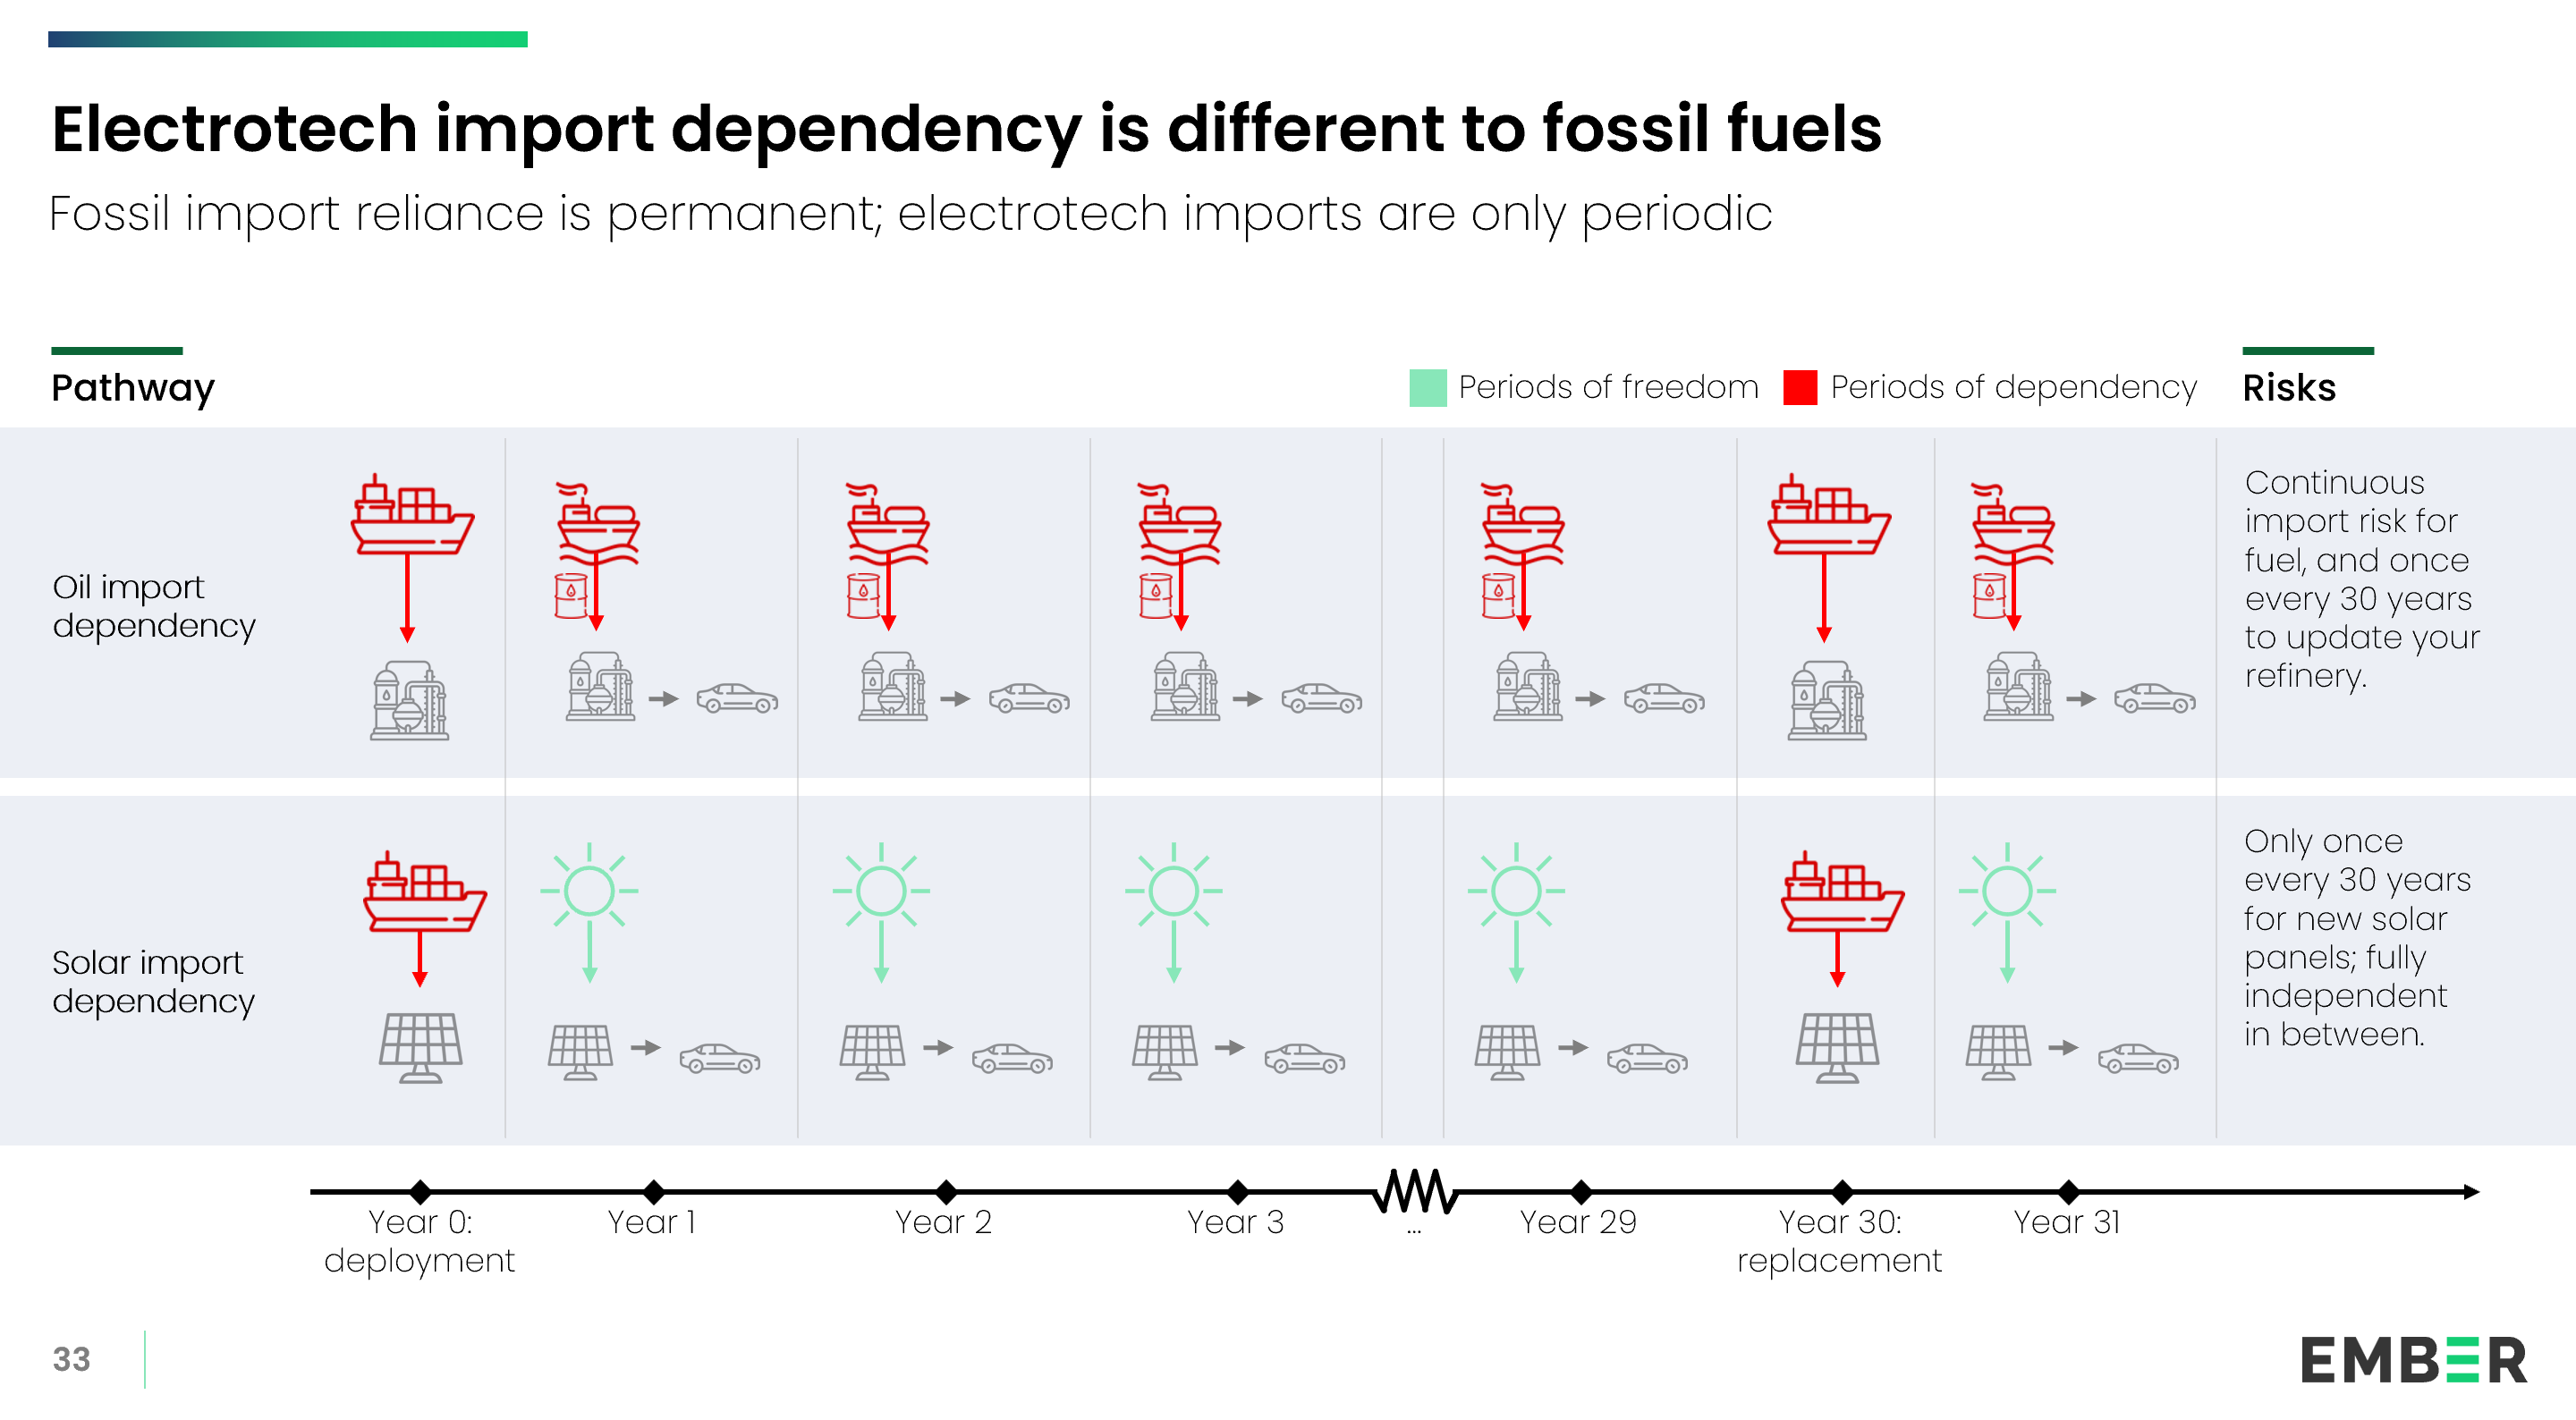
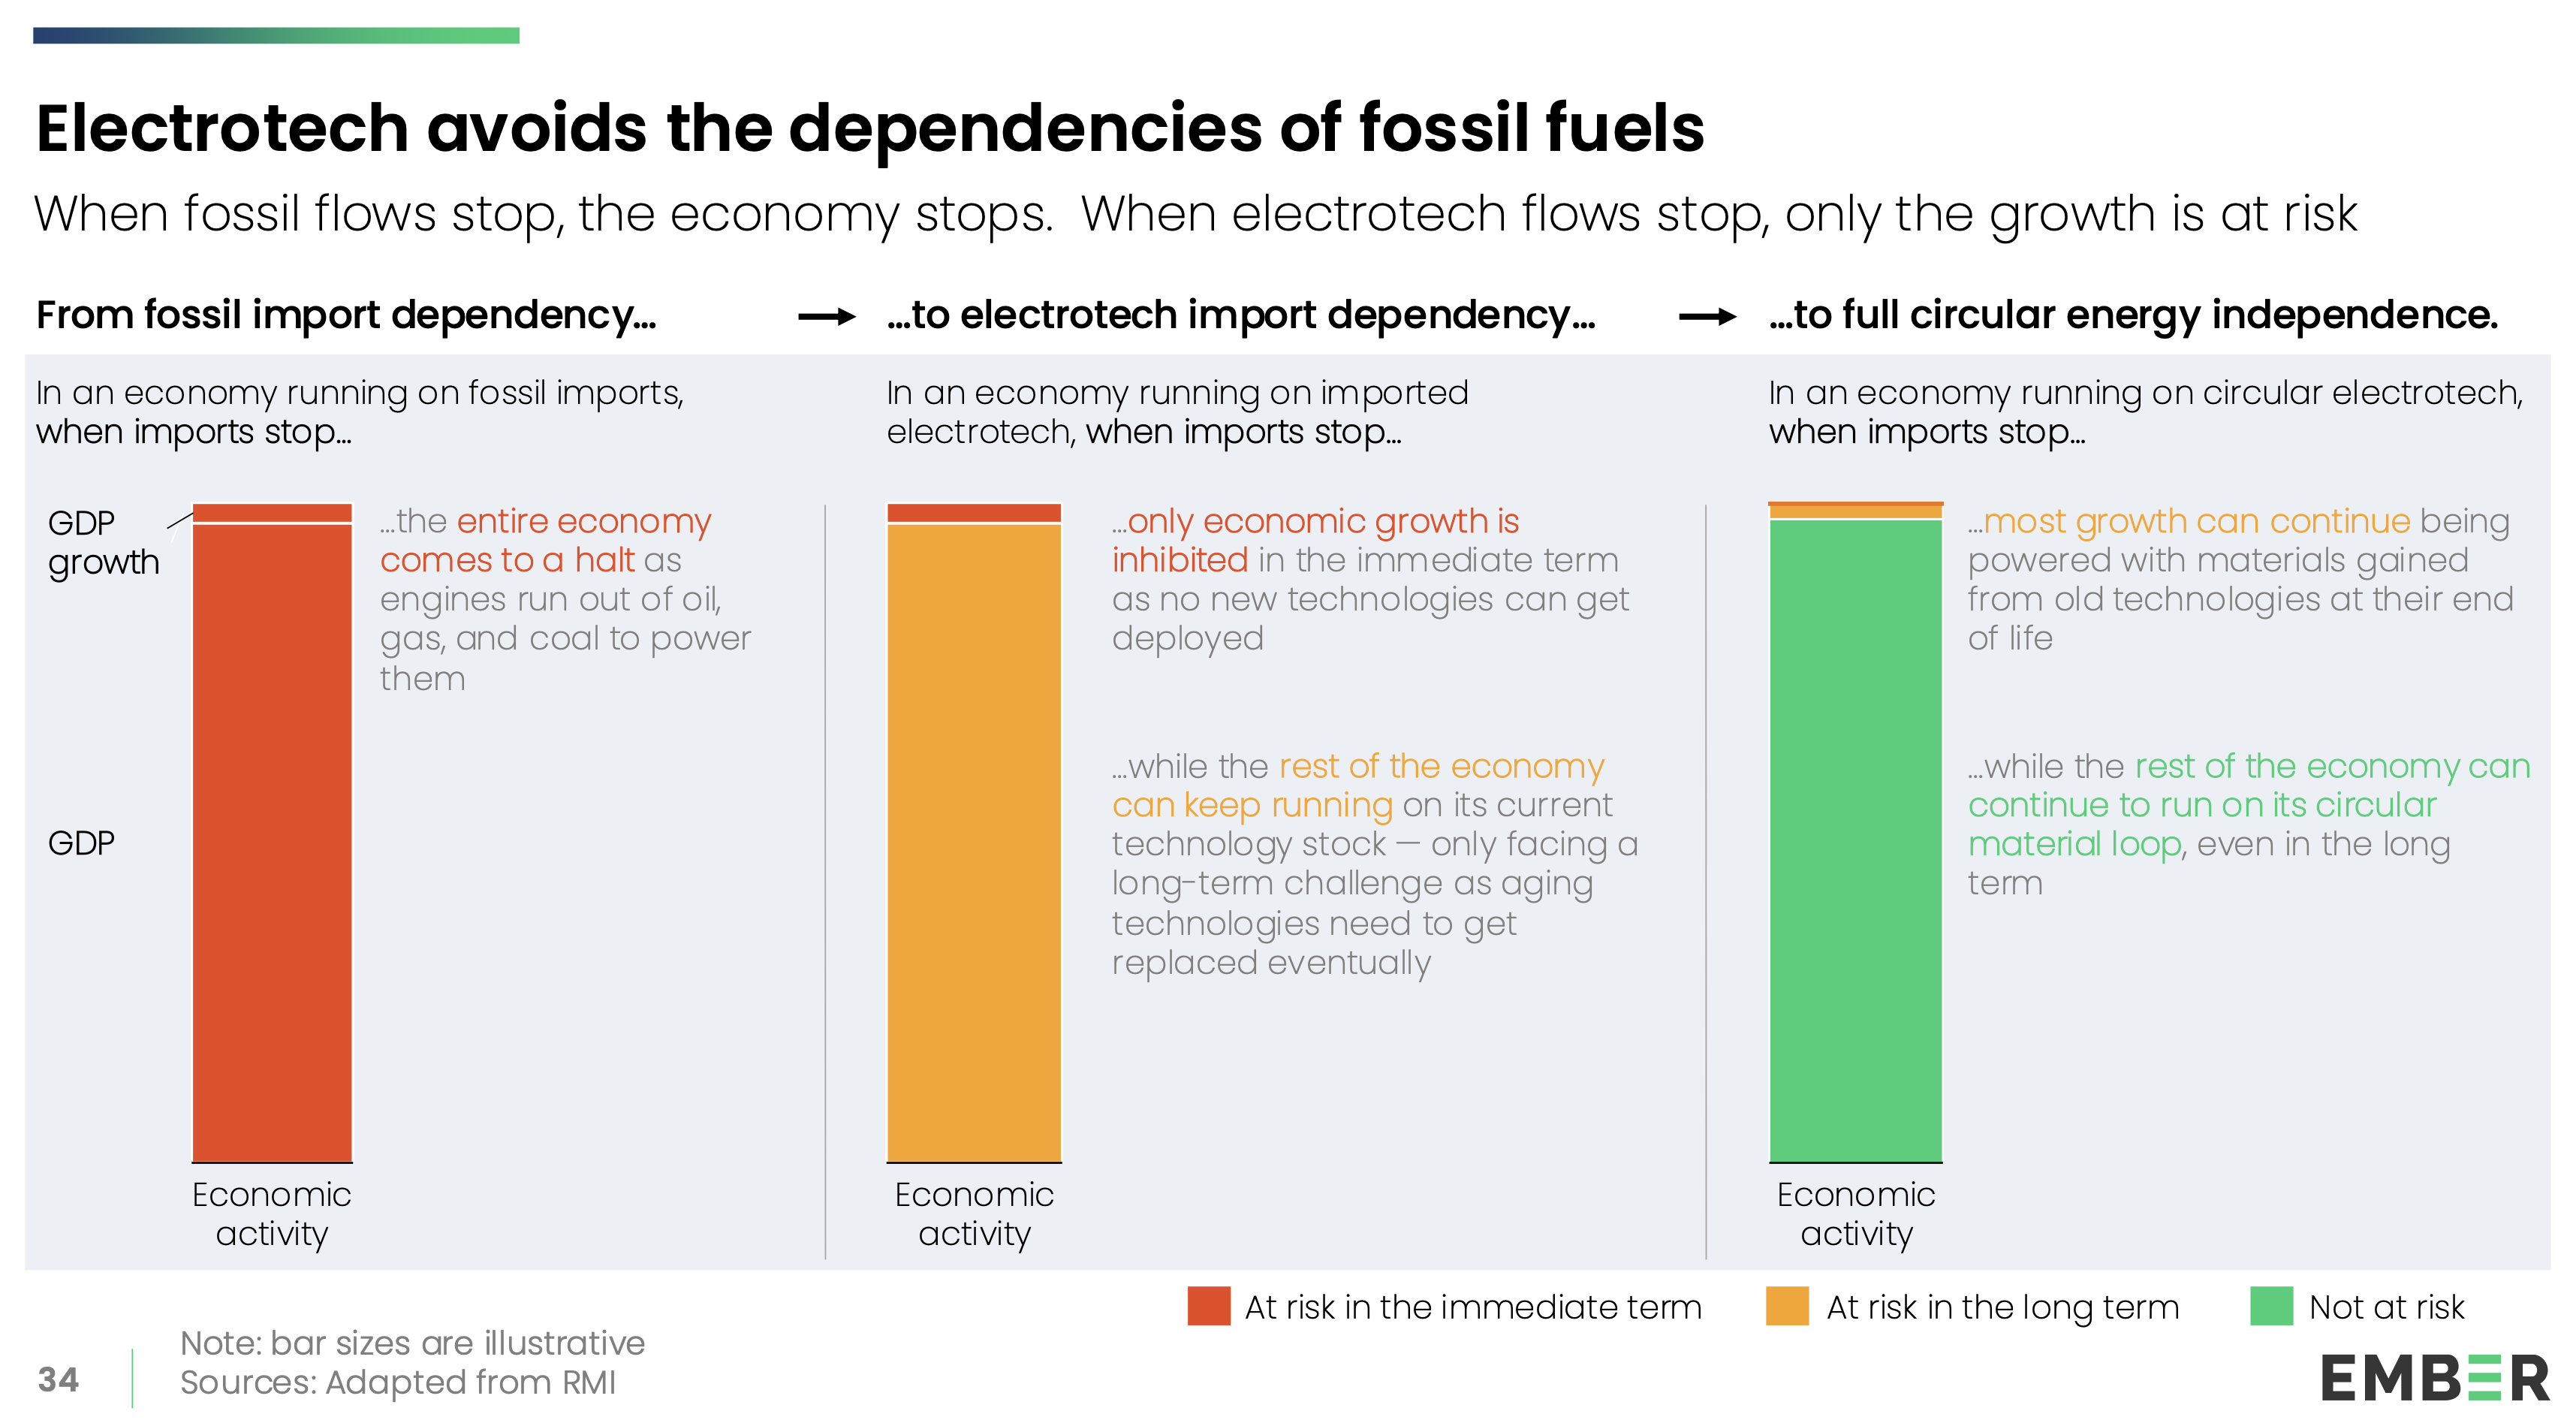
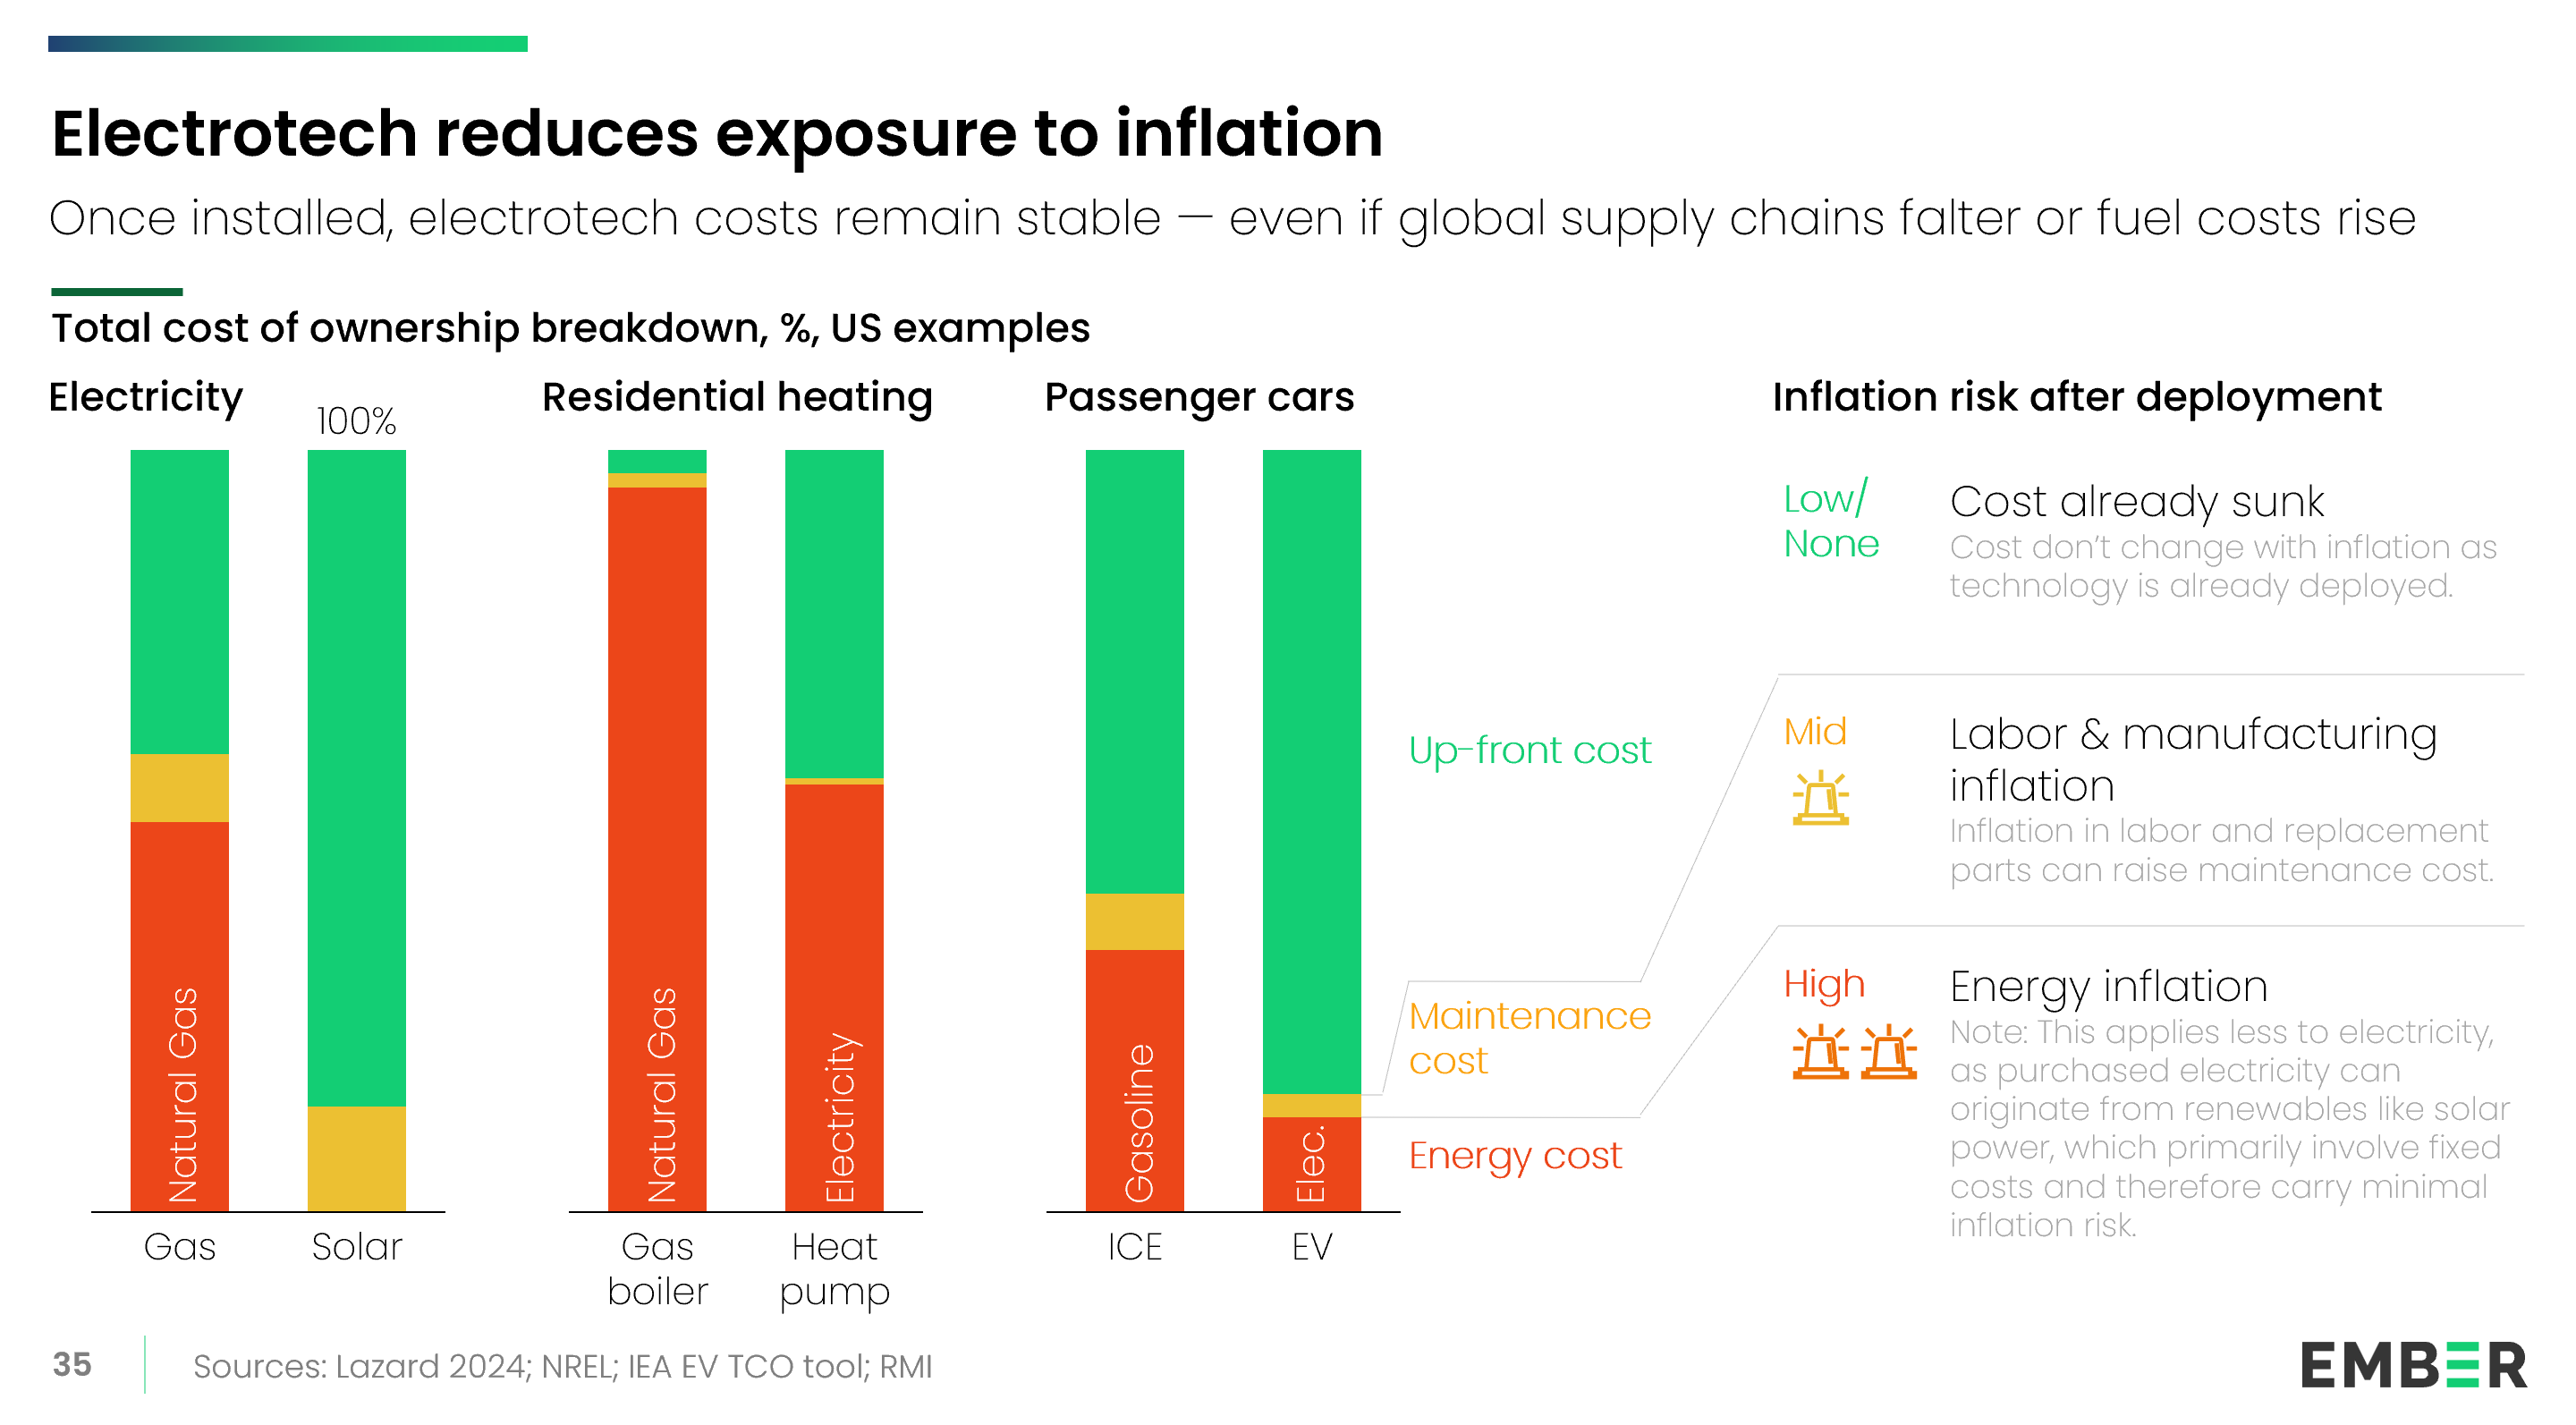
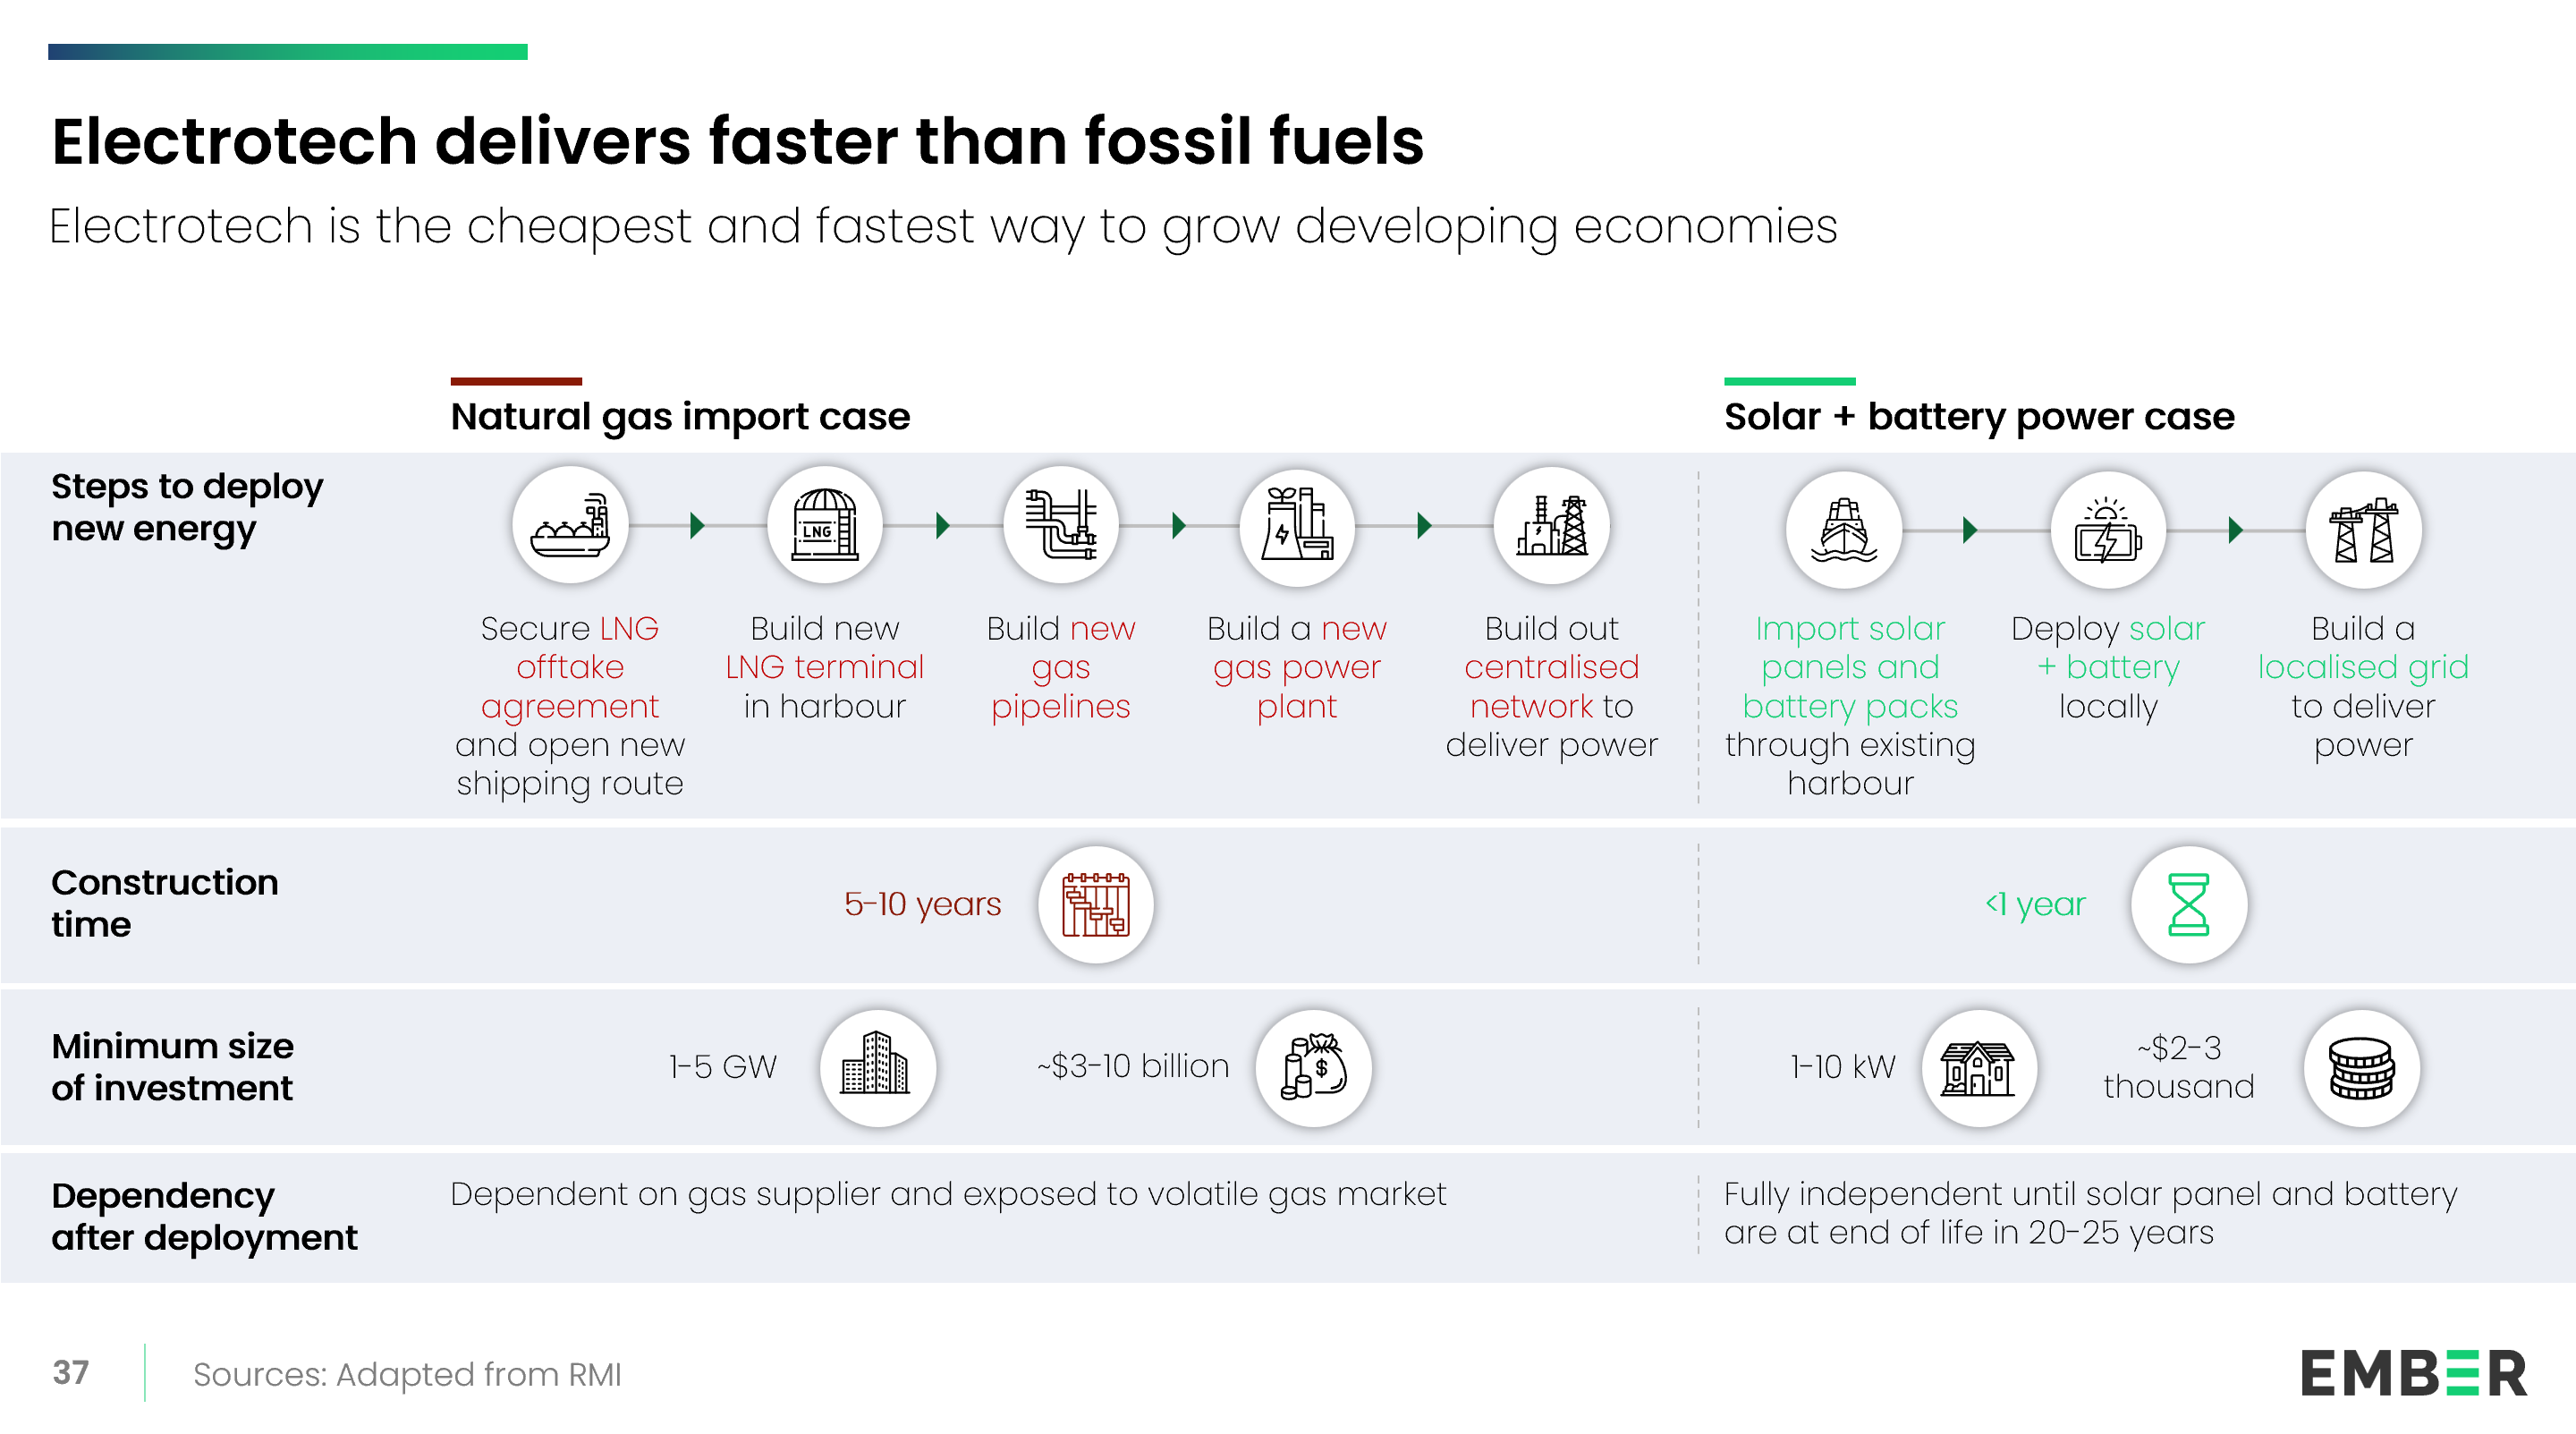
Electrotech offers a new strategy for energy security

A comparison table contrasts the old and new energy security strategies. The left column describes characteristics of fossil fuel dependency, while the right column describes features of electrotech solutions.
A diagram with six side-by-side bar charts illustrates different technologies that fall under “electrotech,” including solar PV, wind, battery storage, electric vehicles, heat pumps, and HVDC lines. Data compares deployment between 2010 and 2020. These all define electrotech in three categories - supply (renewables); connections (battery storage and gridtech) and demand (EVs and heat pumps).
Energy security required two things - advancing clean electricity and growing electrification. A treemap shows the share of global final energy demand by source in 2023, separated into electrons (electricity) and molecules (fuels). The chart distinguishes between imported fossil fuels, domestic fossil fuels, solar and wind, and other clean sources.
A map-based chart displays the renewable energy potential of countries in 2022 as a multiple of their energy demand. 92% of people live in countries with a renewable energy potential more than 10x their energy demand.
A horizontal bar chart compares solar and wind potential to fossil fuel production and energy demand for selected countries. The chart shows renewable potential is almost 120x greater than current global fossil energy production, and almost 100x greater than global demand.
A multi-line area chart shows electricity use taking off in various applications—including lighting, heating, cooling, and machine tools—between 1900 and 2020.
A stacked bar chart breaks down fossil fuel demand across four end-use sectors and indicates how much of that demand can be replaced with specific electrotech solutions. Technologies include electric vehicles for transport, heat pumps for building, and industrial heat pumps and electric boilers/furnaces for the industrial sector.
A marimekko shows fossil fuel import spending as a share of GDP for selected countries. The bars are split into fossil use for power generation and fossil use for end-use sectors.
Similar to the previous chart, this marimekko focuses on the potential reduction of fossil fuel imports through electric vehicles ($590bn per year). It shows avoided import costs as a separate portion of each country’s total.
The marimekko now shows how heat pumps in buildings could further reduce fossil fuel imports. Avoided import costs from EVs and heat pumps are highlighted separately for each country - collectively these two technologies could save $840bn per year.
This marimekko adds the impact of renewables to the previously shown savings from EVs and heat pumps; avoided imports now, globally, amounts to $1.26tn annually.
Two bar charts summarize the combined impact of electric vehicles, heat pumps, and renewables. One chart shows reductions in exajoules, and the other shows reductions in global fossil fuel spending. The three levers could reduce both by 70%.

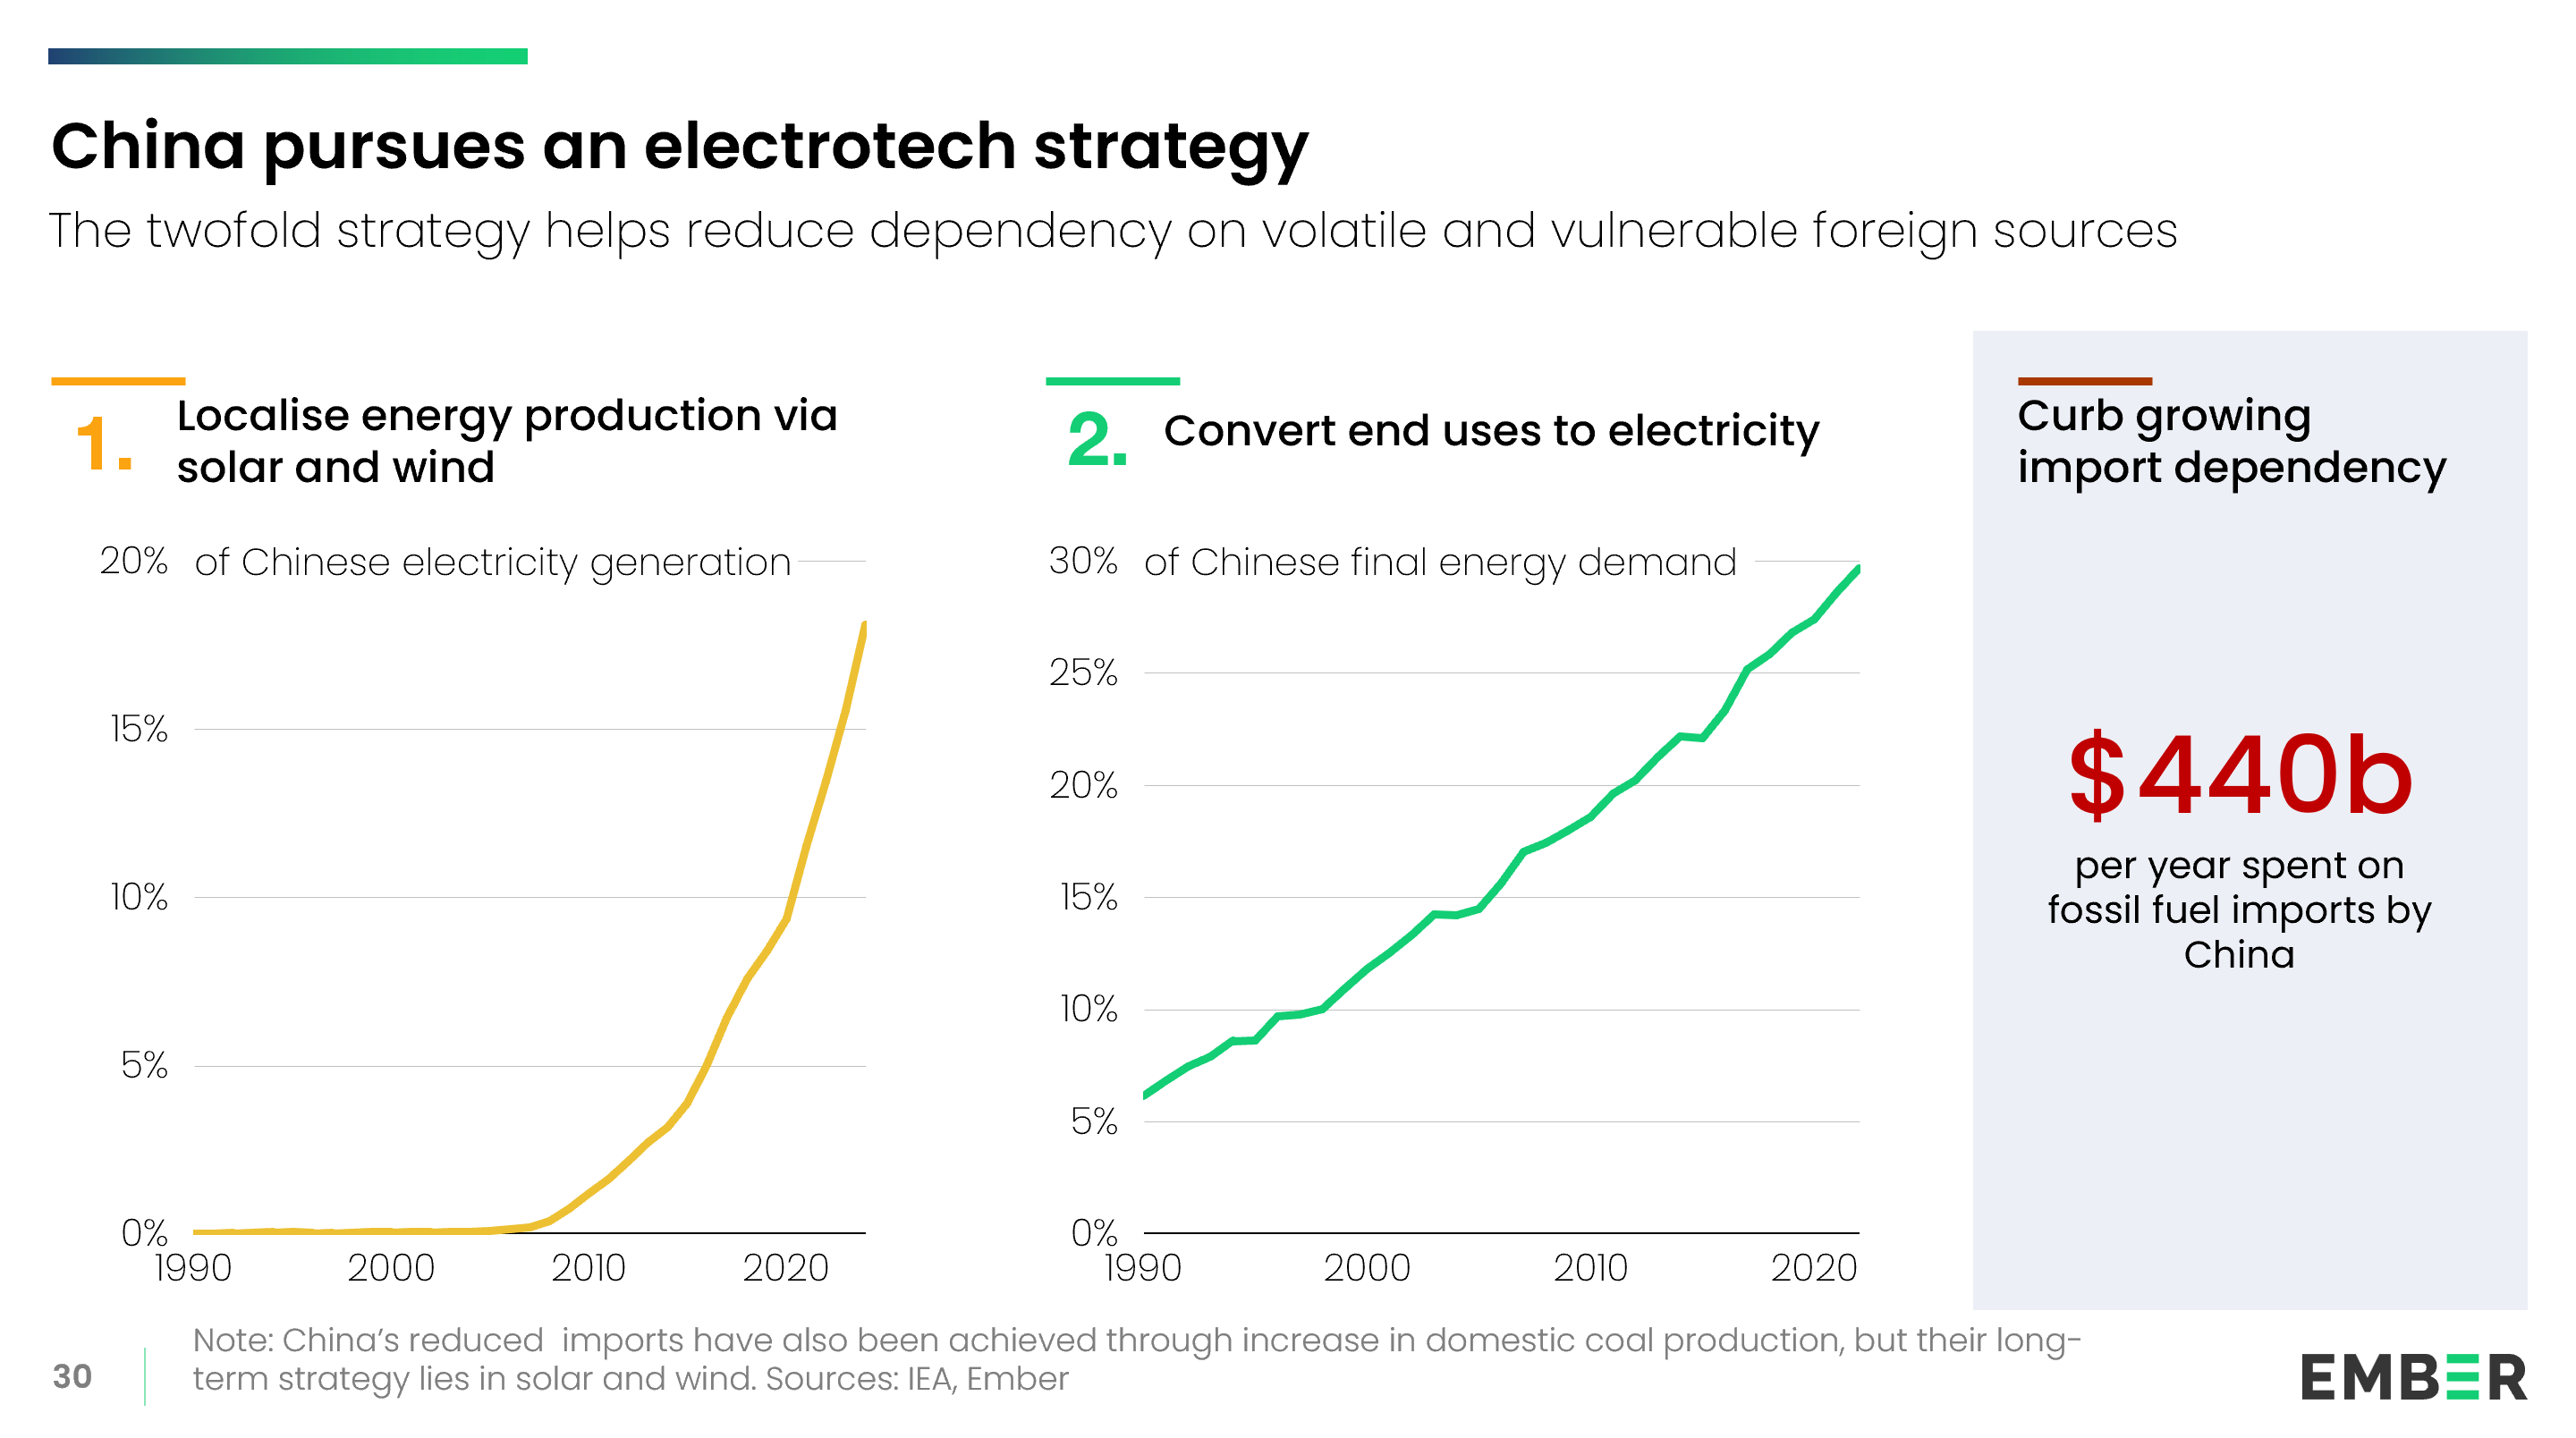
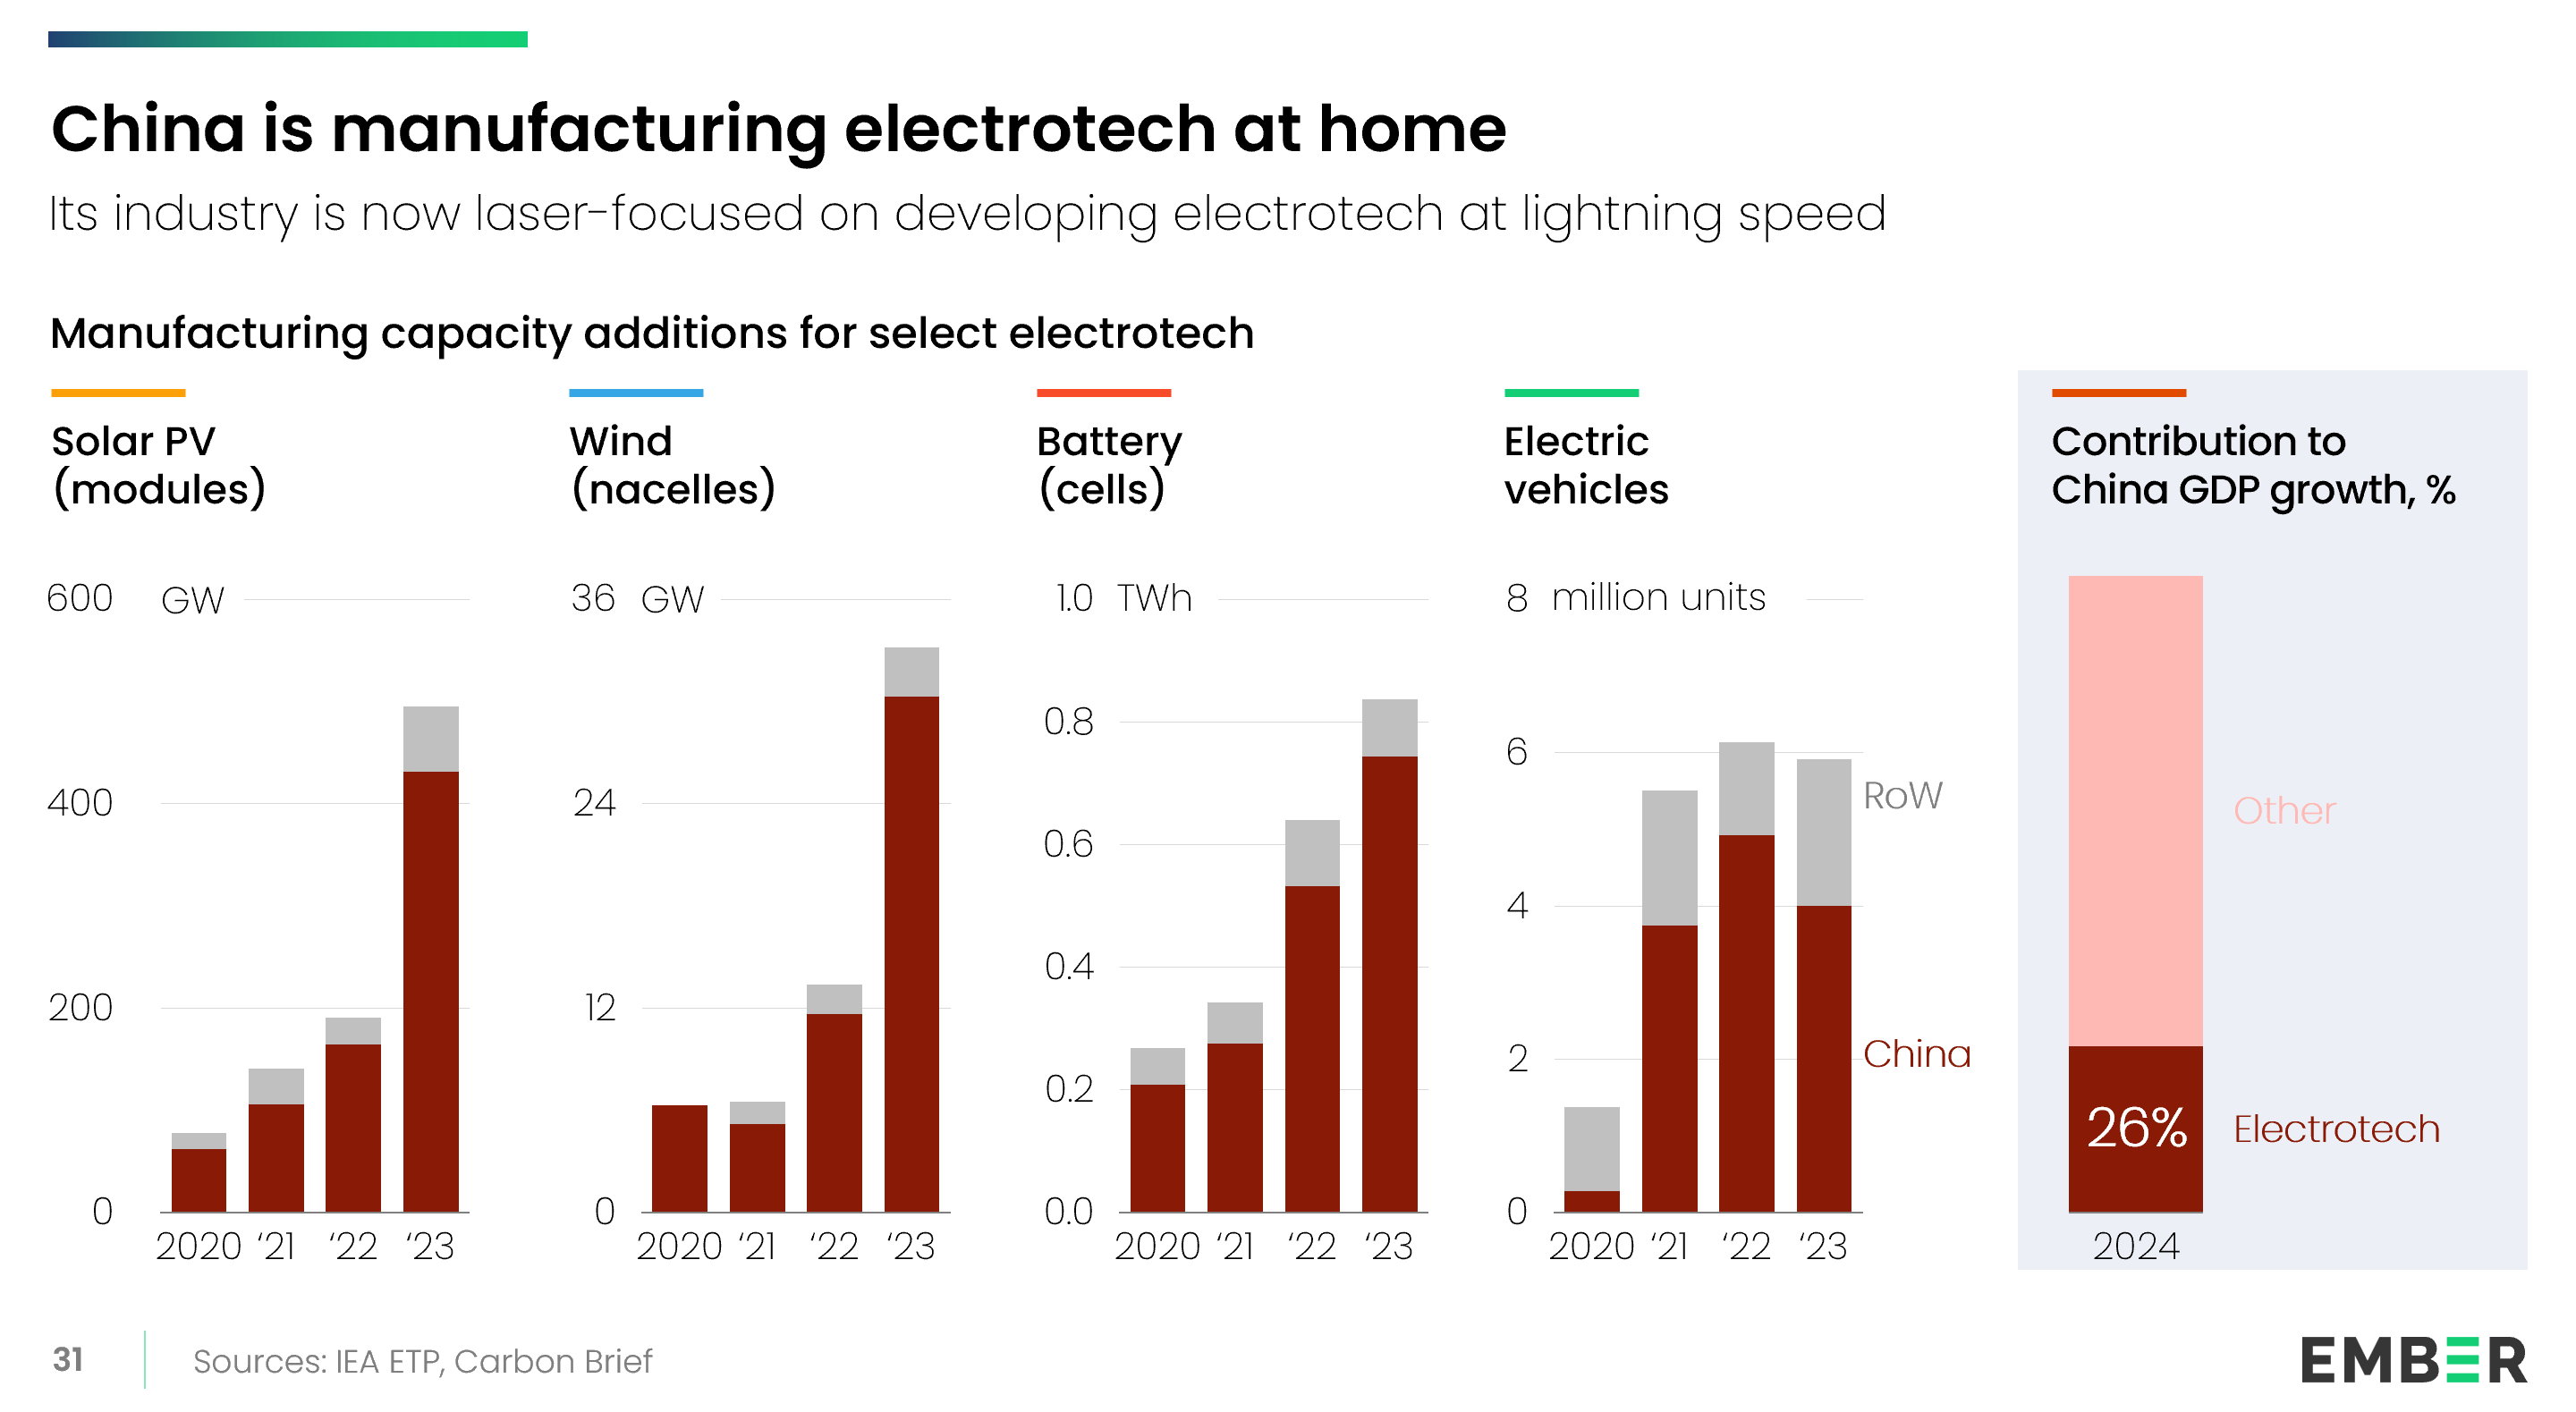
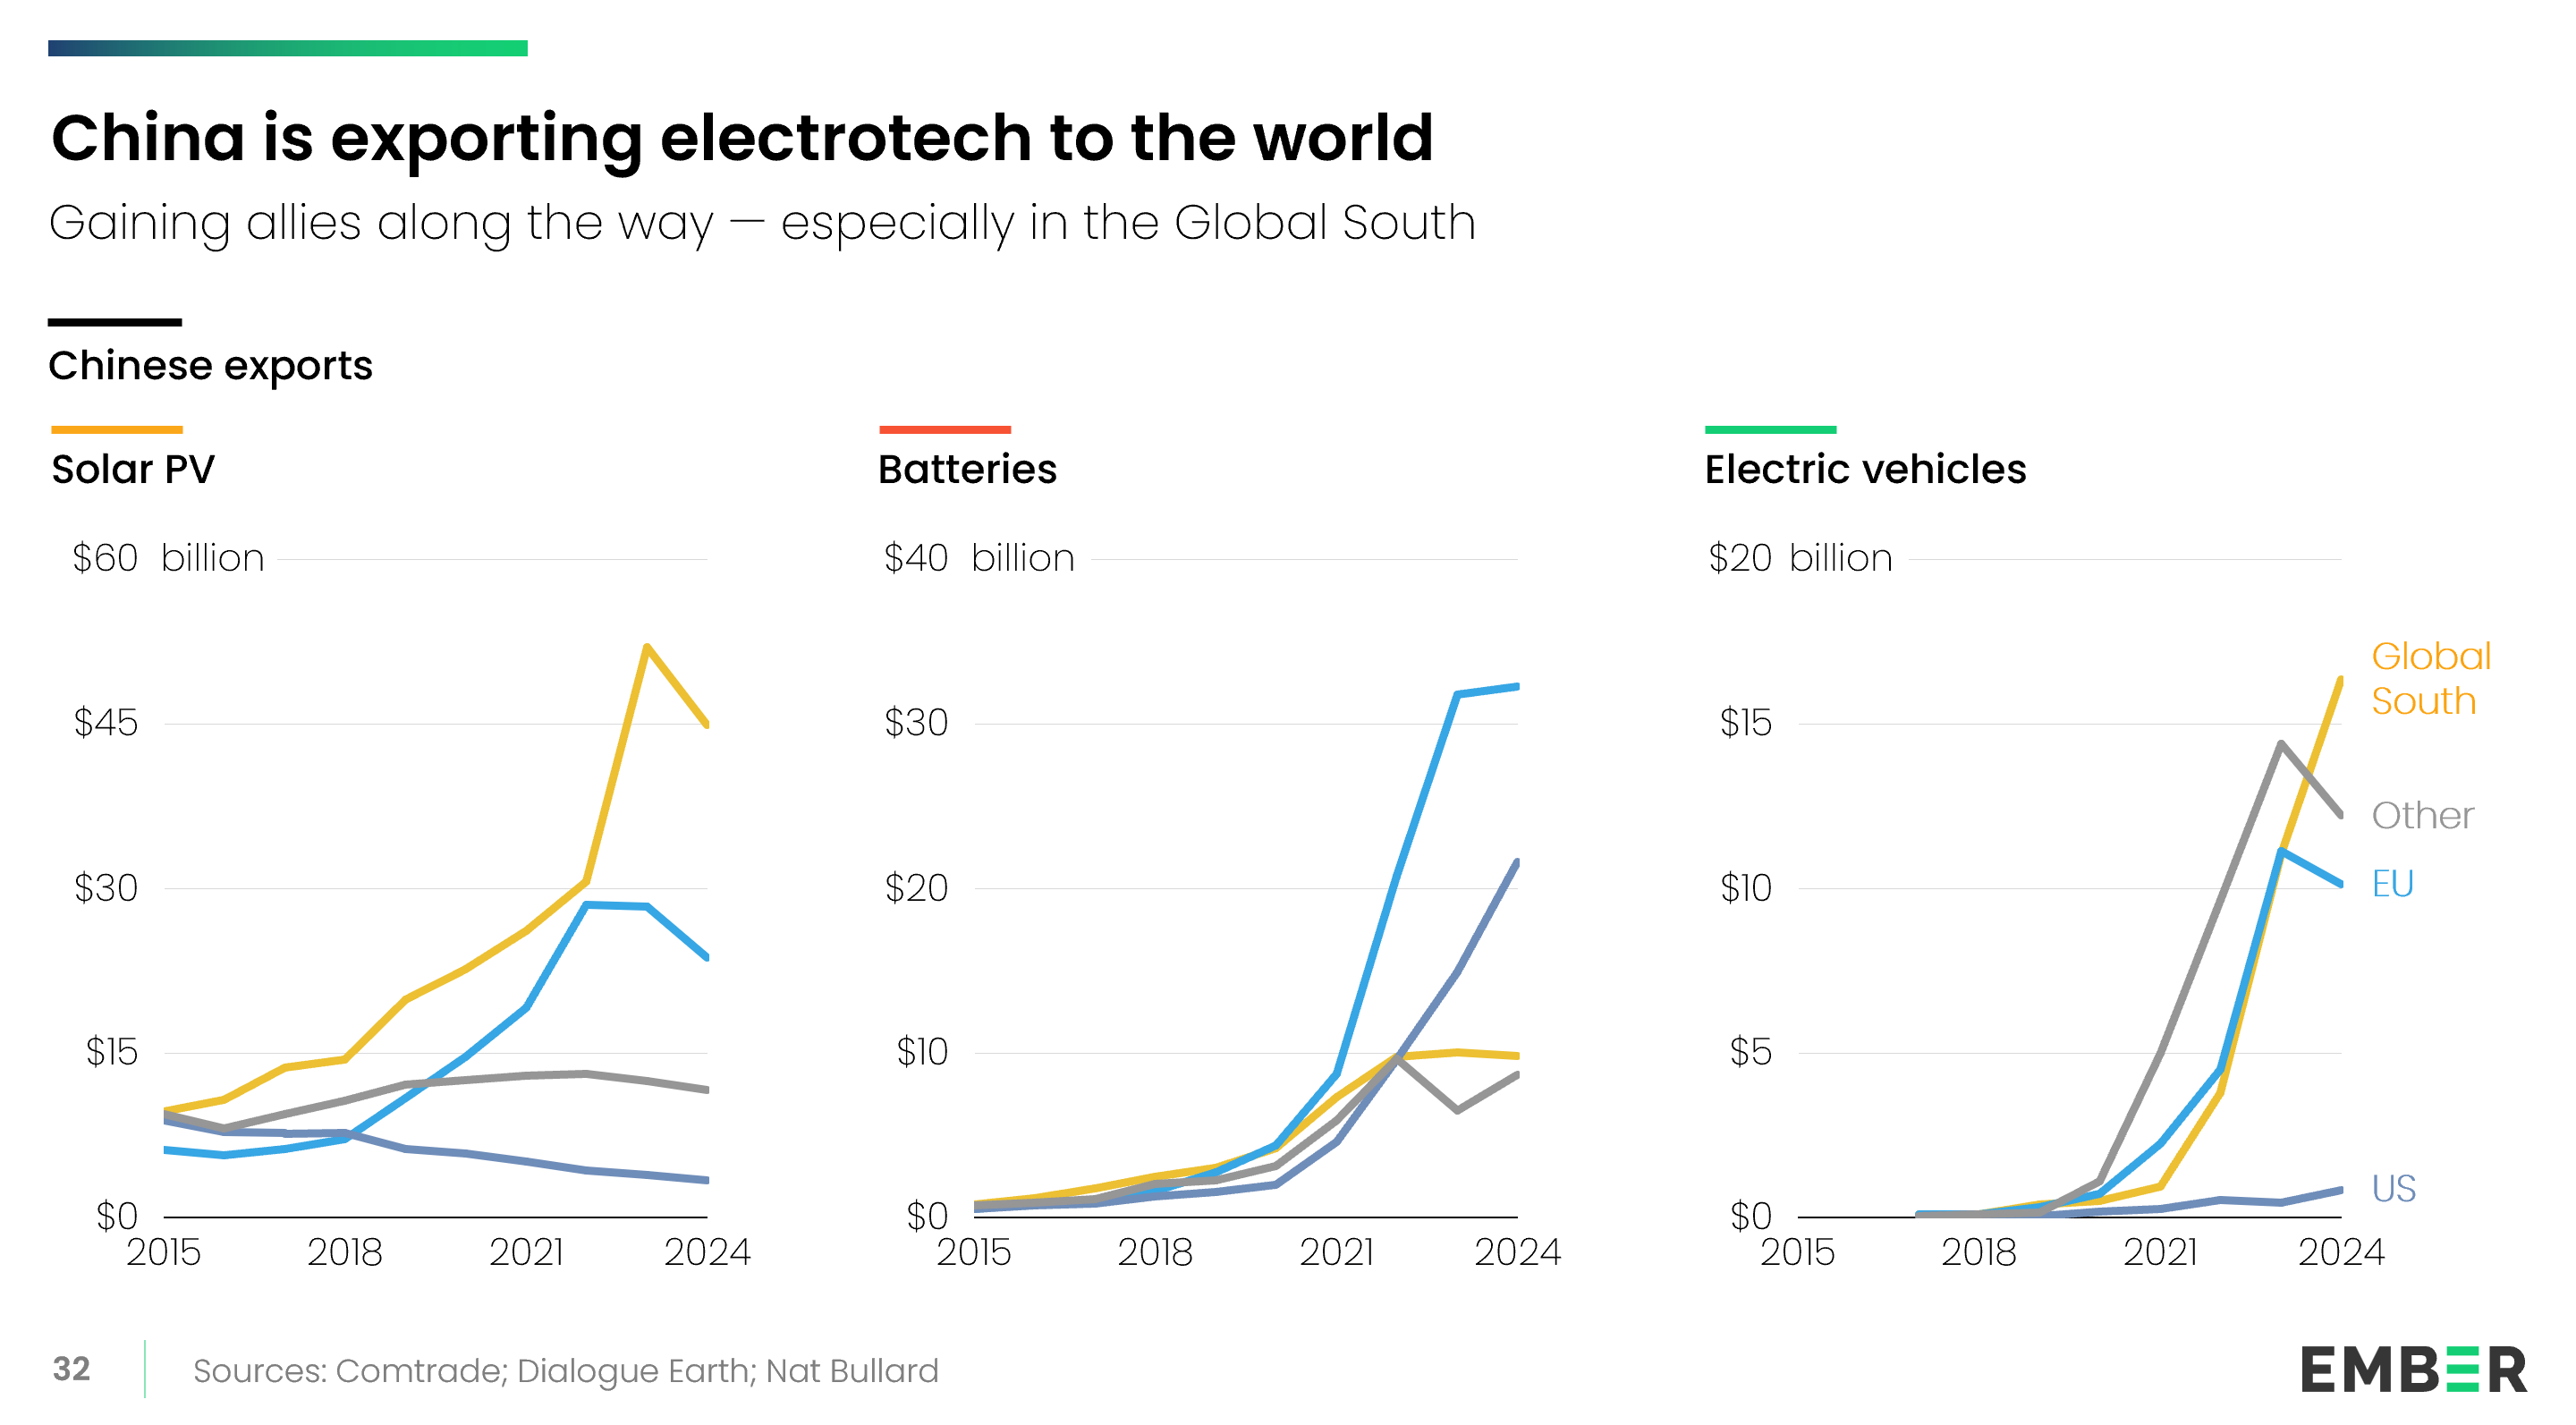
China is pursuing this strategy— others can follow

Two line charts show trends in China’s rapidly rising electricity generation from solar and wind, and China’s final energy demand covered by electricity. The charts span 1990 to 2020. $440b is spent per year on fossil fuel imports by China.
Multiple bar and line charts show China’s growth in electrotech manufacturing capacity from 2020 to 2024. Technologies include solar PV, wind turbines, batteries, and electric vehicles.
Three line charts display China’s rising exports of solar PV, batteries, and electric vehicles from 2015 to 2024 - grouped by recipient region, including the Global South, EU, US, and others.
A graphic compares fossil fuel import cycles with electrotech import cycles. The fossil import chart shows continuous dependency (importing every year), while the electrotech chart shows limited imports needed for solar panels - only every 30 years.
A three-part diagram compares the risk of economic disruption from fossil imports, electrotech imports, and circular electrotech. In the first panel, which represents fossil imports, a large portion of economic activity and GDP is shown as immediately at risk if imports stop, illustrating total system dependence. The second panel shows an economy reliant on imported electrotech, where only new growth is at risk if supply stops, as existing infrastructure continues to function. The third panel illustrates a circular electrotech system, where both economic activity and growth can continue using recycled materials and domestic capabilities, showing a path to long-term energy independence.
Three stacked bar charts show the total cost of ownership for passenger cars and residential heating using different energy sources. Costs are broken into up-front, maintenance, and energy components, and labeled by inflation exposure. Electrotech has less risk after deployment.
A bar chart shows Europe and China’s net fossil fuel import spending from 2018 to 2023. Annotations mark the start of the war in Ukraine and show the effect on fossil fuel prices - up 1.9x in the EU and 1.4x in China.
A two-column comparison shows the steps required to deploy natural gas infrastructure versus solar plus battery systems. Each includes the number of steps, time to deploy, investment size, and long-term dependencies. In each case, solar +battery power is better.
Reasons to pursue electrotech beyond energy: robotics, AI, defense, and digital hardware.
Two bar charts compare fossil fuel emissions and fossil fuel imports by fuel type and by end-use sector. The charts highlight which areas contribute most to emissions and import dependency.
A split-panel slide compares two strategies: fossil fuel import diversification versus electrotech acceleration. Each side lists five policy actions or characteristics associated with the respective strategy.

Downloads

Download the complete slide deck

PDF – Energy Security in an Insecure World

Methodology

This analysis examines the energy trade balances of all countries globally, using the World Energy Balances published by the International Energy Agency (IEA). The principal reference year is 2022, as it is the most recent year for which the dataset provides a complete picture of national energy trade flows. Population data are sourced from the OECD via the IEA. Real GDP figures are obtained from the World Bank.

A net importer is a country whose imports of a given fuel exceed its exports of that fuel on a total energy basis. The category of oil includes products and crude.

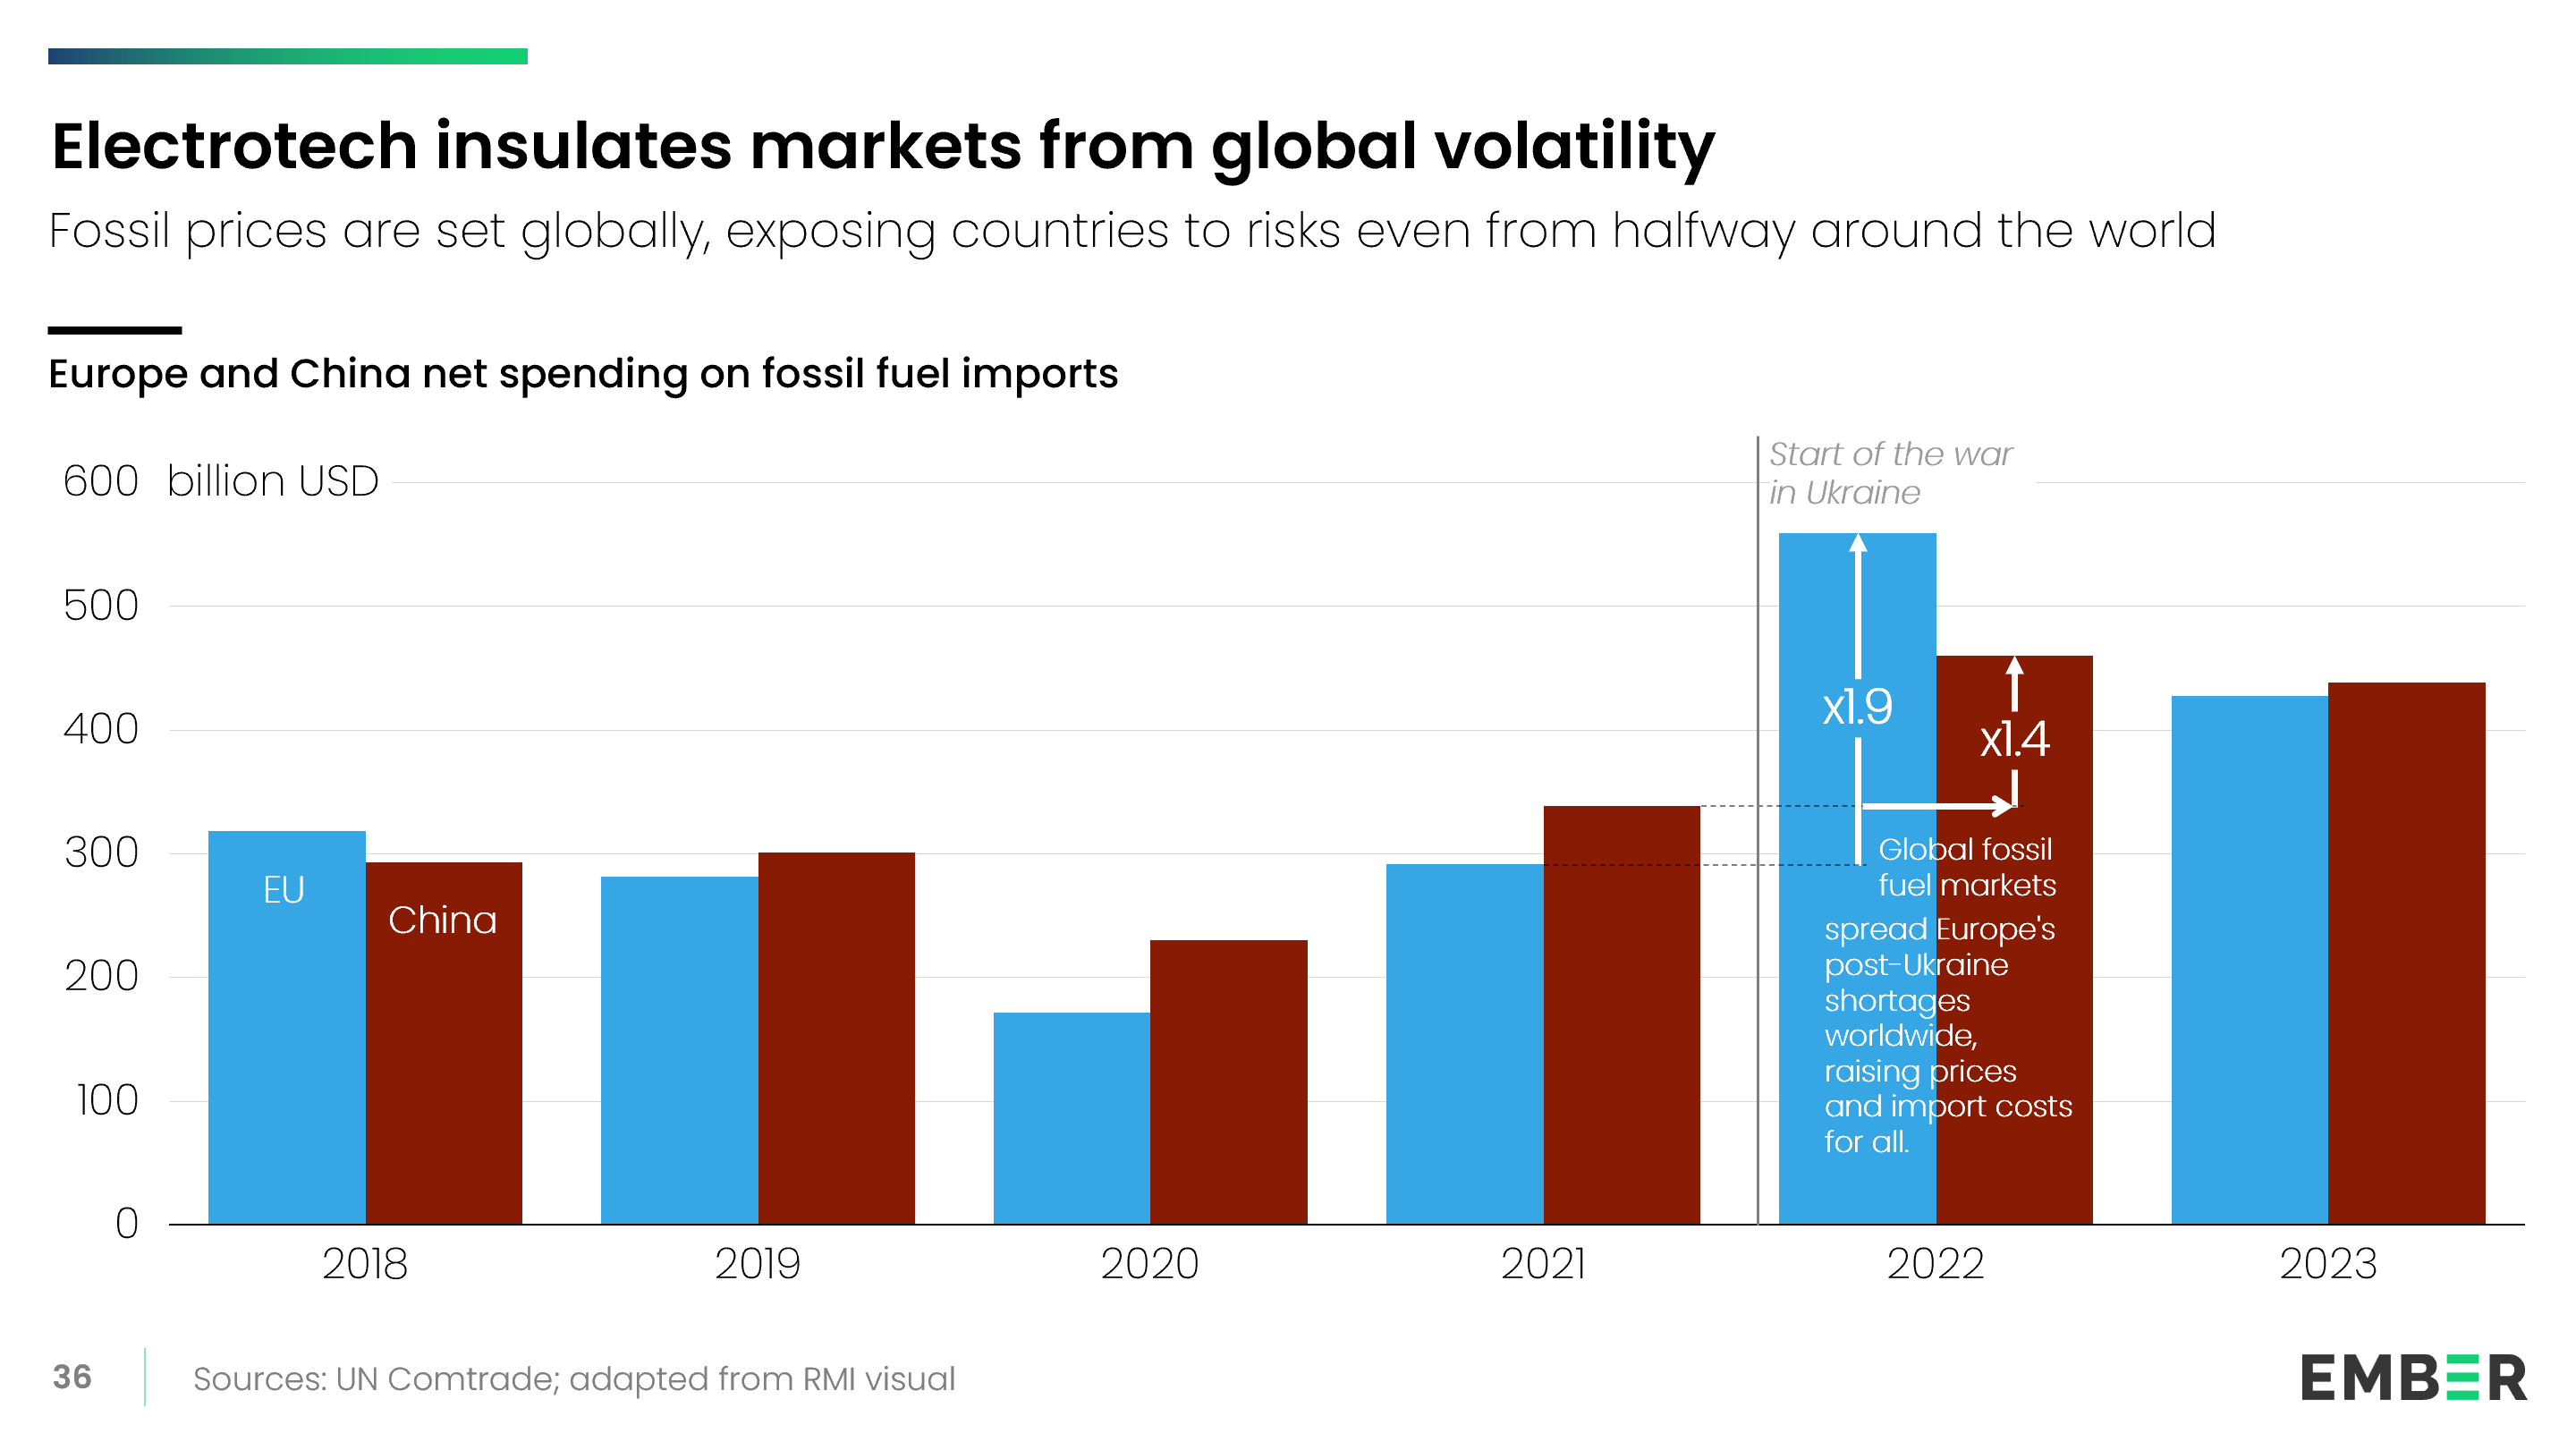
In charts assessing the cost of energy imports, we pair 2022 energy flow data with a more representative fossil fuel price—adjusted to account for the exceptional price spikes caused by the Ukraine war. This adjustment is intended to provide a view of the economic burden of fossil fuel imports outside of a geopolitical shock.

To estimate the potential savings available to fossil fuel importers through electrotech, we assess three major levers: solar and wind, electric vehicles (EVs), and heat pumps. Their potential is sized as follows:

  • Solar and Wind: Assumed to have the potential to displace up to 100% of the imported fossil fuels currently used for electricity generation. This is not to assume that solar and wind will provide all electricity in the system, but rather that the proportion of electricity generated currently from imported fossil fuels can be replaced by domestic renewable sources.
  • Electric Vehicles (EVs): Assumed to substitute all imported fossil fuels used for road transport.
  • Heat Pumps: Assumed to replace all imported fossil fuels used for heating in buildings.

No specific timeframe is prescribed to this potential, as the pace at which nations realise these savings depends on choices made today.

We acknowledge that further savings are possible through the electrification of industrial processes and other solutions to non-road transport; however, these are not included in this analysis.

Acknowledgements

Cover image

Wind turbines and oil storage tanks in Rotterdam. Credit: Jon Bower / Alamy Stock Photo

Share