Chapter 2:
Country and region analysis
In this chapter
Deep dive on the five biggest power sector emitters
Electricity demand fell in some high income economies (the EU, Japan, and the US), driving their emissions down and contributing to flattening emissions at the global level. In India, demand grew moderately leading to slower growth in coal generation compared to the same period last year which in turn slowed down emissions rise. Demand also increased in China where problems with hydro necessitated higher coal consumption and led to increased emissions.
2.1
China
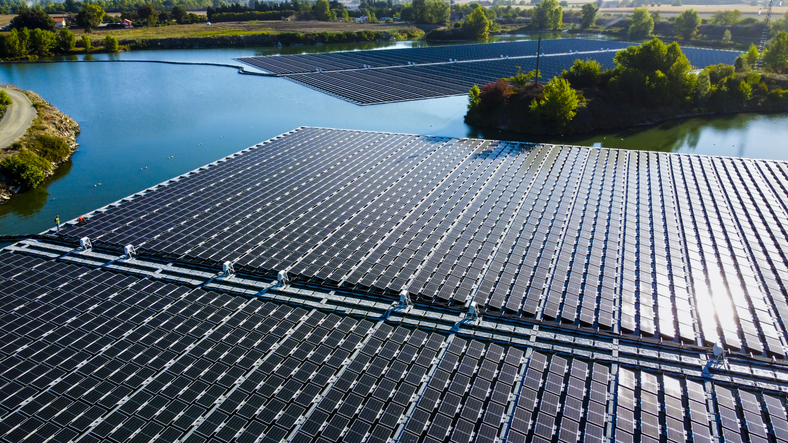
China accounted for two-thirds of global growth in wind and solar generation in the first half of 2023, but poor hydro conditions led to an increase in coal power
China is the world’s largest power producer, accounting for 31% of global generation, and it will continue to be responsible for most future global demand growth. Hence, what happens in the country’s electricity sector is critically important to the global electricity transition.
In the first half of 2023, China accounted for 67% of global growth in wind and solar generation, but poor hydro output meant that China also saw a significant increase in generation from coal.
China’s demand increased above the world average
China’s electricity demand grew 6% (+246 TWh) in the first half of 2023, a larger increase than the 2.4% growth seen in the same period last year. However, the country’s growth this year is in line with its average growth over the last decade (2012-2022) of 5.9%. As usual, China’s demand growth in the first half of this year was significantly higher than the global average of 0.4%.
Demand growth in China was mainly caused by economic growth, which is forecast to be about twice the world’s average this year, as well as heat waves over May and June resulting in increased demand from air conditioning in that period. Despite the temporary weather-related increases, the demand growth of 6% this year so far has been in line with the China Electricity Council forecast for 2023 of 6%.
China remains a global leader in new wind and solar generation
China continues to be the global leader in the build up of wind and solar, accounting for 67% of the global increase in wind and solar generation in the first half of 2023.
China’s wind generation increased 26% (+99 TWh) in the first half of 2023, compared to the same period last year, which is almost three times faster than the global average. China’s fast growth in wind generation is outpacing growth in the EU, Japan and the US where generation either grew moderately or saw small falls. This meant that 91% of global additions in wind generation in H1-2023 came from China. At the same time, China’s solar generation grew 21% (+44 TWh), higher than global solar growth of 16%. In the first half of 2023, China provided 43% of the global increase in solar generation. Combined, the two sources grew 24% (+144 TWh) in China, nearly double the global average growth of 12%.
Generation from wind and solar in China has doubled in just three years. In H1-2020, 369 TWh were produced from wind and solar. In H1-2023, this had increased to 738 TWh. Consequently the share of wind and solar generation also increased substantially, from 11% in H1-2020 to 17% of China’s electricity in the first six months of 2023. It is the first six-month period in which China has generated more than a sixth of its electricity from wind and solar.
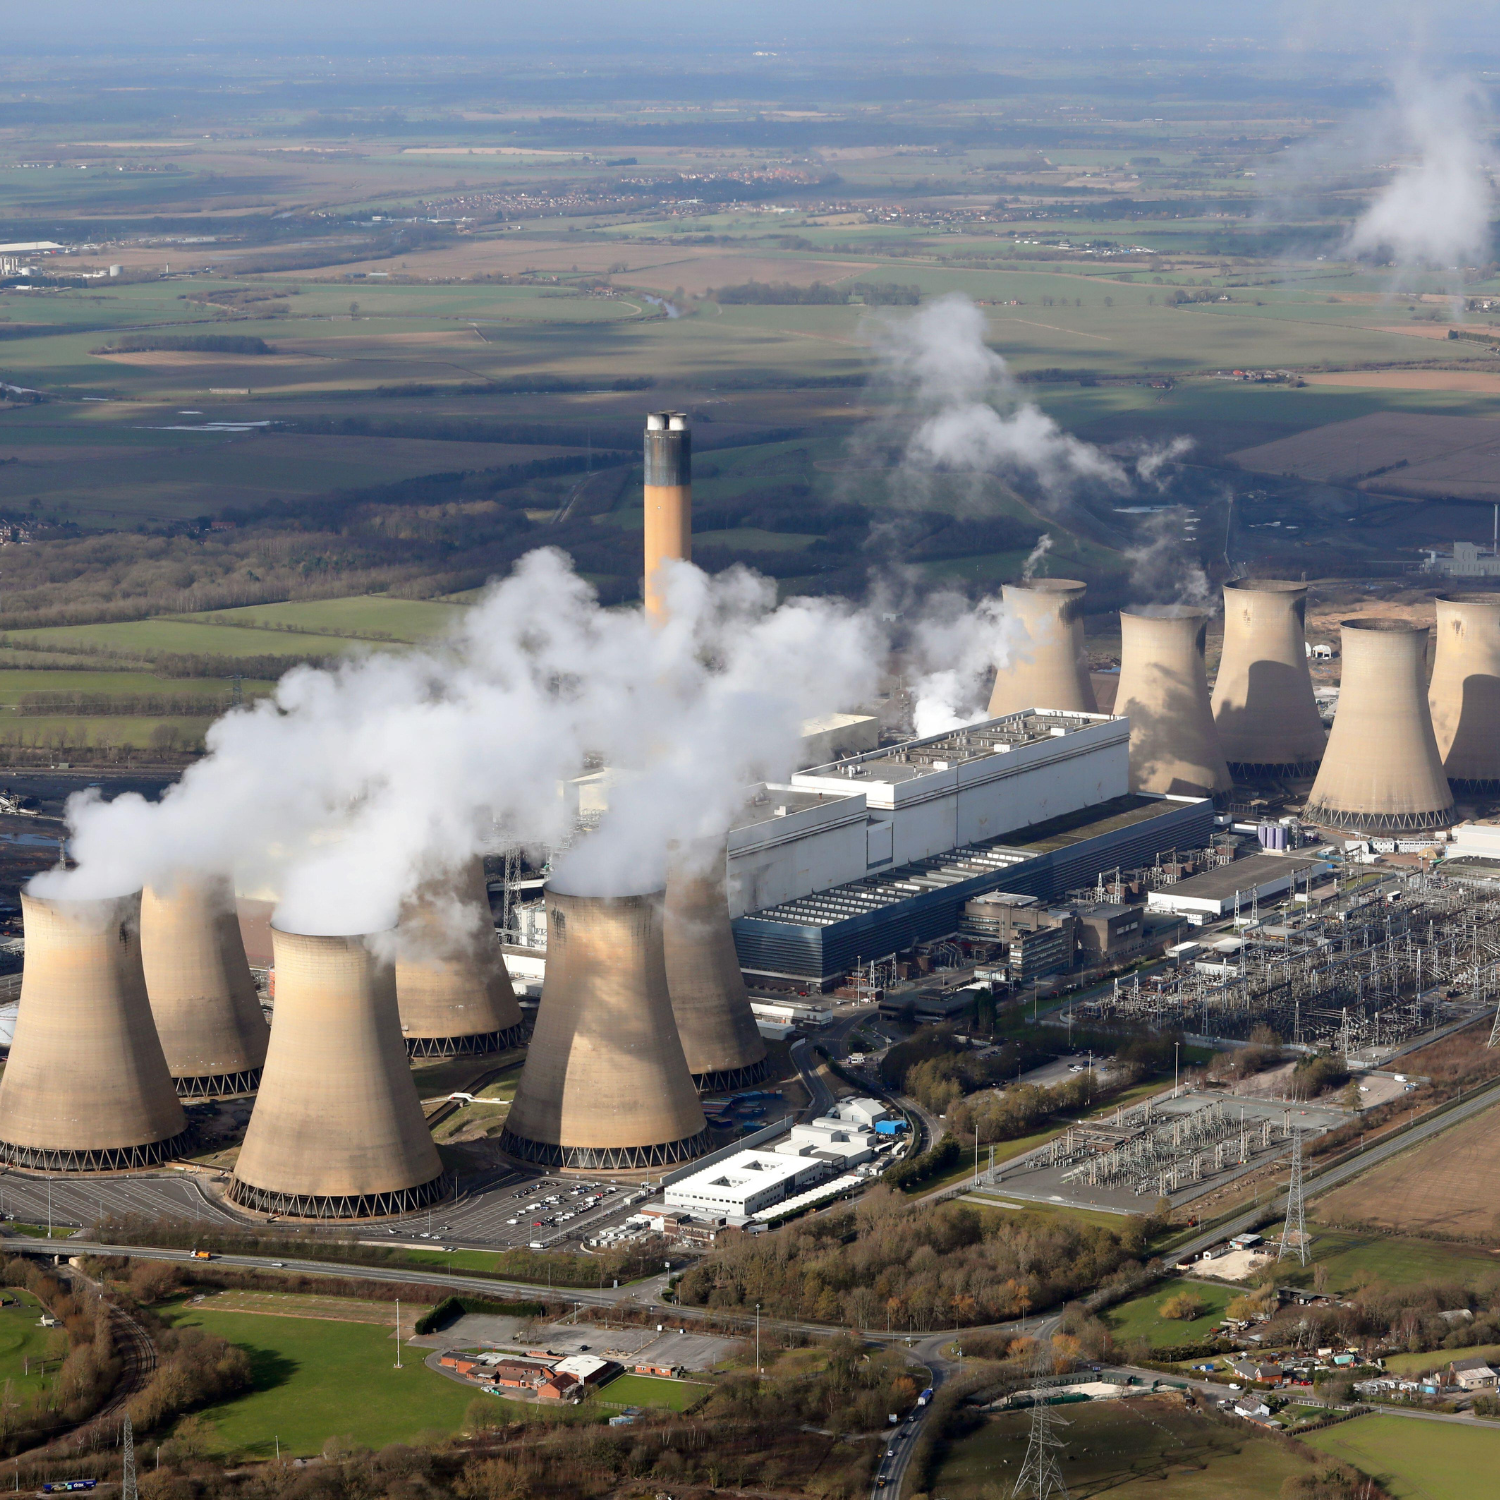
China’s coal generation increased due to hydro fall and demand increase
Wind and solar additions covered 58% (144 TWh) of the increase in China’s electricity demand. Small increases in other clean generation, such as nuclear and bioenergy, contributed less than 10% (18 TWh) of the rise in demand. New hydropower projects were also completed, but droughts saw output from hydropower fall by 22% (-129 TWh).
This hydro deficit–alongside the rise in demand that was not met by clean power generation–created a large shortfall which was filled by coal generation, which increased 8% (+203 TWh) to a new record high.
Had hydro generation been unchanged year-on-year, China’s coal generation would have increased far more slowly, as it would not have had to make up for the large hydro deficit of 129 TWh. With the hydro deficit, China’s coal generation increased by 203 TWh (+8%) in the first half of 2023, compared to the same period last year. Without this deficit it would have risen by 74 TWh (+2.9%). This would have been enough to turn a rise in global coal generation of 47 TWh into a fall of 82 TWh.
It is still possible for China’s hydro output in 2023 to recover. Severe droughts started to have a negative effect on China’s hydro generation in the second half of 2022, and continued into the first half of 2023. Average or good hydro conditions in the second half of 2023 could therefore see a return to output significantly above the previous year’s levels.
China’s power sector emissions rise
Driven by the increase in coal generation, emissions from China’s power sector jumped 7.9% (+173 million tonnes of CO2) in the first six months of 2023. In comparison, global power sector emissions rose much more slowly (+0.2%). Most of the increase in China occurred from March to June. As of February, China’s power sector emissions had been 1.4% below levels seen in the first half of 2022. However, from March onwards, poor hydro conditions led to an increase in coal generation.
Whether further increases in China’s power sector emissions can be avoided depends on several factors. If wind and solar continue to increase at their current growth rates, their additions alone could soon be enough to meet all of China’s increase in electricity demand. It will then depend on other clean sources such as nuclear generation and volatile hydro conditions as well as the rate of economic and demand growth, when we see the first structural emission falls in China’s power sector.
2.2
United States
United States responsible for 13% of global solar growth in the first half of 2023
The US contributed 13% of global growth in solar generation in H1-2023, despite national growth rates (+13%) lower than the global average (+16%). At the same time, wind generation in the US fell 16%, due to worse wind conditions than in the previous year. As a result of demand falling and coal-to-gas switching, US power sector emissions fell by 64 million tonnes, which helped ensure that global power sector emissions plateaued rather than increased.
Coal-to-gas switching pushed US coal generation down
US coal generation fell by 27% (-112 TWh) in the first half of 2023 compared to the same period last year. This was a result of a switch to gas generation, which increased by 8% (+61 TWh), as well as significant falls in electricity demand of 3.4% (-72 TWh) after two years of above average demand growth. The reduction in demand in the US was caused by both slower than expected economic growth as well as milder temperatures in Q1 of 2023. Both economic growth and electricity demand are expected to rise again in 2024.
US renewables stall as wind and hydro dip
Renewable electricity generation in the US fell by 3.7% (-19 TWh) in the first half of 2023, compared to a global increase of 10%. US wind generation fell by 5.6% (-13 TWh), in contrast to a global rise of 10%. US hydro generation fell by 12% (-17 TWh), similar to the global decline of 12%. Other renewables and bioenergy saw only minor changes. US solar generation grew 13% (+13 TWh), but remained below the global trend (+16%).
This year’s fall in US hydro generation follows multiple years of hydro decline or stagnation since the peak in H1-2017, with the exception of H1-2021. Compared to H1-2017, hydro generation H1-2023 was down 23%.
The reduction in US wind generation of 5.6% is surprising given the 6% increase in wind capacity in the 12 months to June 2023. However, good wind conditions in H1-2022 caused wind generation to grow by 25%. Wind generation in H1-2023 was still up 18% compared to two years prior in H1-2020.
In addition to the 6% increase in wind capacity, the EIA reported a staggering 25% increase in US solar capacity in the 12 months leading up to June 2023. Solar and wind generation look poised to increase substantially, depressing coal generation further if hydro conditions remain at current levels or improve.
Fall in US power sector emissions due to lower demand and coal to gas switch
The substantial fall in coal generation caused US power sector emissions in H1-2023 to fall 8.6% (-64 million tonnes of CO2). The fall in US emissions is equivalent to 1.1% of global power sector emissions and contributed to global sector emissions plateauing with an increase of just 0.2% (12 million tonnes of CO2) in the first half of 2023.
Due to the continued additions of renewables, power sector emissions in the US have been structurally falling for more than a decade. For the full year of 2022, power sector emissions were 17% below the level 10 years earlier in 2013. However, the falls in H1-2023, although significant, are still lower than previous falls seen in the pandemic year of H1-2020, or H1-2016 when coal consumption decreased as gas and oil increased. For the US to continue with significant emissions declines, it cannot rely on demand reductions to drive falls in fossil generation. Instead, a fast build of wind and solar is required to meet new electricity demand and drive fossil generation out of the mix.
2.3
European Union
Decline in EU fossil generation contributes to plateau of global power sector emissions
EU electricity demand continued to fall in the first half of 2023, slowing global demand growth. The EU contributed 11% of global growth in wind and solar generation in H1-2023, despite the fact that its growth rates were lower than the global average. As a result of demand falling and renewables increasing, fossil fuel generation fell dramatically. Consequently, the EU’s power sector emissions fell by 59 million tonnes (-17%), which helped ensure that global power sector emissions plateaued rather than increased.
2.4
India
2.5
Japan

Related Content