Global Electricity Mid-Year Insights 2023 | Ember

Chapter 1:

Global analysis

Global power sector emissions plateaued

Global power sector emissions remained almost unchanged in the first half of 2023, as wind and solar continued to increase their share in the world’s power mix. However, adverse hydro conditions–likely exacerbated by climate change–prevented emissions from falling in the first half of 2023.

The global power sector produced 5,795 million tonnes of carbon dioxide (mtCO2) in the first half of 2023, almost unchanged from the same period last year, with a slight increase of 0.2% (+12 mtCO2).

The plateau in 2023 is notable. Historically, power sector emissions have been rising structurally. There have only ever been falls during global economic shocks such as the 2008 financial crisis or the 2020 Covid-19 pandemic.

Major high-income economies saw some of the biggest falls in emissions. Emissions fell in the EU by 17% (-59 mtCO2), in the US by 8.6% (-64 mtCO2), in Japan by 12% (-25 mtCO2) and in South Korea by 3% (-3.6 mtCO2). India saw a slower increase in emissions, with emissions rising by 3.7% (+19 mtCO2) in the first half of 2023 compared to a 9.7% increase (+45 mtCO2) in the same period last year. In China emissions rose by 7.9% (+173 mtCO2), in large part due to poor hydro conditions.

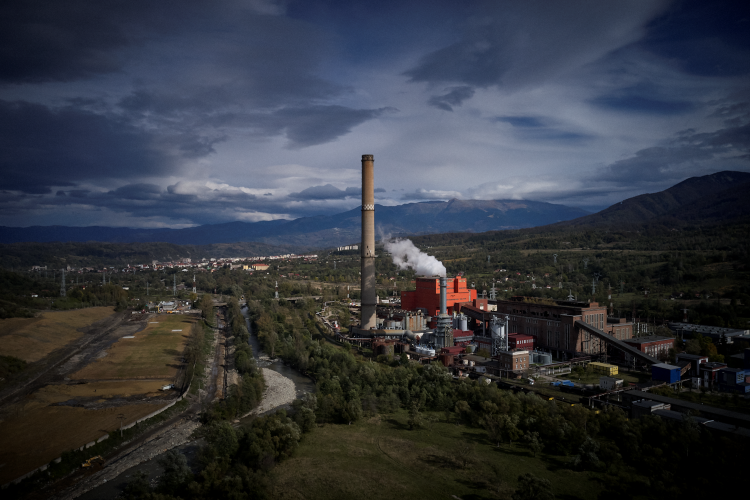
Global fossil generation remained almost unchanged

Fossil fuels generated 59.9% of global electricity in the first half of 2023 (8,100 TWh), compared to 60.1% in the same period last year (8,091 TWh).

Global fossil fuel generation remained almost unchanged, rising by only 0.1% (+9 TWh) in the first half of 2023, compared to the same period last year. Coal generation increased by 1% (+47 TWh), gas generation rose by 0.5% (+14 TWh) but other fossil fuel (mainly oil) generation fell 15% (-52 TWh). Changes at the regional and country level varied significantly.

Japan and the EU were the only two high-income, high-polluting economies that saw a fall in both coal and gas. In contrast, in the US coal fell but gas generation increased.

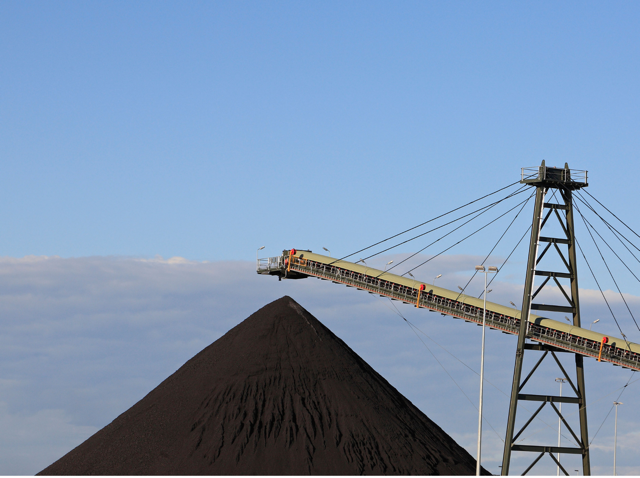
Coal generation fell in some major high-income economies in the first half of 2023: the EU (-23%, -49 TWh), the US (-27%, -112 TWh), Japan (-7.4%, -10 TWh) and South Korea (-2.5%, -2.2 TWh). These falls were driven by the falls in electricity demand in these countries, and in the US also because of the coal-to-gas switch.

Elsewhere, coal fell in Chile (-33%, -3.8 TWh) despite demand slightly increasing (+0.5%, +0.2 TWh). Coal generation also decreased in South Africa (-9.8%, -10 TWh).

In contrast, coal generation increased in China (+8%, +203 TWh) and India (+3.8%, +23 TWh) and some other developing nations.

Gas generation fell in the EU (-13%, -33 TWh). Gas generation also fell in Japan (-17%, -28 TWh), and in India (-3.4%, -0.5 TWh), but increased in the US (+8.1%, +61 TWh) and in China (+8%, +9.7 TWh). In the US, gas generation has been increasing since 2005 while coal has been declining, a trend that is expected to continue at least in the near-term.

Generation from other fossil fuels, mainly oil, fell globally, with falls including the EU (-12%, -3.8 TWh), Japan (-22%, -6.1 TWh) and the US (-8.5%, -1.6 TWh) among many other countries.

The first half of 2023 saw a historic decline in global hydro generation of 8.5% (-177 TWh), caused by droughts which were likely exacerbated by climate change. The fall in the six months to June was larger than any decline recorded across a full year in the last two decades. Three-quarters of the fall came from China (-129 TWh). As a result, hydro generated 14% (1,898 TWh) of global electricity in the first half of 2023, compared to a share of 15% (2,075 TWh) in the same period last year.

The adverse hydro conditions prevented a fall in global power sector emissions. Had hydro generation remained at the same levels seen in H1-2022, fossil generation would have not had to compensate for the hydro deficit of 177 TWh. Instead of a small rise, fossil generation would have fallen 168 TWh, leading to a fall in power sector emissions of 2.9% (-119 million tonnes of CO2).

The decline in hydro came despite additions in hydro capacity, as a result of worse hydro conditions in China, the US, India and other countries. This is evident in the capacity factor, which shows the actual output relative to the theoretical limit of the existing capacity. The first half of 2023 saw dramatic falls in the global capacity factor of hydro generation, which fell to 35.6%, nearly four percentage points lower than in H1-2022. Although the capacity factor for hydro fluctuates significantly between the first and second half of the year due to seasonal variations, H1-2023 represents a dramatic fall compared to historical values. Across the last 10 years, the average global capacity factor was 40.9%. This new low in 2023 comes after the global hydro capacity factor already hit two consecutive all-time annual lows in 2021 (39.6%) and 2022 (39.4%).

The hydro issues were particularly notable in China, where last year’s droughts and ongoing heat waves in 2023 affected reservoir levels and hydro output. China’s hydro capacity factor fell to 30.5% in H1-2023, ten percentage points below the first half of last year and the lowest value seen since at least 2015. With China representing nearly a third of the world’s hydro generation (30% in 2022), conditions in China strongly influence global hydro output.

2023 as a whole is likely to set a record for the lowest global hydro capacity factor in recorded history if conditions don’t substantially improve in the second half of the year.

Uncertainty around structural decline in hydro conditions

The global long term outlook on the effect of climate change on hydro output is uncertain as effects of climate change on hydro potential are geographically varied. Changes in rainfall patterns and intensity as well as increased evaporation will affect hydro output both positively and negatively depending on the region. The IPCC’s AR6 WGII report states that by 2080, climate conditions could affect production between +5% and -5% under a high emissions scenario. While central Africa, India, central Asia and northern high latitudes are expected to have higher hydropower potential, southern Europe, the southern US and others could see their hydro potential worsen.

Many countries are experiencing lower hydro output than at the start of the century. Recent years have been marked by periods of droughts and reduced hydro output, notably in China, Europe, and other regions. However, the historical long-term trend regarding global hydro conditions remains ambiguous, with significant regional disparities in the impacts of structural factors like climate change on hydro conditions.

It is true that the global capacity factor for hydro has seen a slight downward trend in the last two decades. However, at the same time, India, Russia, Sweden and China have seen their capacity factor increase over this time period, the latter even holds when accounting for China’s recent downturn. Consequently, it is difficult to predict future trends for hydro generation at a global level.

What the hydro lows mean for the electricity transition

This year’s record fall in hydro generation is a warning shot that hydro output could negatively affect the speed of the electricity transition.

In the IEA’s net zero scenario, hydro generation would have to rise by 4% annually from 2021 to 2030 to be on track for net zero emissions by 2050. However, this has not been met in either 2021 (-2.2%), 2022 (+1.3%) or H1-2023 (-8.5%).

When hydro generation remains below expectations, it leaves a deficit that new low-carbon electricity (mostly wind and solar) has to make up for in addition to meeting additional electricity demand and replacing fossil fuels. Only when sources like wind and solar grow fast enough to overcome both the uncertainty of output from other clean sources as well as growing electricity demand will we see substantial reductions in fossil generation and emissions.

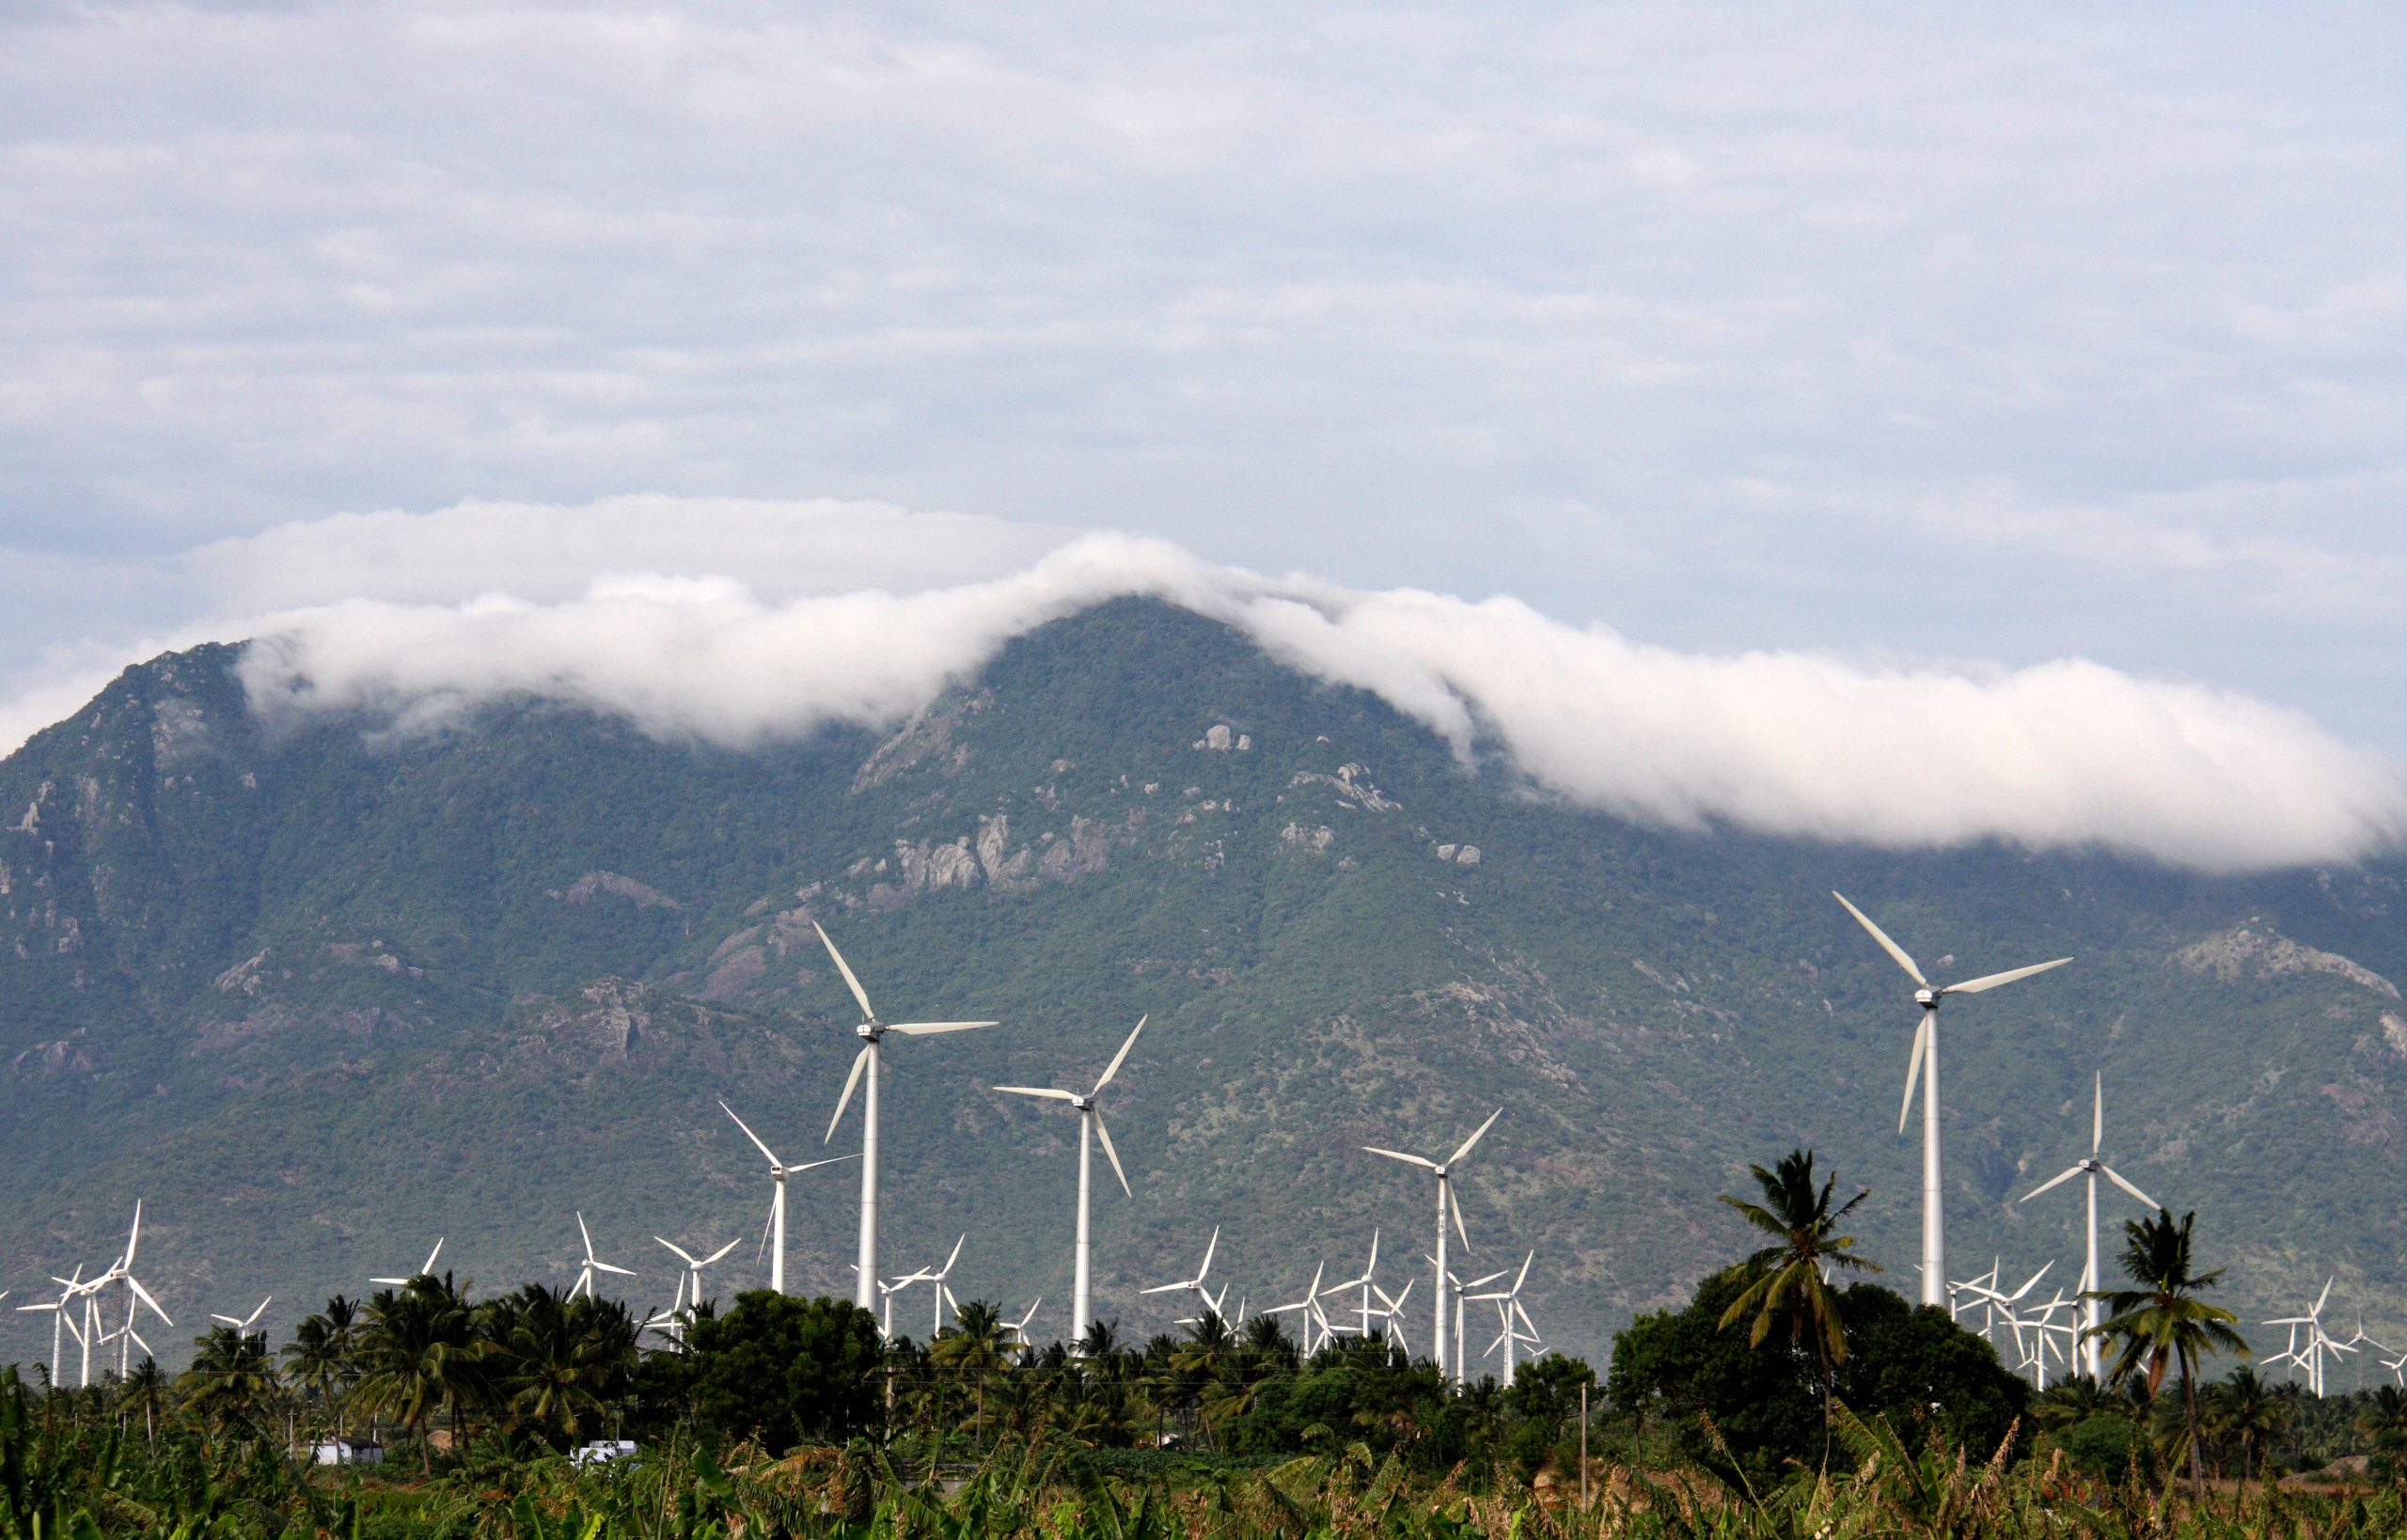
Wind and solar were the only two electricity sources that significantly increased their share in the global power mix. Together wind and solar generated 14.3% of global electricity in the first half of 2023 (1,930 TWh), a 1.5 percentage points increase from the same period last year, when they generated 12.8% of global electricity (1,717 TWh). In the first half of 2023, 5.5% of global electricity came from solar and 8.8% from wind.

Globally, wind and solar both grew in H1-2023 compared to the same period last year, although at a slower rate than they did last year. Wind generation increased by 10%, lower than the growth in the same period last year (+16%). Solar generation rose 16%, also lower than the 26% increase in the same period year. Such increases are below the growth needed for net zero, which requires a yearly average growth of 17% for wind and 24% for solar, according to the IEA’s net zero scenario.

In absolute terms, wind and solar gain also remained below last year’s level: solar grew by 104 TWh compared to 132 TWh in the same period last year. Wind generation increased by 109 TWh compared to gains of 147 TWh in the same period last year.

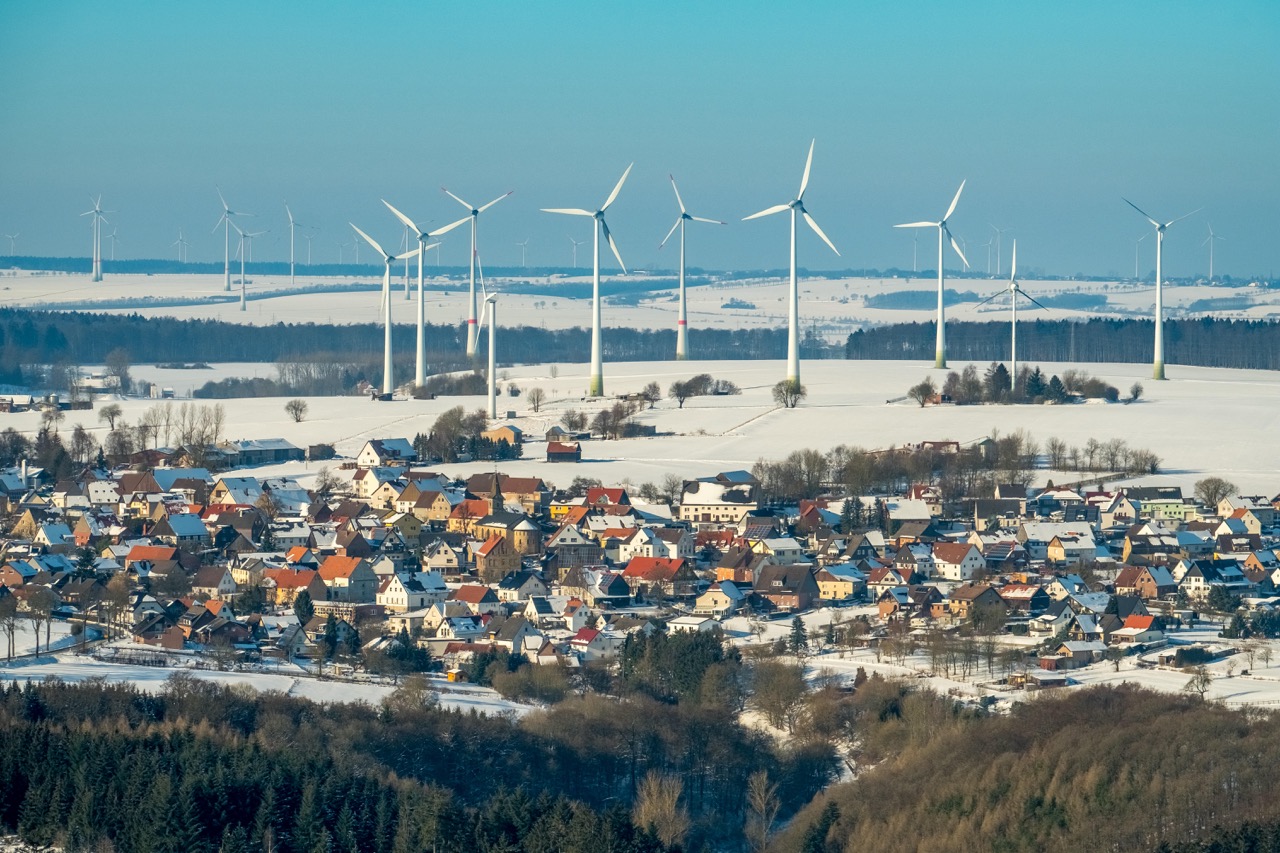
China remains a global leader in wind and solar

China accounted for 91% of global growth in wind power and 43% of global growth in solar generation in the first half of 2023. The next largest contributors were the EU and India, who each accounted for 12% of global growth in solar generation.

The EU, US and Japan are lagging behind China’s progress on wind generation. China achieved a 26% growth in wind generation in the first half of 2023 compared to the same period last year. In comparison, wind generation only grew 4.8% in the EU, while Japan recorded only a 2.4% increase from an already low baseline. The US saw wind generation fall 5.6% due to poor wind conditions.

Similar to wind, the EU, US and Japan are also lagging behind China’s progress on new solar generation. China’s solar generation grew by 21% in the first half of 2023 compared to the same period last year. India, however, had an even higher growth rate (+26%) in the first half of 2023, but from a much lower base than China. In comparison, solar generation grew only 13% in both the EU and the US, while it fell in Japan by 2%.

Solar generation growth lower than expected given capacity additions

Based on capacity addition estimates by the IEA, it would have been expected that solar generation would increase by around 140-160 TWh in the first half of 2023. Therefore, the actual observed increase in solar generation of 104 TWh is 26-35% below the expectation.

The difference in expectations compared to actual growth can partially be explained by weather conditions. Another possible reason is an increase in unmeasured behind-the-metre capacity being installed on rooftops, which can lead to lower reported demand as well as underreporting in actual solar generation and growth.

50 countries hit new monthly records for solar generation

Despite slower-than-expected solar generation growth, 50 countries across the globe experienced new monthly records for solar generation in the first half of 2023.

In Asia, China and India were among those with new monthly records. For example, China generated 50 TWh (6.4% of its electricity) from solar in June 2023, an increase of 9.7 TWh when compared to June 2022. The electricity generated from solar in China in just the month of June (50 TWh) would be enough to power a country like New Zealand, Qatar or Hungary for a whole year. India achieved a new record in May 2023, generating 10.8 TWh (7.3% of its electricity) from solar, an increase of 2 TWh compared to May 2022.

In the EU, 24 of the bloc’s 27 members saw new solar highs as of June. For example, the Netherlands generated 3.5 TWh (36%) from solar in June 2023, compared to 2.3 TWh in May 2022, while Poland generated 1.9 TWh (16%) in May 2023, compared to 1.2 TWh in May 2022. Records were also broken in the US, Mexico, Brazil and Chile, among many others in the Americas and around the globe. For example, the US generated 26 TWh (7% of its electricity) from solar in June 2023, compared to 22 TWh in June 2022. Chile generated 1.7 TWh (24%) from solar in January 2023, compared to 1.3 TWh in January 2022.

Slowdown in global capacity additions for wind power

In contrast to the steady growth in annual solar capacity additions, wind capacity additions are not trending upwards. After peaking in 2020, wind capacity additions were smaller in the following two consecutive years. In 2020, 111 GW of wind capacity was installed worldwide, compared to 92 GW in 2021 and 73 GW in 2022.

As a result, the growth in wind generation has slowed in recent years. 2021 saw the largest growth in wind generation in history (+268 TWh), but this slowed in 2022 (+251 TWh) and the first half of 2023 has seen an increase of 109 TWh in new wind generation in comparison to last year.

Among major economies, the EU, the US, and Japan are lagging behind on wind growth while China was responsible for 91% of the global growth in wind generation in the first half of 2023.

There are significant barriers holding back wind deployment in many parts of the world, including permitting and grid connection delays. Additionally, as expected, temporary weather conditions affected wind generation in some countries, notably in the US in the first half of 2023, where wind generation fell by 5.6% (-13 TWh). It is clear that many governments need to take action to speed up additions in wind.

Wind and solar additions prevented major emissions increase

Wind and solar additions continue to be the main driver of the electricity transition as additions in H1-2023 avoided 142 million tonnes of CO2 emissions.

In H1-2023, wind and solar generation increased by 213 TWh compared to the same period last year. This uptick met all of the rise in electricity demand and compensated for some of the decline in hydro generation. Without this contribution from wind and solar, the shortfall would have been met by fossil fuels, resulting in a higher emission increase. Instead of a 0.2% increase in power sector emissions, equivalent to 12 million tonnes of CO2, the increase would have been 2.6%, or 154 million tonnes. Due to the growth in wind and solar generation, the potential emissions increase was reduced by 92% (-142 million tonnes of CO2), which is equivalent to more than the total power sector emissions of South Korea in H1-2023.

This dynamic is especially evident in China. Without wind and solar additions meeting the 6% increase in electricity demand, fossil fuels would have met the demand increase instead, resulting in an emissions increase of 285 million tonnes of CO2 (+13%). Instead, China’s power sector emissions rose by 173 million tonnes of CO2 (+7.9%).

In India, wind and solar growth prevented an increase of 11 million tonnes of emissions. Power sector emissions rose by 19 million tonnes of CO2 (+3.7%), instead of a potential 30 million tonnes of CO2 (+5.7%) if wind and solar had remained at the same level as in H1-2022.

In the EU, power sector emissions fell, as lower demand reduced the need for some fossil generation. Additions in wind and solar reduced fossil generation further. Emissions fell by 17% (-59 million tonnes of CO2). Without wind and solar additions, they would have fallen by 13% (-44 million tonnes of CO2).

Global electricity demand rose only 0.4% (+59 TWh) in the first half of 2023; a much lower rise than 2.8% in the same period last year. The increase is also lower than the yearly historical average over the last decade of 2.6%. Such low growth was driven by demand falls in a number of mature economies, and by lower than expected demand growth in India. Electricity demand fell by 5.6% in Japan, 4.6% in the EU, 3.4% in the US and 1.4% in South Korea. Such falls in demand contributed to reducing emissions in each of these countries and to flattening emissions at the global level.

Demand falls in high income economies were due to varying reasons. In the EU, the electricity demand falls have continued since March 2022 in the wake of Russia’s invasion of Ukraine. The fall in the first half of 2023 is larger than the falls due to the Covid-19 pandemic in 2020. Since 2022, the demand falls can be attributed to a combination of factors: policy measures aimed to reduce demand amidst the energy crisis and security of fossil gas supply concerns, a large cut by energy-intensive industries, mild weather in winter, and reduced personal electricity use due to a cost of living crisis. Under-reporting of behind-the-meter solar generation is also leading to some misattribution, showing electricity demand falling, instead of solar rising. This is a problem in many European countries, made apparent by the unprecedented surge in new rooftop solar installations. In the US, demand fell due to slower economic activity and milder weather. In Japan, demand fell due to milder weather but also due to some electricity saving measures.

Demand increased in China and India as these countries continue to advance their economies. In China, electricity demand increased by 6%, in line with national estimates for 2023 and similar to the historic average for 2012-2022 (+5.9%). In India, demand increased by 3.1%, which was lower than the average growth for 2012-2022 (+5.4%) and much slower than the 11% growth seen in the same period last year, when the country was recovering from Covid-19 lockdowns as well as experiencing some heatwaves.

Slow demand growth, and especially the falls seen in some mature economies, is unlikely to continue to the same level in the future. As countries electrify their economies, their electricity demand is likely to increase, even as efficiency improves. This means that countries cannot rely on falling demand to reduce emissions from the power sector. Instead they need to increase their clean electricity sources. At the same time, electricity demand is expected to increase across rapidly-growing economies, including China and India, as they continue to advance their economies and increase access to electricity.

Back to
Contents
Next Chapter
2: Country and region analysis
Share