Chapter 2:
Data
Trends in global electricity
Analysis of the different global electricity sources in 2021
The following pages run through a more detailed analysis of the changes in supply of electricity over the last twelve months, and over a longer trend period. All of the graphics can be reproduced by accessing our Data Explorer which now includes 2021 data.
We have ordered the sections according to the fastest growing sources of electricity.
2.1
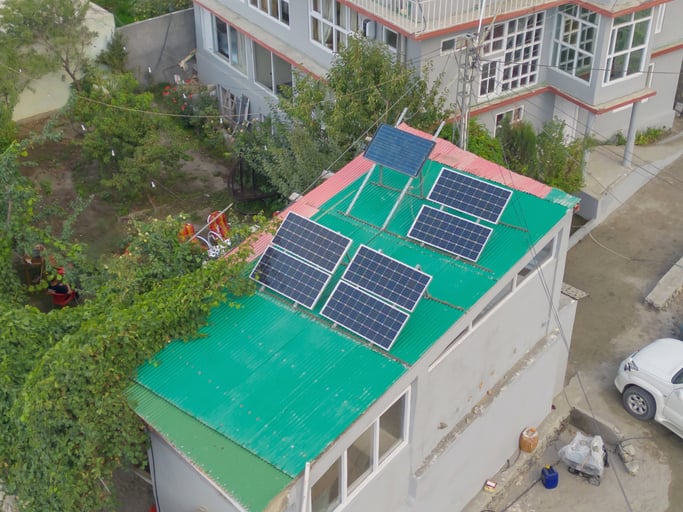
Solar
2.1
Solar
Change in 2021
Global solar generation rose 23% in 2021. It was the fastest rising source of electricity generation for the 17th year running. Generation rose year-on-year by 188 TWh to 1023 TWh.
Long term trend
Solar generated 3.7% of the world’s electricity in 2021. This was up from just 1.1% in 2015, when the Paris Agreement was signed.
Leaders
Australia, with 12%, has the highest proportion of its electricity from solar of any major country in the world. Meanwhile, Viet Nam saw the biggest rise from 2% in 2020 to 10% in 2021. In Europe, Spain and the Netherlands saw the biggest growth, bringing their share to almost 10% of their total electricity.
Laggards
Only 1% of global solar generation is in African countries and 2% in Middle Eastern countries (having 3% and 4% of global electricity demand respectively). India’s solar generation saw its smallest year-on-year increase since 2016. Many eastern European countries have paused, with similar levels of solar generation in 2021 as to 2015 – notably, Bulgaria, Czechia, Romania, Slovakia and Slovenia.
On target for net zero?
Solar generation needs to rise 7-fold by 2030, taking it from 4% of global electricity in 2021 to 19% by 2030. That means maintaining year-on-year growth of 24%; growth last year was 23%, and averaged 33% over the last ten years.
2.2
Wind
2.2
Wind
Change in 2021
Global wind generation rose 14% in 2021, rising by 227 TWh to 1,814 TWh. This was the highest % growth rate in 4 years, and the highest absolute increase ever. It was the fastest-growing source of electricity after solar.
Long term trend
Wind generated 6.6% of the world’s electricity in 2021, up from 3.5% in 2015, when the Paris Agreement was signed.
Leaders
China was without doubt the wind leader of 2021. 65% of the growth in global wind generation in 2021 was in China (China’s previous highest proportion was 37% of global growth in 2020). It added 148 TWh, the same as the entire electricity demand of Argentina. The large build-out of offshore wind in December 2021 will ensure this growth continues into 2022. Denmark had the biggest share of its electricity from wind (48%); the UK and Germany were both over 20%. Although the EU saw wind generation fall in 2020 due to poor wind speeds, the rate of wind installations hit a new record. Kenya saw the biggest year-on-year rise, from 11% to 16% of its electricity from wind. There are four countries in a race to embrace wind, roughly doubling from 5% of annual generation in 2015 to 10% in 2021: the US (5% to 9%), Australia (5% to 10%), Turkey (4% to 9%) and Brazil (4% to 11%).
Laggards
Only 1% of global wind generation is in African countries and 0.1% in Middle Eastern countries (having 3% and 4% of global electricity demand respectively). In India, wind generation equaled solar for the first time, having always been in front. South Korea and Japan both had less than 1% of their electricity from wind.
On target for net zero?
Wind generation needs to rise 4-fold by 2030, taking it from 7% of global electricity in 2021 to 21% by 2030. That means maintaining year-on-year growth of 18%; growth last year was 14%, and averaged 15% over the last ten years.
2.3
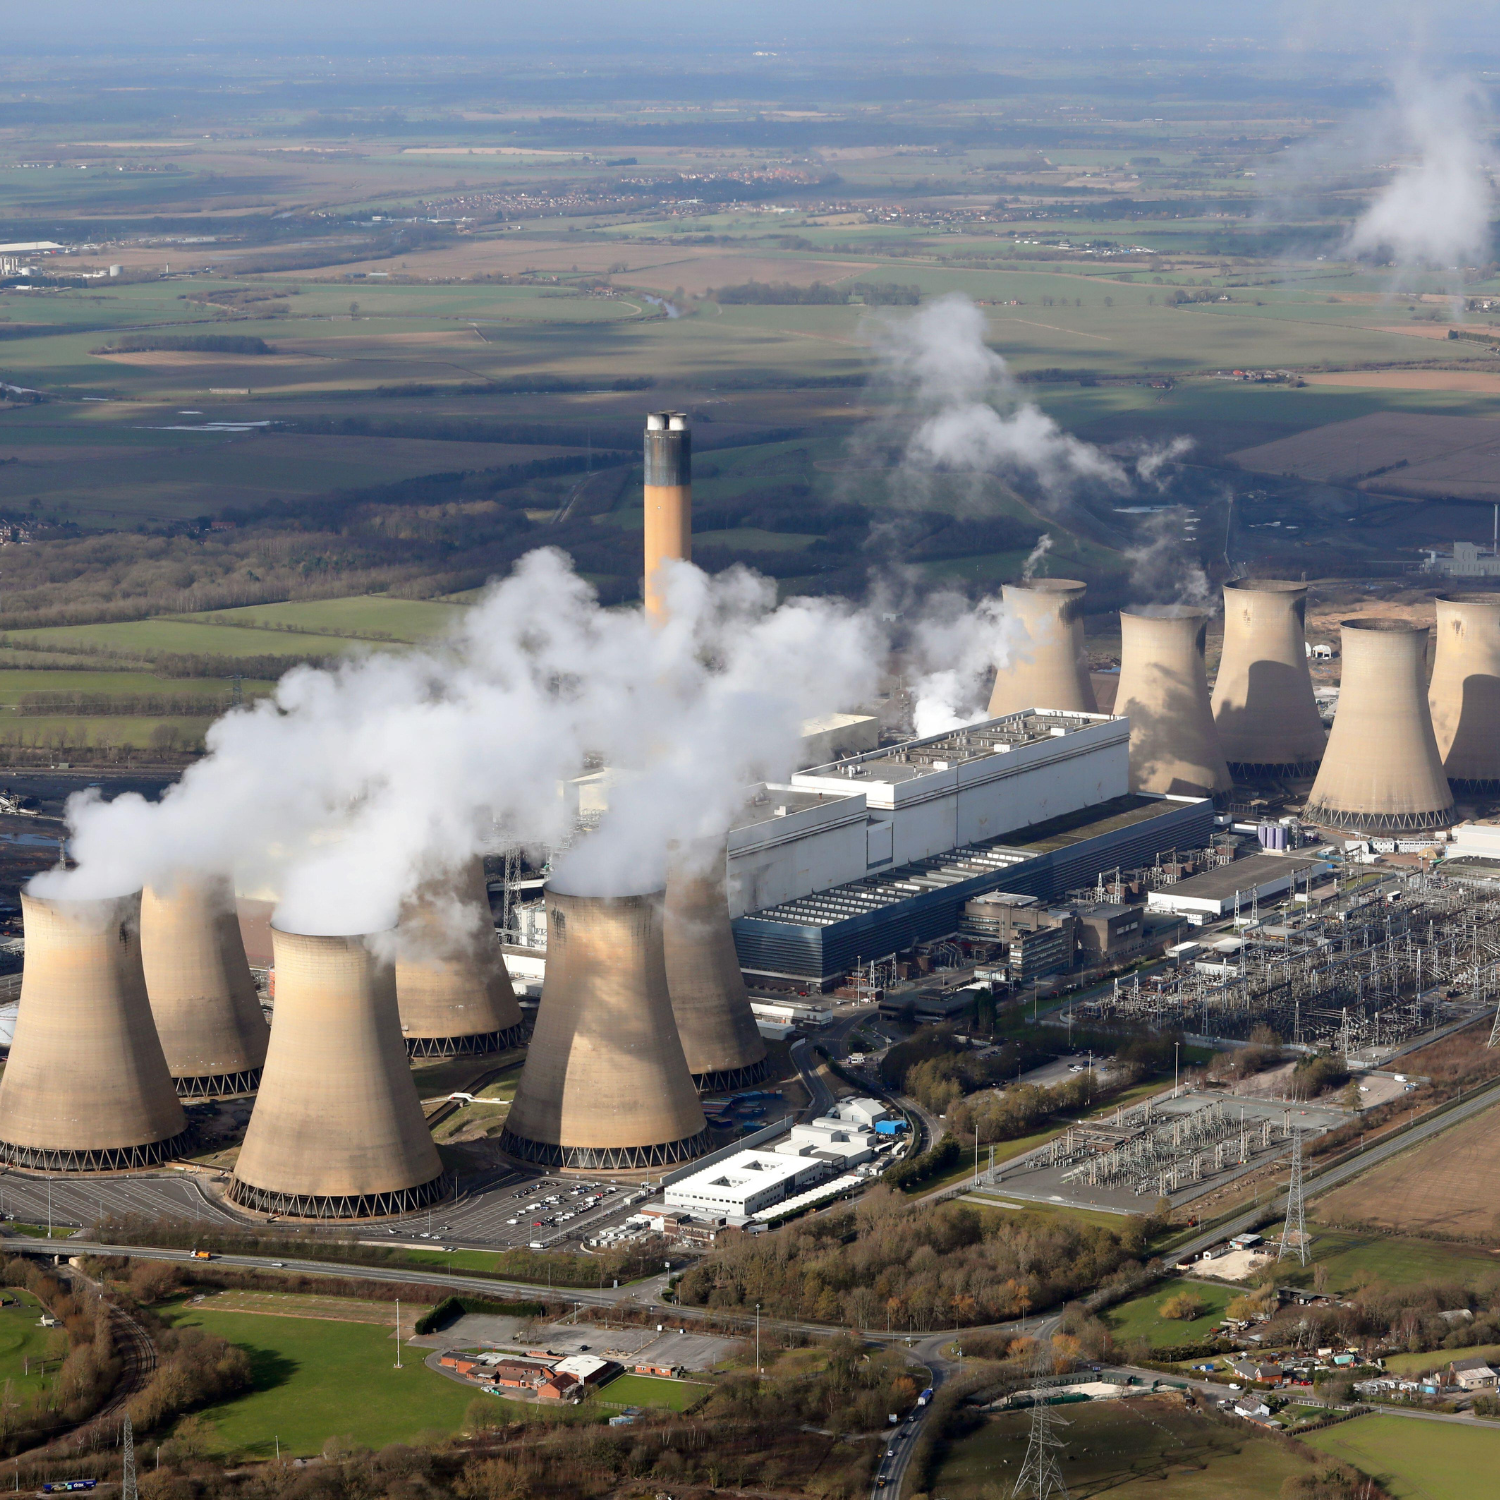
Coal
2.3
Coal
Change in 2021
Coal generation rose by 9% 2021 to an all-time high, beating the previous record set in 2018 by 2%.
Long term trend
Unfortunately coal generation is 10% higher than in 2015 when the Paris Agreement was signed. China’s coal generation was 33% higher in 2021 than 2015; the total for the rest of the world fell by 8%. Consequently, China’s share of global coal power rose from 44% to 54%.
Leaders
China saw the biggest rise in coal in 2021, rising by 466 TWh, about the same as Japan and South Korea’s combined coal power generation in 2021. It was China’s fifth year in a row of setting a new coal power record. India is the world’s second largest coal power generator, and its coal power increased by 11% in 2021, setting an all-time high by beating the previous record in 2018 by 4%. There were all-time coal power records set in other Asian countries in 2021: Kazakhstan (+6%), Mongolia (+13%), Pakistan (+8%), and the Philippines (+8%).
Most countries in Asia are seeing rapid demand growth, so although absolute coal generation is increasing, the proportion of electricity from coal is actually falling.
On target for net zero?
Definitely not. Coal power must fall by 13% every year this decade. That means reducing its share of global electricity from 36% in 2021 to 8% by 2030.
2.4
Bioenergy
2.4
Bioenergy
Change in 2021
Global generation from bioenergy rose by 6% in 2021 to 646 TWh. It must be noted that – of all the fuel types – the data on bioenergy is the least reliable.
Long term trend
Bioenergy has increased in line with overall electricity demand since 2015, keeping its share at 2% of global generation. In the same timeframe, solar quadrupled from 1% to 4% and wind almost doubled from 4% to 7%.
Leaders
China is by far the biggest bioenergy generator. It is also the only country – bar Japan – that is substantially increasing bioenergy production. China’s bioenergy generation has tripled since 2015, driving almost two thirds of global growth. Japan leapt past the UK in 2021 to become the #5 biggest bioenergy generator, increasing by 29% in 2021 alone. The other biggest bioenergy generators – the US in #2, Germany in #3 and Brazil #4 – showed nearly no growth from 2015 to 2021.
On target for net zero?
Bioenergy in the IEA’s 1.5 degree pathway shows a doubling from 2020 to 2030. That’s much faster growth than the last five years, which was 32%. However, the IEA assumes that the bioenergy is low-carbon; but there are big questions as to whether bioenergy is yielding the CO2 reductions it promises. Dependent on sourcing, bioenergy can be very high-carbon. More information is available in our methodology.
2.5
Nuclear
2.5
Nuclear
Change in 2021
Nuclear electricity generation rose by 4% in 2021 by 100 TWh to 2,736 TWh. France’s reactors slightly recovered from a terrible 2020, Japan restarted some reactors, and new reactors came online in China.
Long term trend
The rise in nuclear generation was smaller than the overall rise in electricity demand, so nuclear’s market share continued its gradual decline. It generated 17% of global electricity in 2000, and by 2021 this fell to 10%.
Leaders
China is the only country that is significantly increasing nuclear power as it brings new reactors online. Nuclear generation tripled in 7 years to 2021. But nuclear power still only generates 5% of China’s electricity. Russia’s nuclear generation has been slowly increasing, with a further 2% rise in 2021. Japan’s nuclear generation in 2021 rose to the second highest level since Fukushima, as reactors return online. However, generation was still only one fifth the level back in 2010. France got the largest proportion of its electricity generation from nuclear, at 69% in 2021, followed by Ukraine with 55%.
On target for net zero?
Nuclear generation needs to rise 38% by 2030, according to the IEA’s 1.5 degree pathway, keeping its market share unchanged, as electricity demand rises. That means year-on-year growth of 4% from now to 2030. The IEA shows nuclear growing much quicker after 2030.
2.6
Gas
2.6
Gas
Change in 2021
Gas generation plateaued, rising by only 1% in 2021 as other electricity sources rose aggressively. It rose by 81 TWh to 6098 TWh. As a consequence, the share of generation dropped from 23% in 2020 to 22% in 2021.
Long term trend
The rise of gas has been slow and relentless, leading to a doubling in generation from 2002 to 2020. But with the gas crisis hitting in 2021, causing gas prices to spike to record levels in many countries, generation barely increased. Is this plateau a new trend?
Leaders
The biggest rises in gas in 2021 were in Russia, Turkey and Brazil to compensate for shortfalls in hydro production due to little rain. Most of the countries with the highest amount of their electricity from gas power are in the Middle East and Africa; so as electricity demand in these regions rose, with low levels of clean power investment, gas power also rose.
Laggards
Both China and India generated only 3% of their electricity from gas in 2021. However, from 2020 these figures represent a fall of 18% in India and an increase of 8% in China. In China, gas generation has doubled since 2014. The US was responsible for 46% of the rise in global gas generation from 2015 to 2020. But 2021 saw a rare fall due to rising wind, solar and coal generation.
On target for net zero?
To meet the IEA’s 1.5 degree pathway, gas generation in 2030 cannot be significantly higher than it was in 2020. After 2030, unabated gas power must quickly reduce towards zero by 2040.
2.7
Hydro
2.7
Hydro
Change in 2021
Hydro electricity had a 2% fall in production in 2021, due to low rainfall in key countries such as China, Brazil, the US and Turkey.
Long term trend
The rise in hydro generation was smaller than the overall rise in electricity, so hydro’s market share continued its gradual decline. It generated 18% of global electricity in 2000, and by 2021 this had slid to only 15%.
Leaders
China has provided two-thirds of the growth in global hydro electricity generation since 2000, and has three times the generation of the next biggest country, Canada
On target for net zero?
Hydro generation needs to rise 40% by 2030, keeping its market share almost unchanged as electricity demand rises. That means year-on-year growth of 4% from 2021 to 2030. The last ten years grew by 2% on average.
2.8
CO2
2.8
CO2
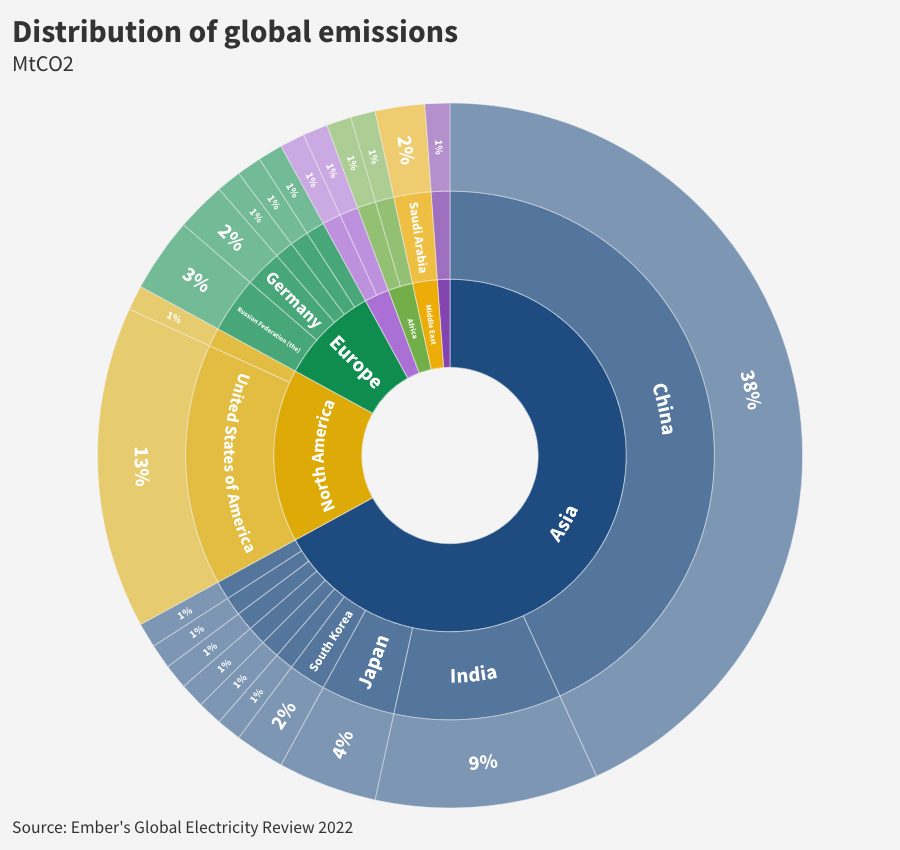
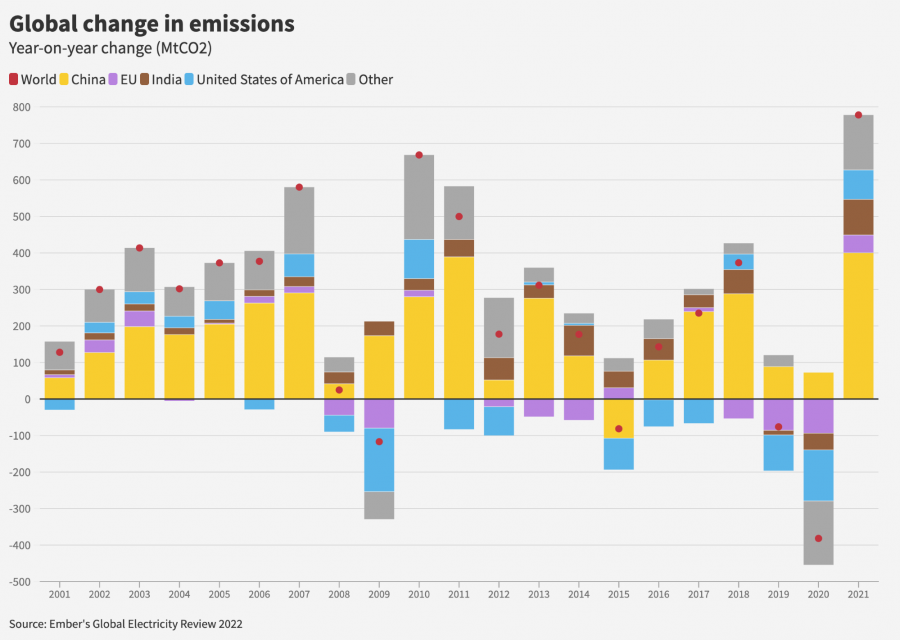
Change in 2021
The record rise in coal, coupled with a modest rise in gas generation, means power sector CO2 emissions rose by 7% (778 million tonnes) in 2021. That’s the largest absolute rise ever, and the largest percentage rise since 2010. This rise follows from a fall in 2020, but that fall was only 3%. This takes power sector emissions to a new record of over 12 billion tonnes of CO2, beating the previous record in 2018 by 3%.
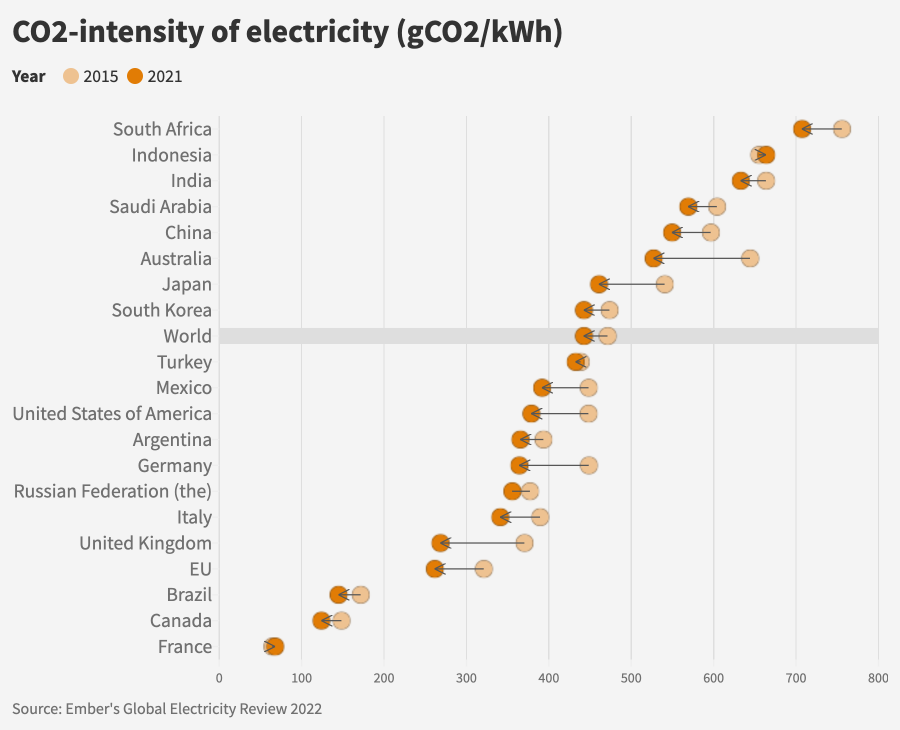
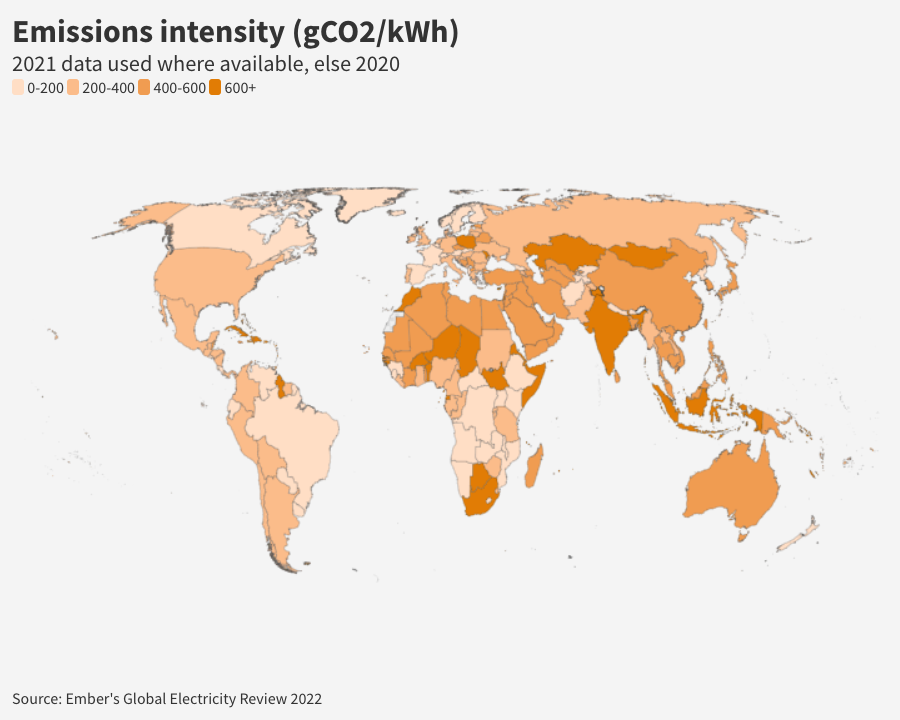
The world’s electricity got 1% dirtier in 2021, as carbon intensity increased year-on-year from 437 gCO2/KWh to 442. It’s the first year since 2011 that the world’s electricity was dirtier than the previous year.
Long term trend
Power sector CO2 emissions were 10% higher than in 2015, when the Paris Agreement was signed. However, the CO2 intensity of electricity fell by 6% since 2015. 18 of the G20 countries had cleaner electricity than in 2015.
Leaders
Half of the CO2 emissions rise in 2021 was from China. Australia saw the biggest changes to its electricity carbon intensity of any G20 country since 2015, as solar and wind replaced coal and gas generation. It fell from 644 gCO2/KWh in 2015 to 527 in 2021. It is now slightly less dirty than China’s electricity (549 gCO2/KWh in 2021). India also fell (from 663 gCO2/KWh in 2015 633 in 2021), and is now below Indonesia’s last recorded value (663gCO2/KWh in 2020).
On target for net zero?
No. The emissions growth is in sharp contrast to what is needed for the IEA’s 1.5 degrees pathway: a 60% fall in power sector emissions from 2021 to 2030.
2.9
Demand
2.9
Demand
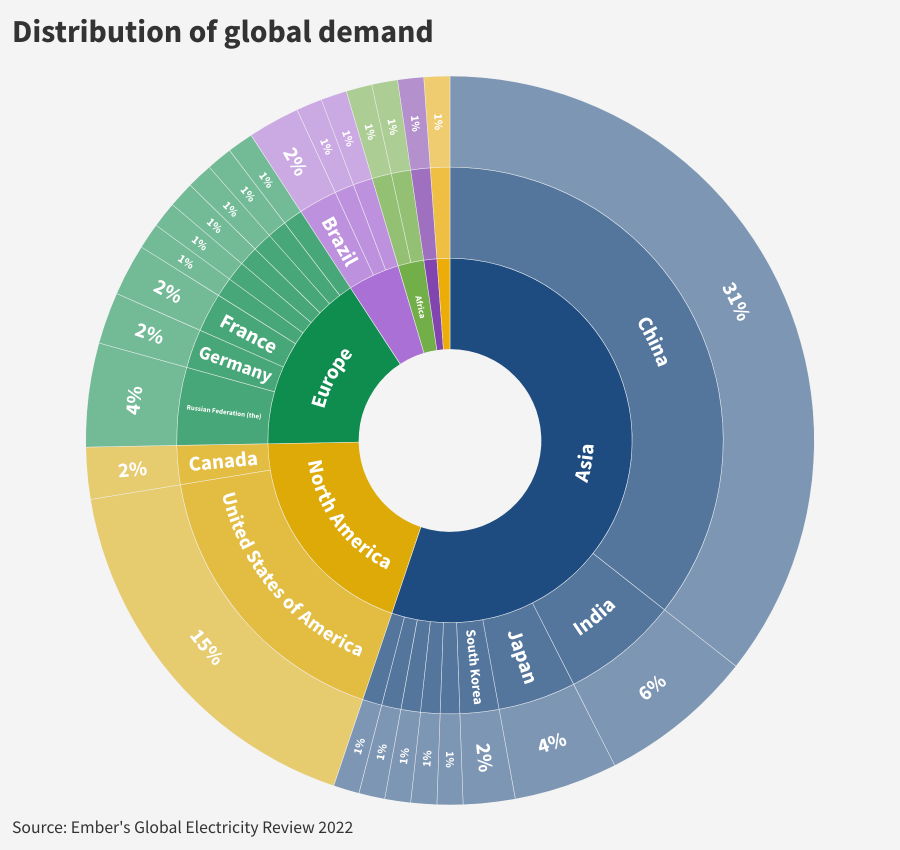
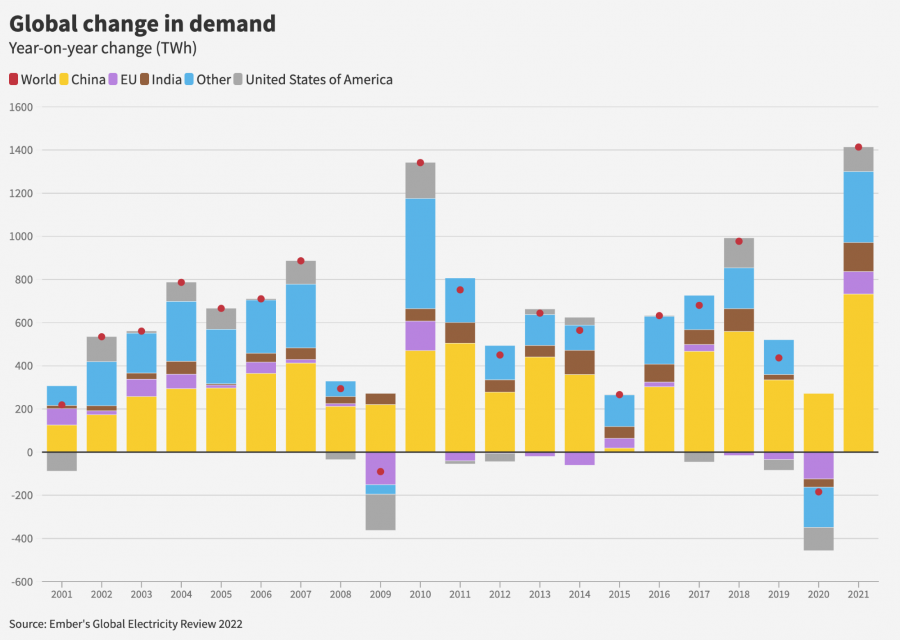
Change in 2021
Electricity demand rose by the most ever in absolute terms: 1,414 TWh from 2020 to 2021—approximately the equivalent of adding a new India to the world’s electricity demand. At 5.4%, 2021 saw the fastest demand growth since 2010. The rise followed from a small 1% fall in 2020. Many advanced countries rebounded after the fall in 2020, back to pre-pandemic levels. The real growth continues to be in Asia, in large part as economic growth boomed. In many countries, it followed on from a growth year even in 2020 when the pandemic struck. China saw the biggest rise, with 13% higher electricity demand in 2021 compared to 2019.
The world’s electricity got 1% dirtier in 2021, as carbon intensity increased year-on-year from 437 gCO2/KWh to 442. It’s the first year since 2011 that the world’s electricity was dirtier than the previous year.
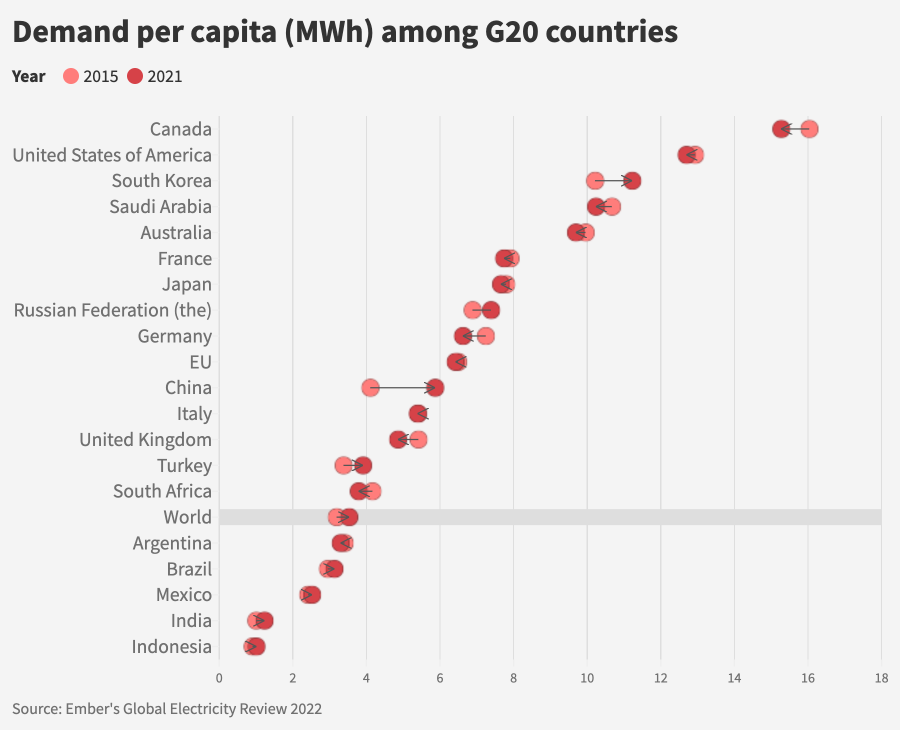
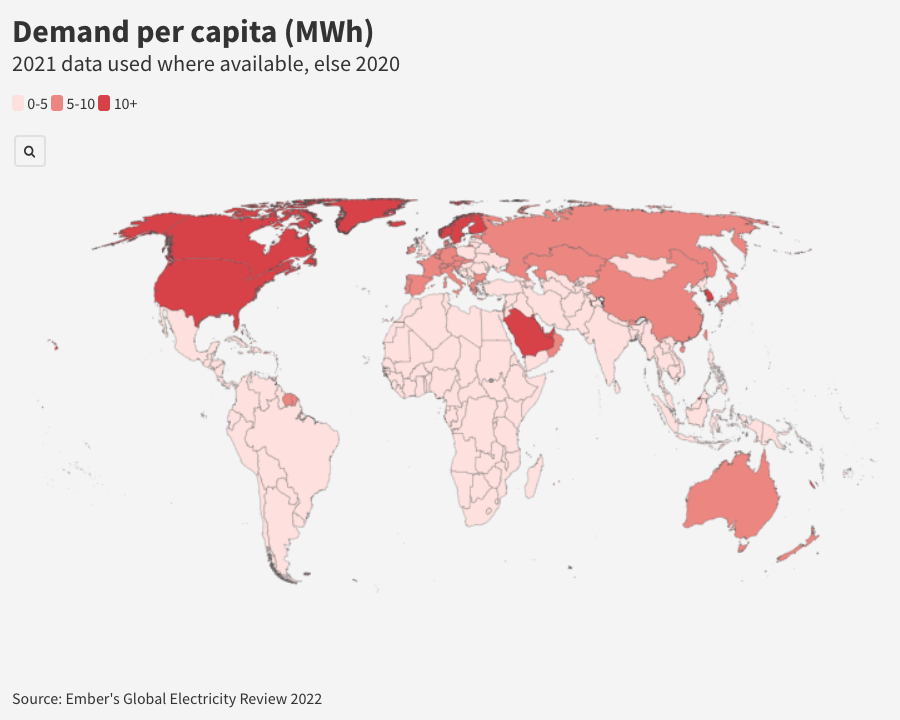
Long term trend
Countries with the highest electricity demand per capita, such as Canada, the US and Saudi Arabia, have seen a fall compared to 2015, whilst most other countries have seen increases. China has seen by far the largest increase, overtaking the per capita use for both the UK and Italy, though is still behind the US. Roughly speaking, China uses six times as much electricity per capita as India. However, it is still only half that of electricity-hungry South Korea.
On target for net zero?
What happens to electricity demand is critical for net zero. Electricity demand rises substantially (38%) from 2020 to 2030 in the IEA’s 1.5 degree pathway, as the world economy grows, and electrification reduces fuel use in other sectors. But that’s in-part offset by a massive expected improvement in efficiency. The large rise in electricity demand in 2021 suggests the world is still not learning to use electricity as efficiently as it needs to.

Related Content