Chapter 1:
Global Trends
In this chapter
Trends in global electricity
Introduction: The challenge ahead
The electricity sector shoulders the biggest burden on the pathway to keeping global heating to no more than 1.5 degrees. In May 2021, the International Energy Agency (IEA) published its monumental Net Zero by 2050 report, which shows the electricity sector needs to move from being the highest emitting sector in 2020, to being the first sector to hit net zero globally by 2040. At the same time, widespread electrification means the electricity sector will massively expand, helping to decarbonise other sectors.
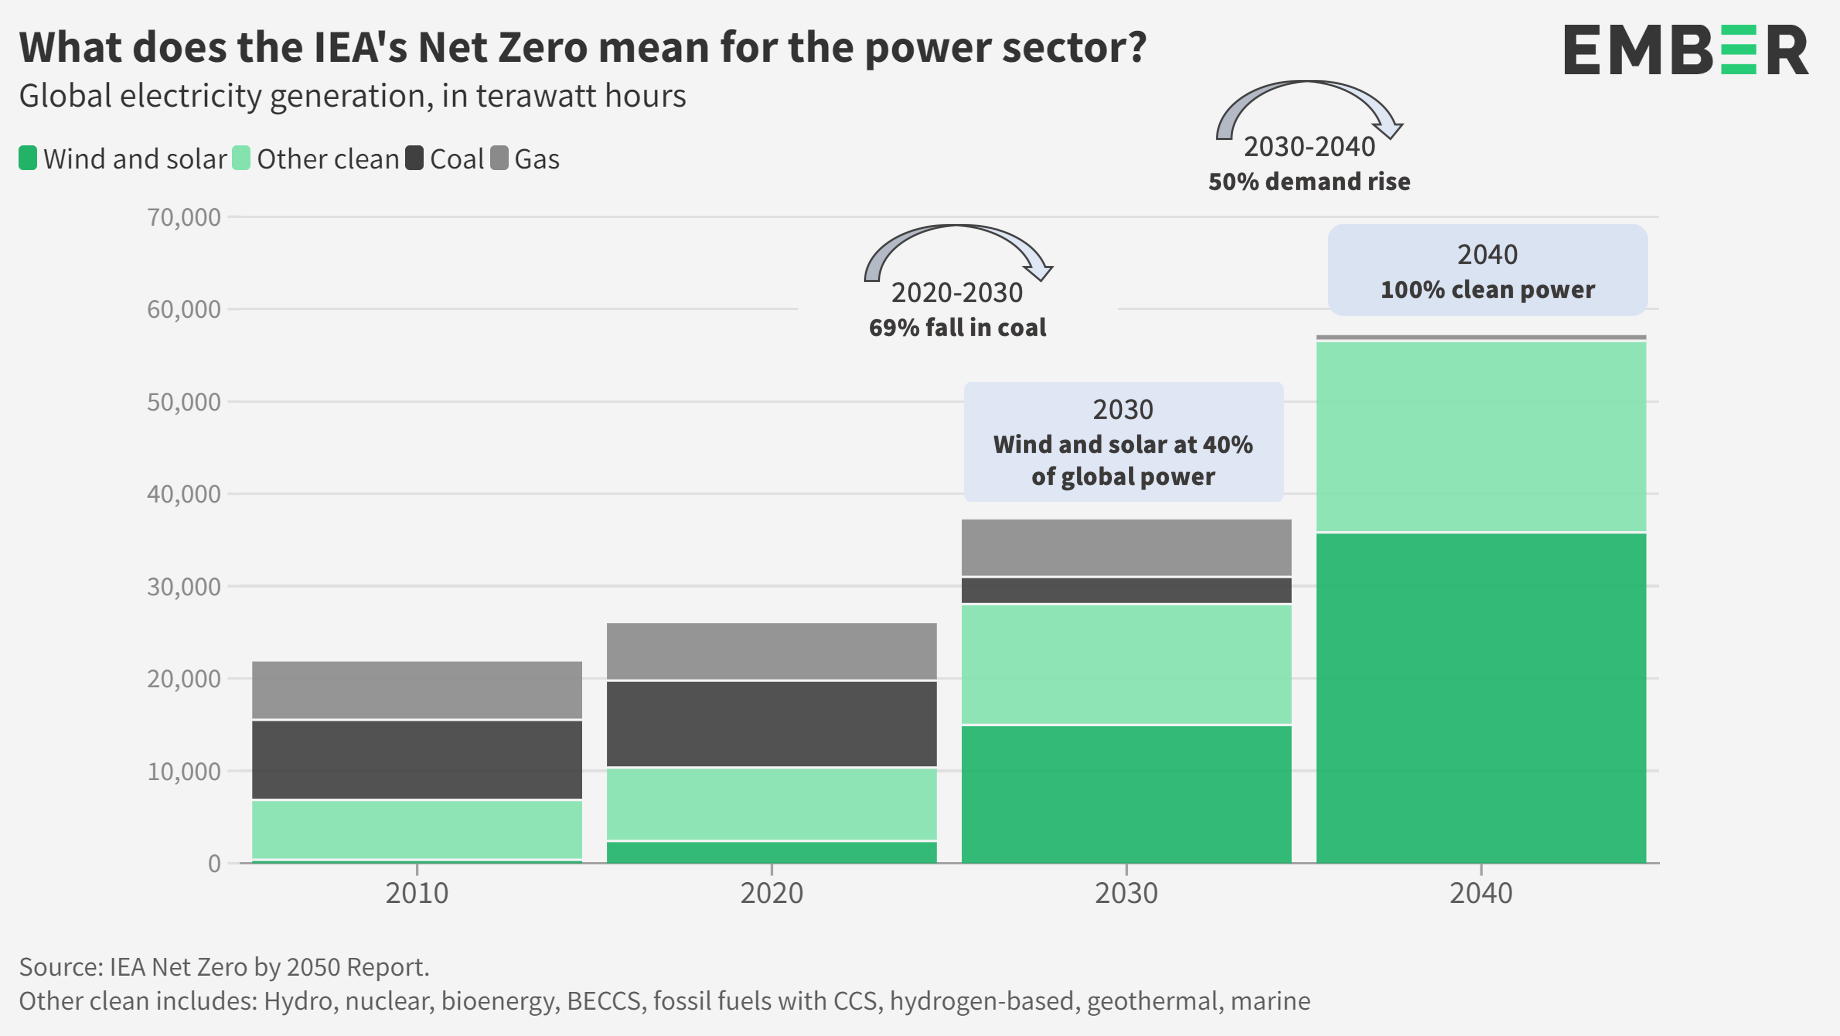
In this report, we track progress against the IEA’s Net Zero by 2050 pathway to ask the critical question: Is the electricity transition happening fast enough to keep global heating to 1.5 degrees?
1.1
Wind and solar surpass 10%
1.1
Wind and solar surpass 10%
Wind and solar now a tenth of global electricity
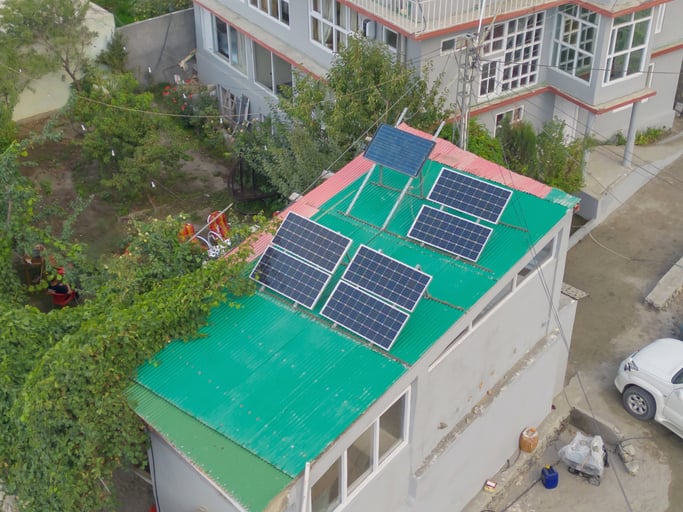
Wind and solar generated over a tenth (10.3%) of global electricity for the first time in 2021, up from 9.3% in 2020. This is more than double the market share (4.6%) from when the Paris agreement was signed in 2015. Their growth rate has also increased: wind generation rose by +14% in 2021 (the highest since 2017), and solar by +23% (the highest since 2018); combined, they rose by 17%. This wind and solar growth was slower in 2021 than last decade, when they had an average of 20% year-on-year growth.
Clean electricity sources generated 38% of the world’s electricity in 2021. Taken together, wind and solar are now the fourth largest source of electricity in the world. They were also the fastest-growing clean sources in 2021; other zero emissions sources of electricity either fell (hydro) or were roughly static (bioenergy and nuclear). Fossil fuels still generated 62% of global electricity; mainly coal (36%) and gas (22%).
50 countries now above 10% wind and solar
Fifty countries had over a tenth of their electricity from wind and solar in 2021, up from 43 in 2020 and 36 in 2019. Seven countries hit this landmark in 2021 for the first time: China (11.2% in 2021), Japan (10.2%), Mongolia (10.6%), Viet Nam (10.7%), Argentina (10.4%), Hungary (11.1%) and El Salvador (12.0%).
All five of the world’s largest economies have reached this landmark: the United States, China, Japan, Germany and the United Kingdom. Europe leads the way with nine of the ten top countries. Three countries have even exceeded 40% of their electricity from wind and solar. In 2021, Denmark, Luxembourg and Uruguay achieved 52%, 43% and 47% respectively, leading the way on technology for high renewable grid integration.
The Middle East and Africa had the fewest countries reach a landmark tenth of wind and solar. Saudi Arabia’s electricity is still less than 1% wind and solar, and the next two hosts of UN climate summits—Egypt and the UAE—have only 3%.
The countries which have transformed their electricity system the fastest since the pandemic were the Netherlands, Australia and Viet Nam. From 2019 to 2021, they switched over 8% of their total electricity demand to wind and solar. What’s more, that new wind and solar directly replaced fossil fuels. In the Netherlands, the share of wind and solar rose from 14% to 25% in just two years, whilst the share of fossil fuels fell from 78% to 63%. In Australia, wind and solar rose from 13% to 22%, whilst the share of fossil fuels fell from 79% to 70%. In Viet Nam, the share of wind and solar rose from 3% to 11%, whilst the share of fossil fuels fell from 73% to 63%. If these trends can be replicated globally, and sustained, the power sector would be on track for 1.5C.
Viet Nam’s solar boom
Viet Nam has seen unparalleled growth in solar power. This has not only reduced power sector emissions, but also reduced its costly gas import bill.
In 2021, Viet Nam saw astonishing growth in solar as it increased its generation by 337% (+17 TWh) in a single year, to become the world’s 10th largest solar generator. This solar growth meant that Viet Nam was the only country in Asia to meet and exceed its entire demand rise with new wind and solar.
The solar increase, even as demand grew, reduced fossil fuel share, with coal down from 55% to 52%, and gas from 17% to 12%—driving emissions down by a significant 6%. Viet Nam’s combined wind and solar capacity has increased by four times since 2019. Another four-fold increase to 89 GW by 2030 would be enough to match all their increase in demand even in a high electricity growth scenario.
When rapid renewables growth happens, the rest of the electricity system needs to adapt quickly, and in Viet Nam’s case, there are some key lessons.
The feed-in-tariffs were so popular they were put on hold. But to get the cheapest prices, countries need a long-term renewables policy to create a stable investment environment; stop-start policy needs to be avoided.
The grid also had problems integrating such large amounts. More upfront planning would have helped, to strengthen the grid and add sufficient interconnection, alongside flexible demand and storage capacity.
This rapid growth poses some very interesting questions in relation to plans for a new thermal plant. Viet Nam has made a high level commitment to stop building new coal plants, and yet there are still new coal plants in planning, and an incredible 56 gigawatts of planned gas power plants. The speed and cost of the solar boom, if well managed, could undermine the investment case significantly.
1.2
Growth of other clean electricity sources stalled
1.2
Growth of other clean electricity sources stalled
Growth in clean generation, other than wind and solar, stalled in 2021. Hydro fell 2% on drier conditions, especially in China. Nuclear increased 4% as existing reactors in France and Japan came back online and new reactors switched on in China and Russia. Bioenergy grew 6%, although concerns continue to be raised about its true emissions impact. Emerging technologies commonly included in Net Zero pathways still provide no meaningful electricity generation: including fossil fuels with carbon capture, hydrogen-based fuels, CSP (concentrated solar power), geothermal and marine.
Although wind and solar are the fastest growing sources of clean electricity, the IEA Net Zero by 2050 report anticipates that a quarter of the growth in clean electricity will still come from other technologies. These other technologies generally complement, rather than compete with, wind and solar. In particular, they provide benefits to the grid to support the variability of wind and solar. Stalling on these complementary technologies will make it even more difficult to achieve the emissions cuts needed by 2030. An alternative IEA scenario suggests that it’s possible to decarbonise without bioenergy and CCS, but the IEA forecast it would likely increase the cost of reaching zero carbon power.
China driving growth of hydro, nuclear and bioenergy
Growth in bioenergy, hydro and nuclear in the last 20 years was led by China. Since 2000, China has provided two-thirds of the global growth in hydro generation, all the net growth of nuclear, and a third of the growth in bioenergy. The majority of the growth in hydro outside China was in India, Brazil and Russia. The majority of the growth in bioenergy outside China was in the UK, Japan, India and Brazil.
1.3
High demand growth
1.3
High demand growth
Electricity demand rose by the most ever in absolute terms: 1,414 TWh from 2020 to 2021—approximately the equivalent of adding a new India to the world’s electricity demand. At 5.4%, 2021 saw the fastest demand growth since 2010. The rise followed from a small 1% fall in 2020.
Many advanced countries rebounded after the fall in 2020, back to pre-pandemic levels. Some countries had levels slightly lower than pre-Covid, such as the UK (4% lower in 2021 than in 2019), Germany (-2%) and Japan (-2%). But most developed countries, including the US, rebounded back to 2019 demand levels. Poland (+3%), Korea (+3%) and Russia (+3%) were all slightly higher.
The real growth continues to be in Asia, in large part as economic growth boomed. In many countries, it followed on from a growth year even in 2020 when the pandemic struck. China saw the biggest rise, with 14% higher electricity demand in 2021 compared to 2019.
1.4
Record coal power
1.4
Record coal power
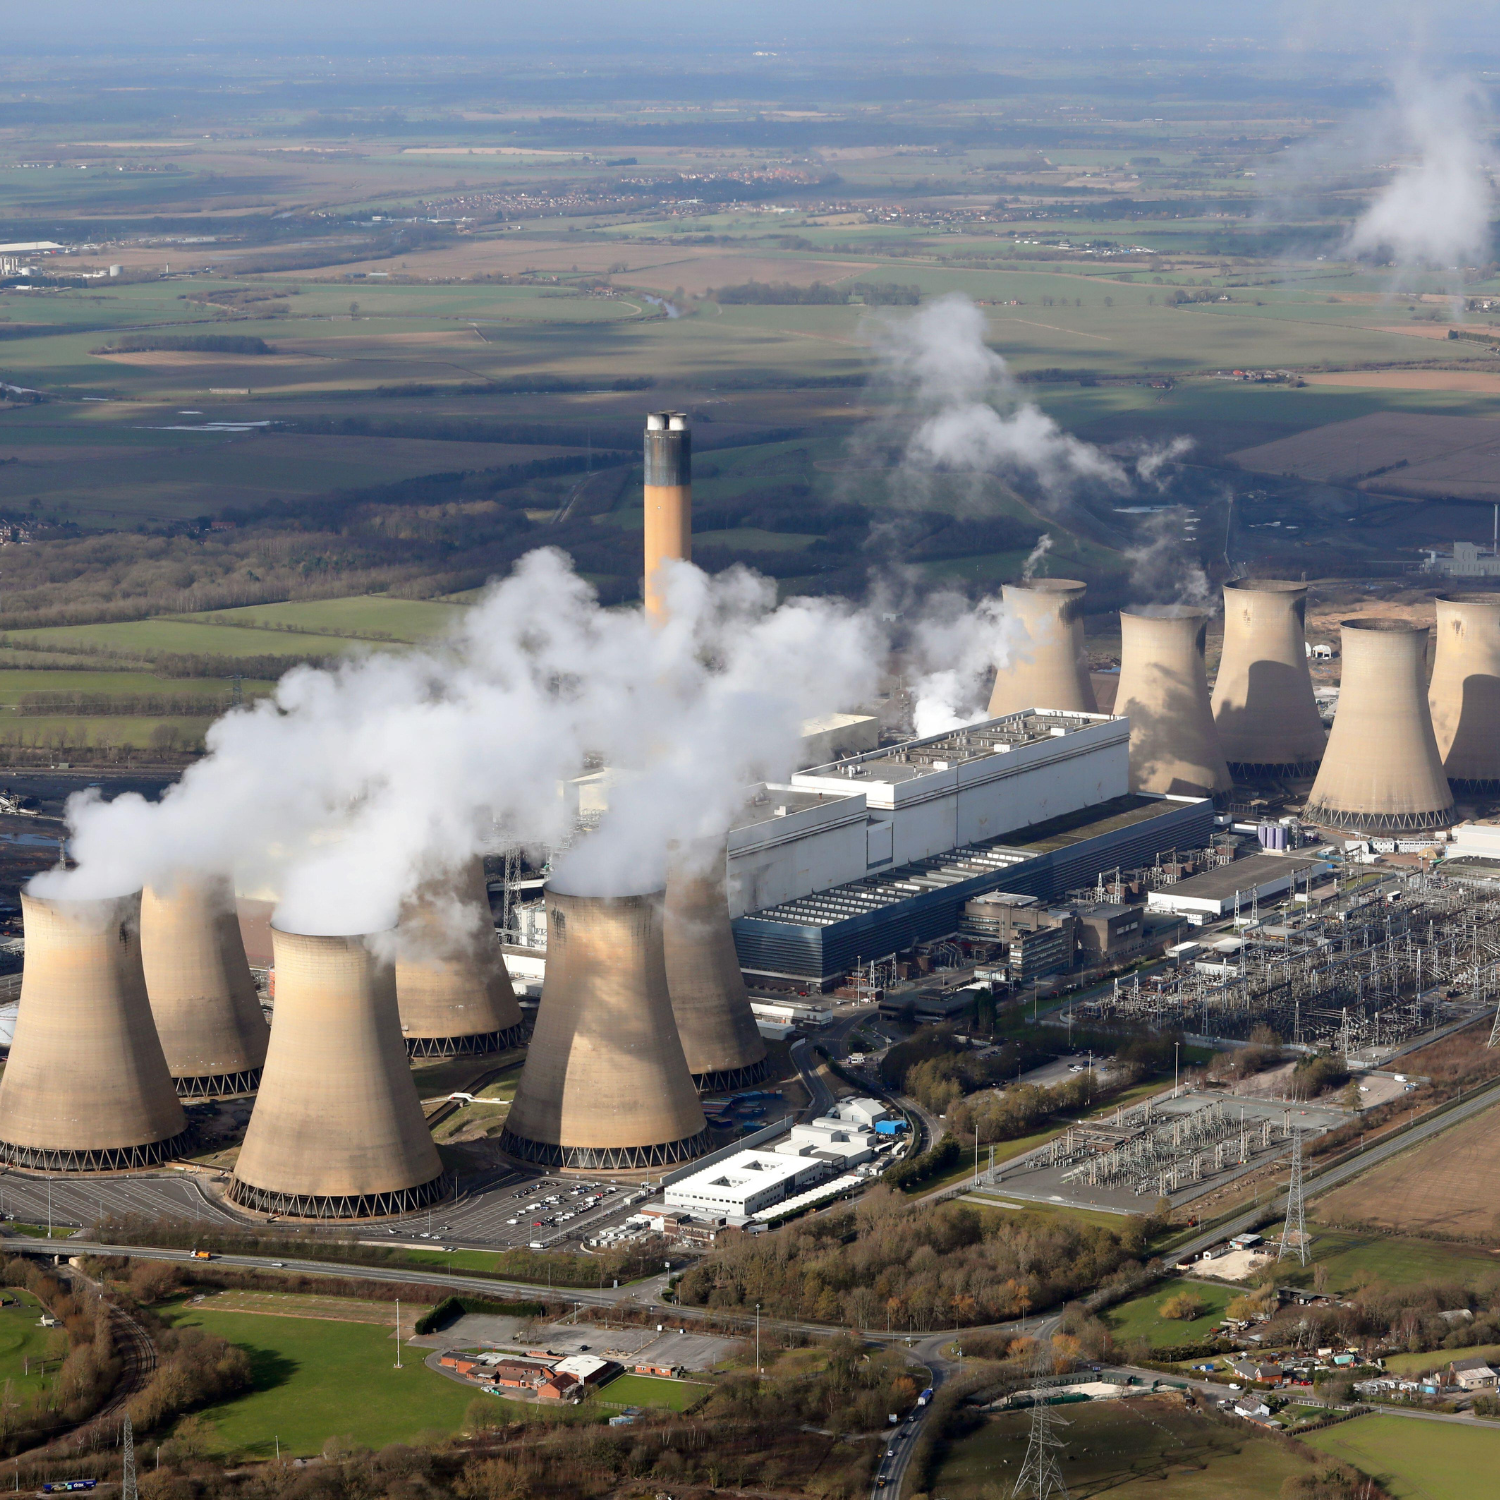
Coal power rose by 9.0% in 2021 to 10,042 TWh, more-than rebounding from a 4.2% fall in 2020. It was the biggest percentage rise on record since at least 1985. This pushed coal to set a new record for global power generation, beating the previous record of 9,838 TWh in 2018 by 2%. It reached 36.5% of global electricity, up from 35.3% in 2020. China’s share of global coal power was unchanged at 54% in 2021, having risen from 50% in 2019 to 54% in 2020. For the IEA’s 1.5 degree pathway, unabated coal power generation must fall by 73% globally from 2021 to 2030. Coal’s new 2021 record shows just how far off-track the electricity transition is.
Why did coal increase?
Coal power rose in 2021 because clean electricity simply was not deployed quickly enough to keep up with unprecedented demand growth.
Despite a record rise in wind and solar generation, only 29% of the global rise in electricity demand in 2021 was met with wind and solar. Other clean electricity provided no net growth, with nuclear increasing but hydro falling. Remaining demand increase was therefore met by fossil fuels. 59% of the electricity demand rise in 2021 was met by coal generation alone. Gas and oil made up the final 10%.
Top ten coal countries
The top ten coal power countries accounted for 90% of the world’s coal power generation in 2021.
Coal power in the US, EU and Japan strongly rebounded compared to 2020, but remained below 2019 levels. The US rebounded 16% in 2021, but was 7% below 2019 levels, Germany rebounded 24% in 2021, but was 4% below 2019 levels, Japan rebounded 3% in 2021, but was 2% below 2019 levels.
The rebound in coal was mostly caused by the rebound in electricity, but it was also partly exacerbated by a rise in gas prices. A switch from gas generation to coal generation happened at three points in 2021: in Europe at the end of the year as gas prices spiked, in the US during the Texan crisis in February 2021, and in Japan. As the high gas prices continue into 2022, our analysis for Europe finds that the gas crisis is interrupting the EU’s coal exit, and identifies a ‘paradigm shift’ as new renewables replace gas instead of coal. This new feature of the market only partly impacted full-year 2021 data, but will undoubtedly impact 2022 and beyond.
For the IEA 1.5 degree pathway, OECD countries will have to phase out coal by 2030, and the rest of the world by 2040. So far, of the remaining top 10 coal countries, only Germany has a commitment to phase out by 2030.
Increasing coal in China, India and across developing Asia
China and India are the world’s #1 and #2 biggest coal power countries. They both set new coal power records in 2021.
China’s coal generation rose by 466 TWh (9.5%) in 2021, an increase equal to the combined coal generation of Japan and Germany in 2021. It is now twice the level it was in 2008, and setting a new coal record for the fifth year in a row. It was the first time since 2011 that China’s coal market share didn’t fall, staying constant at 63.6%.
China’s clean electricity rose fast in 2021: wind generation grew 32%, solar 27%, bioenergy 8% and nuclear 11%. Hydro fell slightly, due to adverse weather, but is structurally growing. Gas generation rose by 8%. However, clean electricity was only enough to meet 33% of China’s rise in electricity demand, which increased by +9.5% in 2021. Coal filled the gap, meeting 64% of the electricity demand rise.
India’s coal generation rose by 125 TWh (11%) in 2021, setting a new record, beating the previous high in 2018 by 4%. Coal market share rose from 72% to 74% of India’s electricity. The increase in wind and solar generation was only the third highest on record, and met only 12% of the increase in electricity demand—coal filled the gap.
There were also all-time coal power records set in other Asian countries in 2021: Kazakhstan (+6%), Mongolia (+13%), Pakistan (+8%), and the Philippines (+8%).
1.5
Record emissions rise
1.5
Record emissions rise
The record rise in coal, coupled with a modest rise in gas generation, means power sector CO2 emissions rose by 7% (778 million tonnes) in 2021. That’s the largest absolute rise ever, and the largest percentage rise since 2010. This rise follows from a fall in 2020, but that fall was only 3%. This takes power sector emissions to a new record of over 12 billion tonnes of CO2, beating the previous record in 2018 by 3%. Emissions growth is in sharp contrast to what is needed for the IEA’s 1.5 degrees pathway: a 60% fall in power sector emissions from 2021 to 2030.
The future electricity system is expected to more than triple in size under a net zero global energy scenario, displacing fossil fuel use in other sectors and bringing down emissions overall. However, in the interim, though demand for oil in 2021 remained suppressed, an increase in electricity demand was met predominantly through fossil fuels and this pushed up both electricity emissions and total global emissions to record levels. Over time, continued electrification, coupled with clean electricity deployment increases, will turn global emissions around.
Moving to clean power
Ember estimates global carbon intensity was 442g CO₂ per kWh in 2021 (up from 437g in 2020). The IEA 1.5 degree pathway means it must rapidly fall to zero by 2035 in advanced economies and by 2040 worldwide.
We already know what needs to happen—above all, wind and solar generation need to continue on their growth curve to provide three-quarters of the growth in clean electricity through to 2030. Leaders in wind and solar show that this level of market share is realistic, and that huge growth can happen relatively quickly. But those shifts aren’t happening fast enough across all countries, and we’re far off-track in reducing power sector emissions. The result in 2021 was coal’s rise, at a time when it needs to be falling rapidly.

Related Content