Chapter 4:
Global Electricity Source Trends
Analysis of the different electricity sources in 2024
Data on global electricity generation from solar, wind, hydro, nuclear coal and gas in 2024, with an overview of changes in the last year and trends in the last two decades.
We have ordered the sections according to the fastest growing sources (% growth) of electricity in 2024.
4.1
Solar
Key highlights
01
02
China added more solar generation than the rest of the world combined in 2024
03
Global solar power continues to double every three years, maintaining high growth rates even as it scales
2024 represented another record year for solar power as it rose by 474 TWh to a new high of 2,131 TWh (+29%). The share of solar in the global electricity mix reached 6.9%, up from 5.6% in 2023.
The increase of 474 TWh was 45% higher than in 2023 (+327 TWh). Solar added more than twice as much electricity generation in 2024 as any other electricity source.
Solar generation is now more than 20 times larger than it was in 2012, and its share of global generation over the same period has increased sixteenfold.
Global solar power continues to double every three years, maintaining high growth rates even as it scales: 2024’s growth rate of 29% was the fastest in six years. Solar generation took eight years to go from 100 TWh to 1,000 TWh, but it has only taken three years to double to over 2,000 TWh in 2024.
China continues to be the country with the largest rise in solar generation, adding 250 TWh – more than half of the global change in generation (53%) in 2024 and four times more than the second largest increase in the United States (+64 TWh). This pushed up China’s solar generation by an astonishing 43% compared to 2023.
The US, Brazil, India and Germany also saw record increases in generation, driven by record capacity installations in 2023 and 2024.
Brazil has quickly become one of the world’s largest solar markets. Its 23 TWh (+45%) increase in solar generation in 2024 made it the country with the third-highest growth for the second year in a row.
In absolute terms, China is the global leader on solar. Its total solar generation reached 834 TWh in 2024, greater than the global total just five years ago in 2019. 39% of the world’s solar generation came from China in 2024.
Just eight years ago, Brazil ranked 58th in the world for solar generation. In 2024, it overtook Germany to become the fifth-largest solar generator, despite Germany also seeing a record increase.
42 countries now generate at least a tenth of their electricity from solar. Of countries with more than 5 TWh of solar generation, Hungary became the country with the highest share of solar in the electricity mix at a quarter (25%), ahead of Chile (22%). Both countries’ solar shares were less than 2% in 2015.
Australia remained the country with the highest solar generation per capita at 1,866 kWh, over seven times the world average.
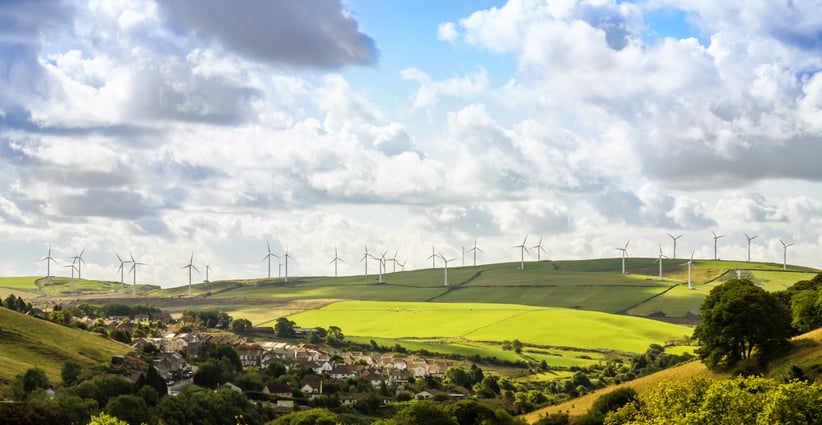
4.2
Wind
Key highlights
01
Wind generation has tripled since 2015, reaching a new record high in 2024
02
Weather conditions meant wind generation growth was modest in 2024, but it was still the second-fastest growing source of new electricity
03
35 countries generated more than a tenth of their electricity from wind power in 2024
Global wind generation reached a new record high of 2,494 TWh in 2024, up 182 TWh (+7.9%) from 2023. Wind’s share in the global electricity mix reached 8.1%, up from 7.8% in 2023.
Wind generation has tripled since 2015, and its share in the global electricity mix has more than doubled since then.
Despite this positive overall trend, growth in wind generation has slowed for the third year in a row. However, it was still the source with the second-largest increase in 2024, behind solar. While capacity additions remained high, wind generation growth was limited by less windy conditions compared to 2023, particularly in China.
With wind capacity growth remaining strong across the world, generation is likely to return to higher growth in the coming years.
China accounted for well over 50% of the global wind increase in 2024, with its wind generation rising by 106 TWh (+12%). China’s wind generation increase in 2024 was more than three times larger than that of the US, which saw the second-biggest increase in wind.
China has seen a large boom in wind power since 2020. In the most recent data on capacity additions from 2023, 66% of global onshore capacity additions and 64% of global offshore capacity additions were in China.
Wind generation in the US rebounded last year, increasing by 32 TWh, after a fall of 13 TWh in 2023. The 2024 growth was a result of improved wind conditions, as well as new wind capacity.
Wind generation growth was more modest in Europe in 2024 than in 2023, with Germany and France seeing falls of 4 and 5 TWh respectively. Although capacity additions continued in 2024 in these countries, less favourable wind conditions than in 2023 led to lower-than-expected generation.
China’s wind generation in 2024 was 992 TWh, which was more than the entire world’s wind generation eight years ago. China currently accounts for 40% of global wind generation.
Overall, EU countries lead in shares of wind generation. Of countries with more than 5 TWh of wind generation, Denmark was the global leader in 2024 at 58%. The top ten also includes Ireland, Portugal, Germany, the Netherlands, Finland, Sweden, and Spain. Outside Europe, Morocco (22%) was a notable leader.
Among countries with the highest share, Finland doubled its share of wind generation since 2020, from 12% to 24%. Morocco also saw a significant rise in wind generation in 2024 (+3.3 TWh, +50%) and now has the ninth-largest share of wind power globally.
On a per capita basis, Nordic countries generated the most power from wind in 2024 with Sweden, Finland, Denmark and Norway remaining as the top four. Their per capita generation from wind was ten times the world average.
4.3
Hydro
Key highlights
01
Hydro generation rebounded in 2024, mostly because of better weather conditions after widespread droughts in 2023
02
Global hydro generation reached a new record high in 2024, however its utilisation rates were still below the ten-year average
03
China accounted for 71% of the global rise in hydro generation in 2024
Hydro power rebounded in 2024 after droughts in key countries in 2023, with global generation increasing by 182 TWh (+4.3%).
This rise in 2024 was largely the result of improving conditions rather than new capacity. In 2023, the most recent year with available capacity data, hydro capacity increased by only 1.4%, and China was the only country to install more than 1 gigawatt (GW).
Total hydro generation reached an all time high of 4,416 TWh in 2024. The previous high was in 2020, which was followed by declining total generation in 2021, a small rise in 2022, and again a decline in 2023. However, it is important to note that hydro capacity factors remain significantly below the ten-year average. While hydro generation in 2024 was 2% higher than the previous record in 2020, capacity has increased by an estimated 7% since then.
The share of hydro in global electricity generation was 14.31% in 2024, a fractional increase over 14.27% in 2023. However, the share of hydro has been on a slow decline as electricity demand has been growing faster than hydro generation.
China accounted for 71% of the global hydro generation increase in 2024, with its hydro output rising by 130 TWh (+11%). Heavy rains saw Chinese hydro generation increase in 2024 after it fell in 2023 due to droughts (-72 TWh). In addition to improved conditions, China has continued to add new hydro capacity.
Whilst rainfall improved in China and Europe, droughts cut Brazil’s hydro generation (-14 TWh). Canada saw a second year in a row of poor conditions leading to declining hydro generation (-17 TWh). US hydro generation stayed near 20-year lows as droughts continued in the north west.
China extended its lead in hydro power generation, rising to 1,356 TWh in 2024. In 2003, it had the same hydropower generation as Brazil. In 2024, it had more than three times that of Brazil and four times that of Canada. However, both Brazil and Canada rely on hydro for about 55% of their electricity generation. In contrast, hydro only contributes 13% to China’s electricity mix.
Hydropower is unique, with many power systems having a near-total reliance on just one source of electricity – the top ten countries get 84% or more of their electricity from hydro. This high level of reliance on hydro brings risks related to drought and climate change, with power outages in Ecuador providing a recent example.
Iceland and Norway lead the world in per capita hydro generation with 36,382 kWh and 24,837 kWh respectively.
4.4
Nuclear
Key highlights
01
Nuclear generation rose by 2.5% in 2024
02
However, nuclear growth continues to lag behind electricity demand growth and its share in the global electricity mix fell to a 45-year low
03
The rise in 2024 was driven by French units returning from outage, some units in Japan returning to service, and a few new units being commissioned globally
Nuclear generation grew in 2024 (+69 TWh, +2.5%) following a similar increase in 2023 (+59 TWh, +2.2%). Total global nuclear generation in 2024 (2,768 TWh) narrowly hit a record high.
Nuclear made up 9% of the global electricity mix in 2024, the lowest value in more than 45 years. Its share has seen consistent declines in the last decade as the rise in nuclear generation has lagged behind the rise in global electricity demand.
Four units were closed in 2024, the lowest number in ten years. However, only seven were commissioned in 2024, although construction was started at 11 units, as the global interest in new nuclear rises.
Even as some countries are phasing out nuclear power, global generation from nuclear plants is still expected to rise. Japan is restarting some of its reactors, maintenance works are progressing in France, and new reactors are due to begin commercial operation in various markets, including China, India, South Korea and Europe.
The country with the largest increase in nuclear generation in 2024 was France (+41 TWh, +12%), where generation slowly returned to higher levels throughout 2023 and 2024 after outages in 2022.
China’s nuclear generation rose by 10 TWh as four new units were commissioned in 2024. The rise of nuclear power in China has slowed dramatically from 17% per year from 2000 to 2019, to 5% per year from 2019 to 2024.
Japan’s nuclear generation rose by 7.5 TWh last year, as 2 reactors restarted in 2023 and two restarted in 2024. Nuclear generation in the US rose by 7.1 TWh. One new unit came online, but there are no further reactors under construction as of 2024.
Nuclear power generation fell by 7.2 TWh in Germany in 2024, reflecting the final closures of its nuclear fleet in April 2023. Taiwan had a decline in nuclear generation for the fifth year in a row (-2.7 TWh) due to its planned nuclear phaseout policy.
The US continues to be the largest producer of nuclear power globally with 782 TWh in 2024, ahead of China (445 TWh), and France (379 TWh).
Only three countries rely on nuclear power for more than half of their electricity generation: France, Slovakia and Ukraine.
A new nuclear power plant commissioned in 2022 meant Finland rose to become the country with the highest per capita nuclear generation in 2023 and stayed at this spot in 2024, ahead of France.
4.5
Gas
Key highlights
01
Gas generation rose by 1.6% to a record high, in part due to heatwaves driving increased demand
02
Gas’s market share has been falling for four years – it peaked at 24% in 2020 and fell to 22% in 2024, the lowest since 2013
03
The US was responsible for 43% of the global increase in gas generation since 2015
Global gas generation rose by 1.6% (+103 TWh) to a record high of 6,788 TWh in 2024.
Despite this, its market share fell for the fourth year in a row, as generation rose more slowly than electricity demand. Its share peaked at 24% in 2020 and fell to 22% in 2024, the lowest since 2014.
In absolute terms, gas generation has grown by 22% since 2015 (+1,246 TWh), with the US responsible for 43% of this increase.
The increase in gas generation in the US (+59 TWh) was 57% of global growth in 2024. Egypt had the second-largest growth (+15.1 TWh) ahead of Mexico (+14.8 TWh). In Mexico, gas replaced coal and oil generation. Brazil, Russia and South Korea also recorded large increases in gas generation in 2024 of around 10 TWh.
Gas generation fell in the UK (-14 TWh), Spain (-12 TWh) and France (-11 TWh) as wind and solar generation continued to expand. Across the EU, gas generation was down by 26 TWh, falling for the fifth year in a row.
Iran also recorded a substantial decline of 13 TWh in 2024, reversing an increase of 10 TWh in 2023.
The US was the world’s largest producer of electricity from gas in 2024, with 1,865 TWh. This was more than three times larger than Russia, which remained in second place at 538 TWh.
15 countries generated more than 80% of their electricity from gas in 2024. These countries are predominately in the Middle East, North Africa and Central Asia.
Countries in the Middle East had the highest per capita gas generation, led by Bahrain (22,986 kWh, 2023 value as 2024 unavailable) and Qatar (19,190 kWh). This was driven by two factors: a high share of gas in their electricity mix and high per capita demand.
4.6
Coal
Key highlights
01
Coal generation rose by 1.4% to a new record in 2024, driven by high electricity demand growth in part caused by heatwaves
02
Coal’s share of global electricity generation fell to 34% in 2024 as electricity demand grew faster than coal generation
03
China accounted for 74% of the global increase in coal generation in 2024
Global coal generation grew by 1.4% (+149 TWh) in 2024, rising to a new record high. This increase was slightly below the rise in 2023 (+190 TWh, +1.9%).
Coal remains the largest single source of electricity generation. However, coal has been growing more slowly than electricity demand, leading to its share of global generation falling to 34% in 2024.
In 2015, 59 countries generated at least a fifth of their electricity from coal, which fell to 40 countries in 2024.
The largest increase in coal generation in 2024 was in China (+110 TWh, +1.9%), which accounted for 74% of global growth in coal generation. Notably, this was significantly less than China’s 2023 coal increase of 341 TWh, despite heatwave-related demand spikes driving up China’s coal generation in 2024. Ember’s analysis found that 59% of China’s 2024 annual coal generation growth happened in just August and September amid soaring temperatures. The growth in China’s coal generation in 2024 was suppressed by remarkable solar growth and a strong rebound in hydro generation.
Coal generation increased in India by 63 TWh (+4.3%) and in Viet Nam by 21 TWh (+16%). Bangladesh recorded a 115% increase in coal generation (+12 TWh) in 2024.
Coal generation continued to shrink in the US (-22 TWh, -3.3%), although the coal decline in 2023 was much larger (-156 TWh, -19%). In Germany, coal fell by 21 TWh (-17%) in 2024, even as the country closed its last nuclear plant in 2023.
Of countries with available data for 2024, 37 showed falls in coal generation.
China accounted for 55% of global coal generation (5,864 TWh) in 2024. India produced the second-largest amount of electricity from coal with 1,534 TWh, followed by the US with 653 TWh.
Kosovo had the world’s highest share of coal power in 2024 (92%), although its total output remains small. Mongolia and South Africa complete the top three with 86% and 82%, respectively. India produced 75% of its electricity from coal in 2024, more than double the global average of 34%.
Kazakhstan – which was fifth in 2023 — dropped out of the top ten, with its coal share declining from 67% in 2023 to 55% in 2024. Two countries moved into the top ten in 2024: Serbia and Bosnia Herzegovina, both with 63%.
The highest coal generation per capita was recorded in Taiwan (5,349 kWh), Australia (4,768 kWh) and China (4,132 kWh), which were all more than three times the world average of 1,299 kWh.

Related Content
Analysis
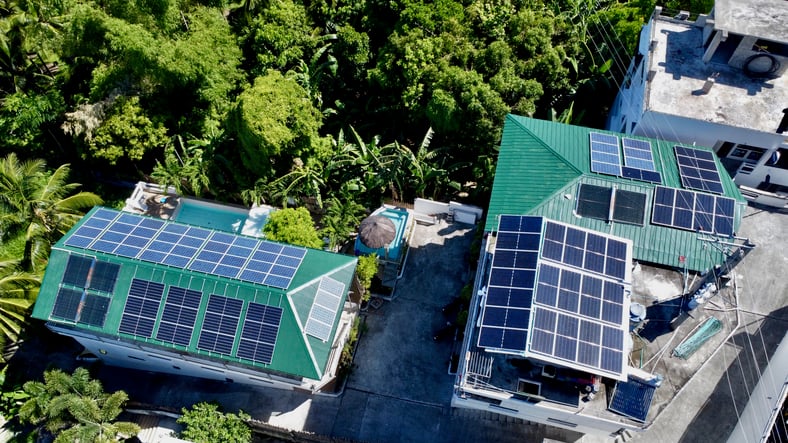
How the Philippines' rooftop solar surge can flip the energy emergency script
28 May 2026
Analysis
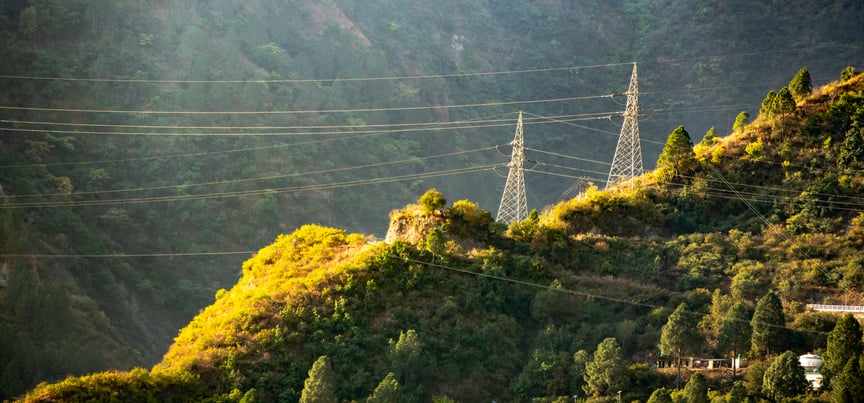
Rewiring Resilience: AI for Climate-Adaptive Power Grids in Asia-Pacific
21 May 2026
Analysis
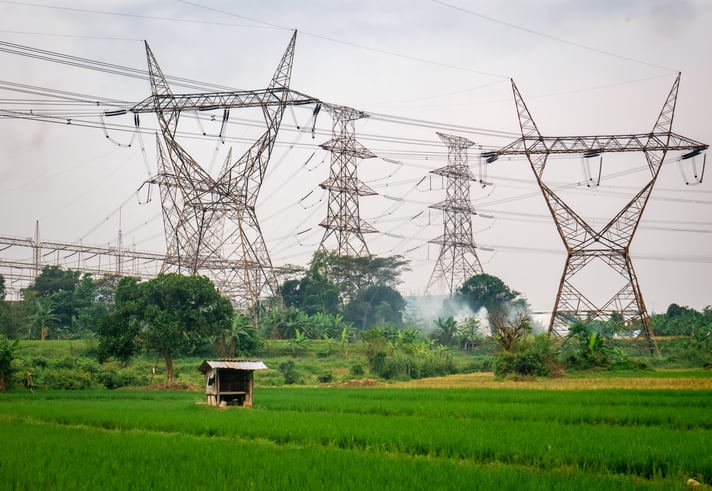
Transmission gaps are beginning to constrain India's rapid renewables integration
19 May 2026
Analysis
British power prices are increasingly independent from gas
13 May 2026