Supporting Materials
Methodology
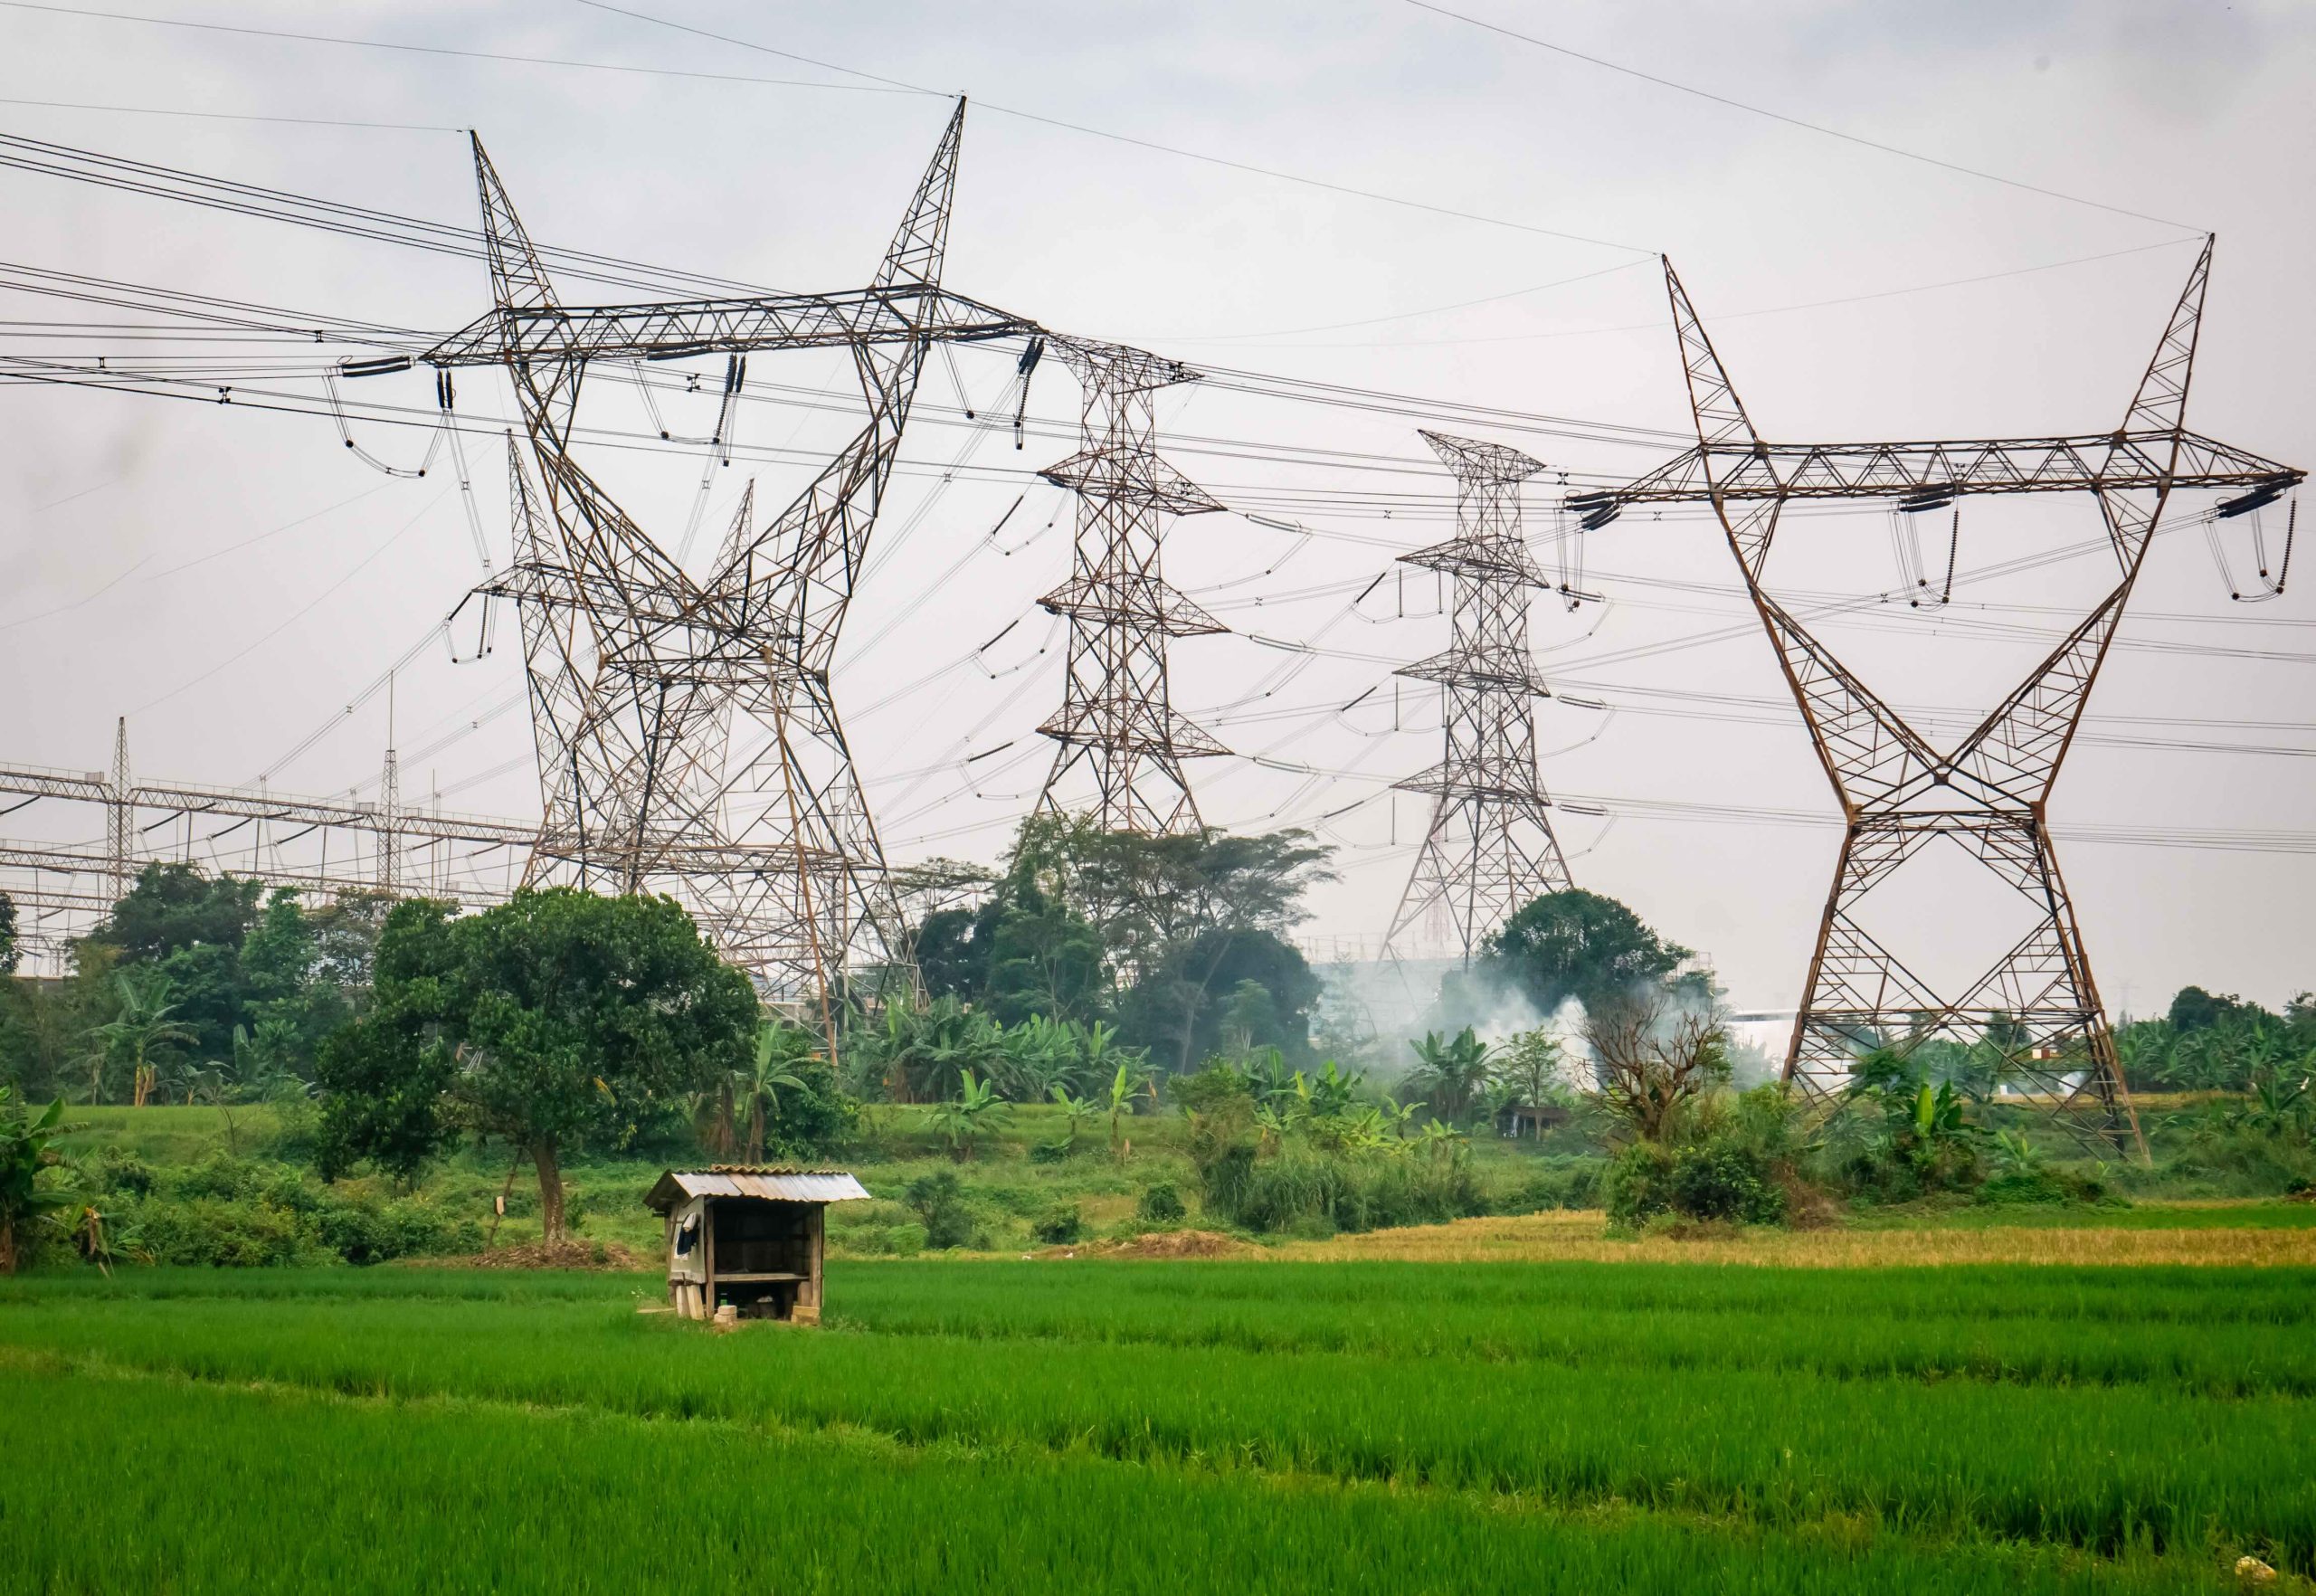
Generation, imports, demand and emissions
Yearly data from 2000 to 2023 is gross generation, taken primarily from the Energy Institute’s Statistical Review of World Energy, the Energy Information Administration (EIA), Eurostat and IRENA. 2024 data is an estimate of gross generation, based on generation gathered from monthly data. This estimate is calculated by applying absolute changes in monthly generation to the most recent annual baseline.
Net imports from 1990 to 2023 are taken from the EIA and Eurostat, with recent data estimated in the same manner as generation. Demand is calculated as the sum of generation and net imports, and where possible validated against published direct demand figures. Because it uses gross generation and does not include transmission and distribution losses, it will tend to be higher than end-user demand.
Monthly data is gathered for 88 countries from over 70 sources, including national transmission system operators and statistical agencies, as well as data aggregators such as ENTSO-E. In some cases, data is published on a monthly lag; here we have estimated recent months based on our generation model.
Monthly data is often reported provisionally, and is far from perfect. Every effort has been made to ensure accuracy, and where possible we compare multiple sources to confirm their agreement.
Bioenergy has typically been assumed (by the IPCC, the IEA, and many others) to be a renewable energy source, in that forest and energy crops can be regrown and replenished, unlike fossil fuels. It is included in many governmental climate targets, including EU renewable energy legislation, and so Ember includes it in “renewable” to allow easy comparison with legislated targets. However, we recognise the IPCC reported lifecycle carbon intensity of bioenergy is significantly higher than other renewables and nuclear, and this is incorporated into our power sector emissions estimate. More information about Ember’s classification of electricity sources can be found in the full methodology for Ember’s Yearly Electricity Data under “Fuel Types”.
References to CO2 emissions in this report are using CO2 equivalent emissions which include emissions from other greenhouse gases such as methane (CH4). Power sector emissions are based on the methodology from Ember’s Yearly Electricity Data which can be found here.
Calculation of temperature impacts on electricity demand
This methodology outlines the approach used to quantify the impact of temperature on global electricity demand. By using regression analysis with temperature data and monthly electricity demand, this analysis isolates temperature-driven variations from structural changes in electricity consumption.
Geographic coverage
The analysis aims to deliver a global level account of temperature effects on demand. For this purpose, it includes country/region-level analysis for 14 countries and regions. The analysis was carried out for Australia, Brazil, Canada, China, the EU, India, Iran, Japan, Mexico, Russia, South Africa, South Korea, Türkiye, the United Kingdom and the United States. Together, these power sectors accounted for 82% of global electricity demand. The assessed impact in included countries is scaled to match 100% of global demand.
Data Sources
Meteorological Data: Temperature data was sourced from the ERA5 reanalysis via Open-Meteo, providing hourly 2-metre temperature.
Electricity Demand Data: Monthly electricity demand data was obtained from Ember’s Monthly Electricity data.
Population Data: Population figures were derived from NASA’s Gridded Population of the World dataset, with a resolution of 0.25 degrees (~30 km).
Time Period: The analysis of temperature effects covers the period from 2015 to 2024, depending on the availability of data for each country.
Normalising Monthly Electricity Demand
Monthly electricity demand was normalised by dividing observed demand by its 12-month trailing average. This process helps to minimize the influence of long-term structural factors such as economic growth or increased electrification, isolating seasonal and temperature-related changes.
Temperature Data
A 1-degree resolution grid was created for each country. Population data was assigned to each grid cell, and hourly temperature data was extracted for the centre of each cell.
Population Weighting for temperature and CDD/HDD values
Population weighted temperatures were calculated by weighting temperature for each grid cell by the corresponding population.
Similarly, cooling degree days (CDD) and heating degree days (HDD) values were calculated and weighted using the same approach. This ensures that temperature metrics reflect conditions in populated areas, where electricity demand is concentrated. It also accounts for the non-linear relationship between temperature and energy use. Cooling degree days and Heating degree days were defined as follows:
Cooling degree days (CDD): The sum of degrees by which daily temperatures exceed 22°C, reflecting cooling demand.
Heating degree days (HDD): The sum of degrees by which daily temperatures fall below 18°C, reflecting heating demand.
Regression Analysis
To understand the relationship between temperature and electricity demand, we used regression analysis to identify how changes in temperature, measured through cooling degree days and heating degree days, influence electricity demand per country. The analysis helps quantify the extent to which higher or lower temperatures drive changes in monthly electricity use.
Calculating Anomalies
Monthly temperature, HDD and CDD anomalies were calculated with respect to a ten-year baseline (2015-2024). Using a relatively short and recent baseline makes the anomalies more relevant to recent changes in electricity demand.
Calculating Absolute Impact
The impact of temperature on demand was derived by applying the identified relationship of CDD and HDD data and monthly electricity demand to the CDD and HDD anomalies. These were then scaled by normalised demand into absolute impacts in TWh. For some countries, monthly demand reporting can be lower than annual reported values. Where applicable, temperature impact values derived from monthly data were scaled to match annual demand figures. Combined country level assessments for the 15 included regions were aggregated and scaled to match total global electricity demand of all countries in 2024.
Demand disaggregation
Electricity demand growth from EVs is estimated from changes in EV stock by vehicle type, multiplied by reference values for electricity consumption by vehicle type. Vehicle types include passenger cars, buses, trucks and vans, for both battery electric vehicles and plug-in hybrid electric vehicles. Historic stock data is taken from the IEA’s Global EV Data Explorer. Demand growth in 2024 is estimated using sales data for passenger cars taken from BNEF, and assumes recent growth rates are maintained across other vehicle types.
Electricity demand growth from data centres (including cryptocurrency mining) is estimated using IEA data. As IEA data only goes back to 2019, the same value for demand growth was used in 2019 as in 2020, based on the assumption that growth at this point in time was linear (see assessment of historic estimates from Lawrence Berkeley National Laboratory). For 2023-2024, IEA projections for cryptocurrency mining have been substituted for real data from Cambridge University’s Cambridge Bitcoin Electricity Consumption Index (CBECI) to more accurately estimate cryptocurrency mining electricity consumption growth for recent years. The estimates for cryptocurrency mining electricity demand growth are estimated using growth in Bitcoin electricity demand, scaled to fit estimates for total crypto demand in 2022. Bitcoin makes up the large majority of proof-of-work cryptocurrency mining activity and other cryptocurrencies based on proof-of-stake mechanisms use considerably less energy.
Electricity demand growth from heat pumps is estimated using changes in stock data, multiplied by annual average consumption. Data for 2024 assumes that the reduction in sales in key markets seen in the first half of 2024 continued throughout the rest of the year.
Other data sources
This report makes use of a variety of datasets curated by Ember, including data on exports of Chinese solar PV modules and global solar capacity installations.
A full methodology for Ember’s data on exports of Chinese solar PV modules can be found here.
Solar capacity additions are estimated using available monthly capacity data from national sources for countries that made up 80% of solar capacity additions in 2023. National monthly data is generally available for all of 2024, with exceptions for a few countries where the final months of 2024 are estimates based on market growth rates in available months. Estimates for remaining countries are made through analysis of Chinese solar PV module export data. A full methodology can be found here.
Acknowledgements
Lead Authors
Nicolas Fulghum, Euan Graham
Other authors
Katye Altieri
Data visualisation
Chelsea Bruce-Lockhart, Lauren Orso
Project Manager
Josie Murdoch
Editors
Richard Black, Hannah Broadbent
Other contributors
Aditya Lolla, Ardhi Arsala Rahmani, Beatrice Petrovich, Claire Kaelin, Dave Jones, Eva Mbengue, Kavya Sharma, Libby Copsey, Matt Ewen, Neha Rajput, Phil MacDonald, Rashmi Mishra, Reynaldo Dizon, Rini Sucahyo, Sachin Sreejith, Sam Hawkins.
Peer reviewers
A.K. Saxena (TERI), Bryony Worthington (Ember), Hannah Ritchie (Our World in Data), Harry Benham (Ember), Kingsmill Bond (Ember), Nathaniel Bullard (Business Climate Pte. Ltd), Xunpeng ‘Roc’ Shi (UTS/ISETS).
Cover image
The cover of this report was designed by Reynaldo Dizon and is based on real data used for the analysis within this report, showing growth in solar power across the world – as a share of generation, and in absolute terms – over the past five years.

Related Content