Chapter 2:
The Big Picture
The mega-trends shaping the electricity transition
This section explores three trends that are having an outsized impact in shaping the global electricity transition, now and in the coming years: the staggering rise of solar, the new drivers of accelerated demand growth and the trajectories of China and India.
First we look at solar power, which has become the engine of the global energy transition, doubling every three years to become the largest and fastest-growing source of new electricity generation. As battery costs decline, the combination of batteries and solar is proving a winning combination, along with other forms of clean flexibility that will unlock the full value of solar.
We then discuss how emerging drivers like EVs, heat pumps and data centres have structurally raised demand growth. While expectations for future growth in power consumption have increased, the outlook remains uncertain. Clean generation is still expected to grow quickly enough to meet higher demand growth, but fossil power declines will remain unpredictable in the short-term.
Finally, we turn our focus to the two countries with the largest growth in electricity demand in the last two decades: China and India. The two economies are breaking the long-standing link between electricity demand growth and fossil fuel expansion in the power sector by deploying clean generation at a world-leading scale. Together, their progress in clean power can tip the balance towards a global decline in fossil generation.
2.1
Solar is surging – flexibility can take it to the next level
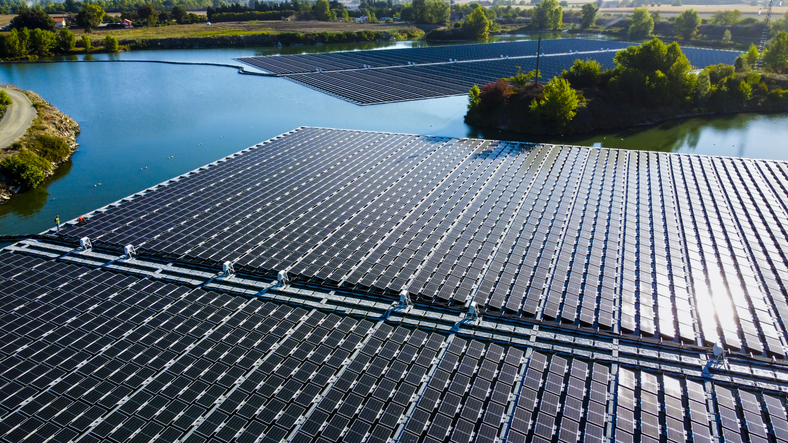
Solar surpassed 2,000 TWh of global generation in 2024, reaching this level faster than any other generation technology in history. This is reducing the need for additional fossil generation, enhancing energy security in countries reliant on fossil imports. As its exponential rise continues, doubling every three years, solar power is taking off in power systems all around the world and entering new markets. Combined with battery storage, which almost doubled in capacity last year, countries can unlock further benefits from low-cost solar power and enable fast growth to continue.
Solar power has become the engine of the global energy transition
Cheap solar power is already reshaping the electricity system
In 2024, for the first time, solar power supplied more than 2,000 TWh of electricity, increasing by 474 TWh (+29%) from the previous year. This was the largest increase in generation from any power source in 2024. Solar has now been the largest source of new electricity globally for three years in a row.
Having grown from 100 TWh to 1,000 TWh in eight years, solar generation made the jump from 1,000 TWh to 2,000 TWh in just three years. This means that it has continued its exponential rate of growth, doubling every three years.
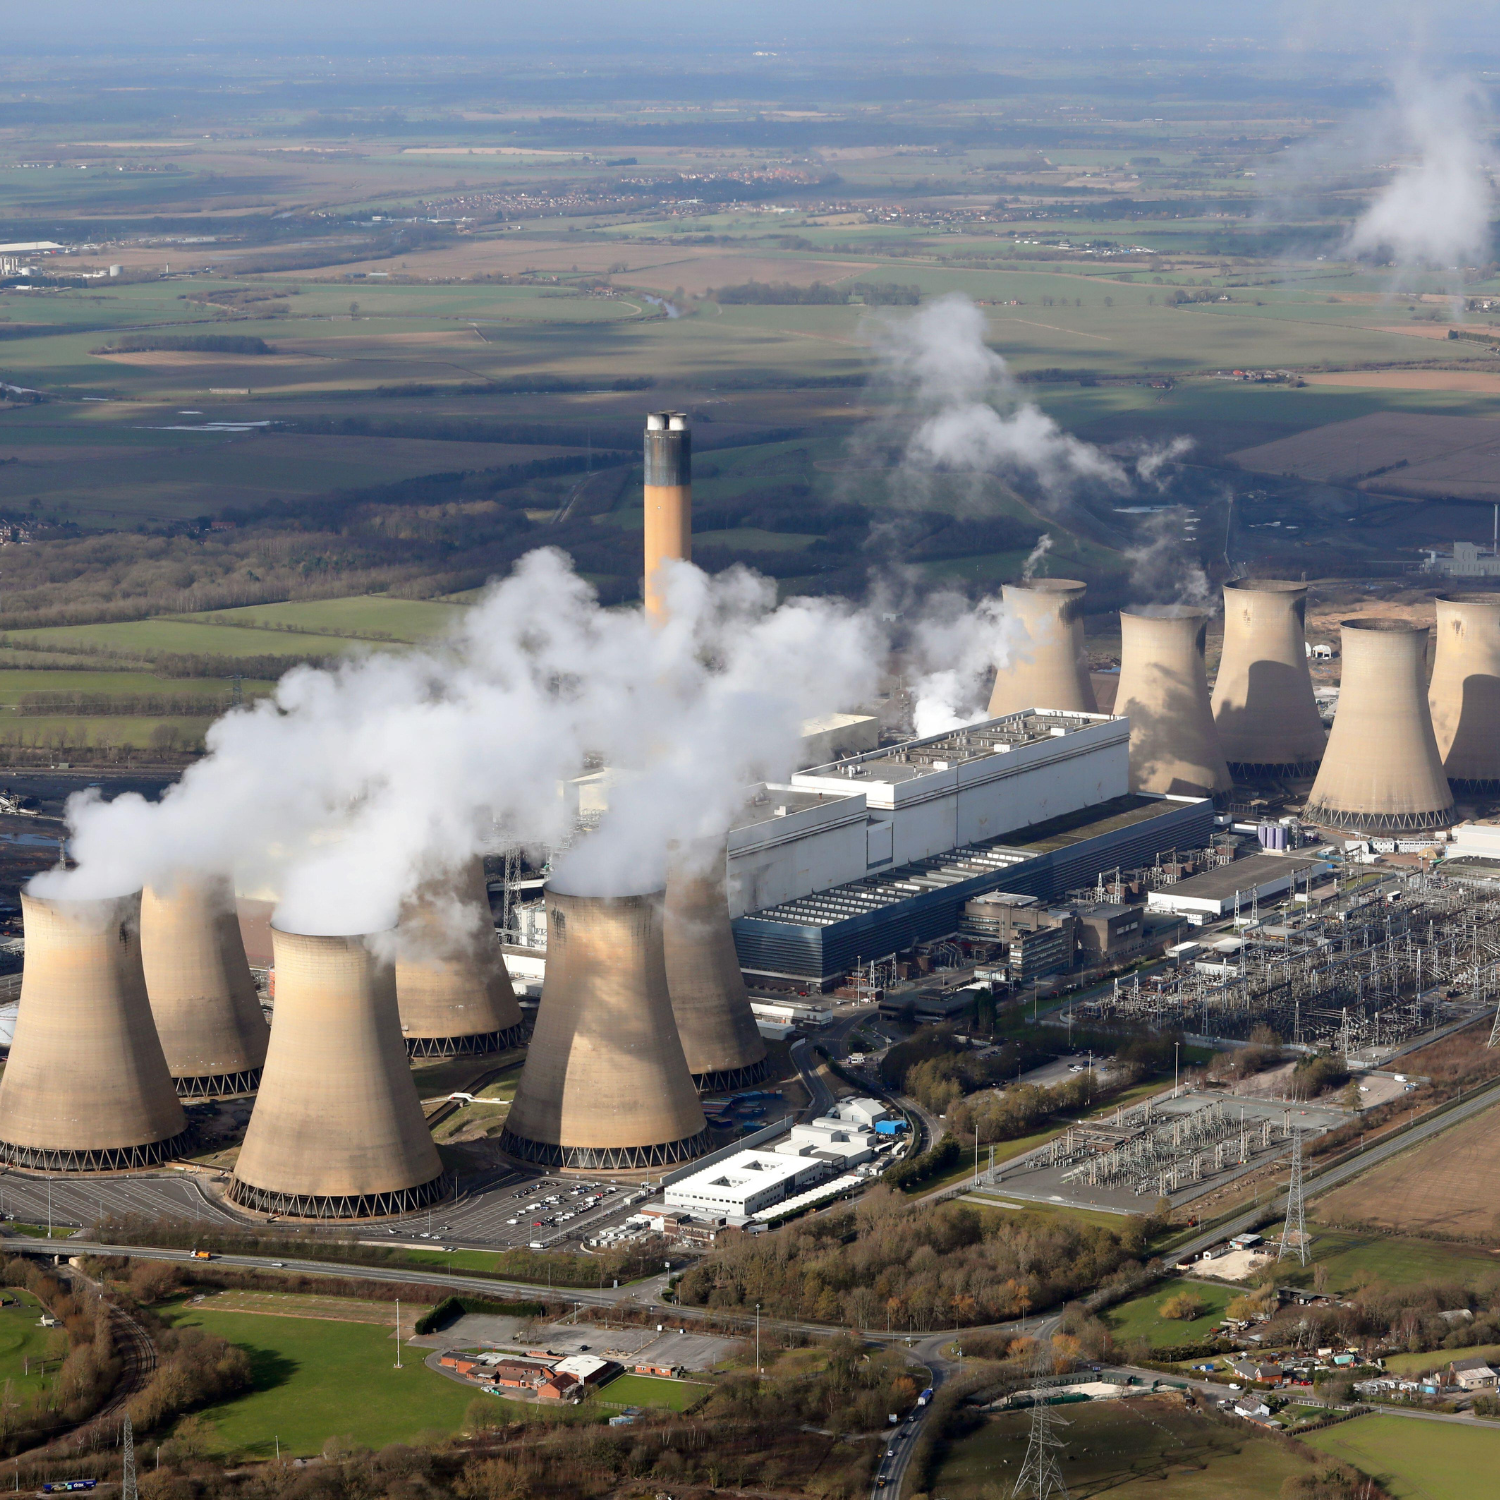
Rapid solar growth is helping the world meet growing electricity demand and avoiding the use of more expensive fossil fuels. Global solar generation is now large enough to power all of India. Without the 2,131 TWh that solar power provides, global fossil generation would be 12% higher than it is today. In 2024, generation from solar avoided an estimated 1,658 million tonnes of CO2 (MtCO2) of emissions – equivalent to the United States’ power sector emissions.
While the expansion of solar has contributed to falls in fossil generation in advanced economies such as the EU and the United States, the largest avoided fossil generation is in China, where annual coal generation would have been an estimated 783 TWh higher in 2024 if not for the build-out of solar power. In particular, the rise in coal generation in China seen in the last five years would have been an estimated 50% larger without the growth in solar generation.
Record capacity installations keep driving solar to new heights
Increases in generation have been achieved thanks to the pace of capacity additions. The world installed a record 585 gigawatts (GW) of solar capacity last year – 30% more than in 2023, and more than double the amount installed in 2022. Having surpassed 1 TW of solar power in 2022, it took only two years to install the next 1 TW.
This is not just unprecedented for solar power – it is a rate of growth that no power source has seen before. In fact, the solar capacity installed in 2024 is more than the annual capacity installations of all fuels combined in any year before 2023.
The rapid growth of solar is on display everywhere
The expansion of solar power is a worldwide phenomenon, with 99 countries doubling the amount of electricity they produce from solar power in the last five years. The majority of solar generation now comes from non-OECD countries (58%), with China alone making up 39% of the global total. But even as some countries are already integrating high shares of solar into their power systems, there is still room for rapid growth in other markets.
Solar is growing all around the world
As solar’s share of the global electricity mix has risen to 6.9% of global generation in 2024, some countries are showing it is possible to incorporate much larger amounts. There are now 21 countries that generate more than 15% of their electricity from solar power, up from just three countries five years ago.
In 2022, in response to Russia’s invasion of Ukraine and rising energy prices, EU Member States strengthened their policies and targets for the clean electricity transition and accelerated the rollout of cheap, fast-to-build sources of home-grown electricity, solar in particular. Of the 15 countries with the highest solar shares in 2024, seven were in the European Union.
Outside Europe, Chile generated 22% of its electricity from solar power in 2024, up from just 8% in 2019. Australia reached an 18% solar share in 2024, up from 7% in 2019.
Rapid growth is happening elsewhere too. In 2024, 81% of the rise in solar generation took place in countries where it still made up less than a tenth of total output. For the first time ever, solar power was the largest single source of new electricity in China, rising by 250 TWh (+43%) to supply 8.3% of the country’s electricity. In Brazil, solar generation increased by 23 TWh (+45%) last year, following a 71% increase in 2023. Solar now provides 10% of Brazil’s electricity in 2024, up from just 1% five years ago.
Over the last five years, 99 countries have doubled the amount of electricity they produce from solar power. This includes emerging economies such as South Africa, countries with the largest power systems in the world such as China and the United States and countries with the highest shares of solar power in their electricity mix such as Hungary and Spain.
Growth in China means that more than half of solar generation is now outside of the OECD
In 2024, non-OECD economies accounted for 58% of global solar generation, with 39% in China alone. This marks a significant change from a decade ago, in 2014, when OECD countries made up 81% of global solar generation.
As this growth continues to spread, new solar superpowers are emerging. In 2022, India overtook Japan to become the third-largest solar generator in the world. In 2024, Brazil overtook Germany to become the fifth-largest. Alongside China, this means that BRICS members now represent three of the world’s top five solar generating countries.
This trend shows no signs of slowing, with solar generation in China growing by 250 TWh in 2024, compared to the 142 TWh increase seen in OECD countries. Solar capacity installations in China were 30% higher than in 2023, while in India, 2024 installations doubled from the previous year (see Chapter 2.3).
Exports data reveals solar growth is taking off in new markets
Solar is now so cheap that large markets can emerge in the space of a single year – as evidenced in Pakistan in 2024. Amid high electricity prices linked to expensive contracts with privately-owned thermal power stations, rooftop solar installations in Pakistan’s homes and businesses soared as a means of accessing lower cost power. The country imported 17 GW of solar panels in 2024 to meet this growing consumer demand, double the amount imported the year before. Within just a year, Pakistan became one of the world’s largest markets for new solar installations in 2024. Pakistan’s case shows that the low-cost, fast-to-build nature of solar power can transform electricity systems at an unprecedented rate. Updated system planning and regulatory frameworks are needed alongside this deployment to ensure a sustainable and managed transition.
There are signs in other regions that more rapid change could be around the corner. Because Chinese factories account for more than 80% of global solar manufacturing capacity, data on exports from China can act as a proxy for demand in countries without a domestic solar manufacturing industry. Data for 2024 reveals a considerable rise in solar exports to the Middle East and Africa – two of the world’s sunniest regions that have historically had very low levels of installed capacity. In both regions, imports of solar panels have tripled in the last two years.
South Africa imported 3.8 GW of solar panels in 2024, following a record-breaking 2023 when 4.3 GW were imported as consumers turned to the technology amid rising blackouts. Nigeria and Morocco imported 1.3 GW and 1.1 GW respectively, marking the first time that either country has imported more than 1 GW in a single year.
In the Middle East, Saudi Arabia imported 16 GW in 2024, more than double the amount imported the year before. Oman saw the largest percentage growth in imports in the region, with 2.5 GW of imports in 2024 representing a fivefold increase from the year before.
Flexibility can enable further growth in solar power generation
Solar power’s role in the mix varies greatly throughout the day in markets with high solar shares. During the sunniest parts of the day, solar quickly becomes the main source of electricity in countries such as Chile and the Netherlands before dropping away again as the sun goes down. This variability can mean that low cost electricity goes unused during peak solar hours, and the impact of this on wholesale prices can affect the economics of projects for developers. Falling battery prices now mean there is an opportunity to better integrate far higher levels of solar and other variable sources of power.
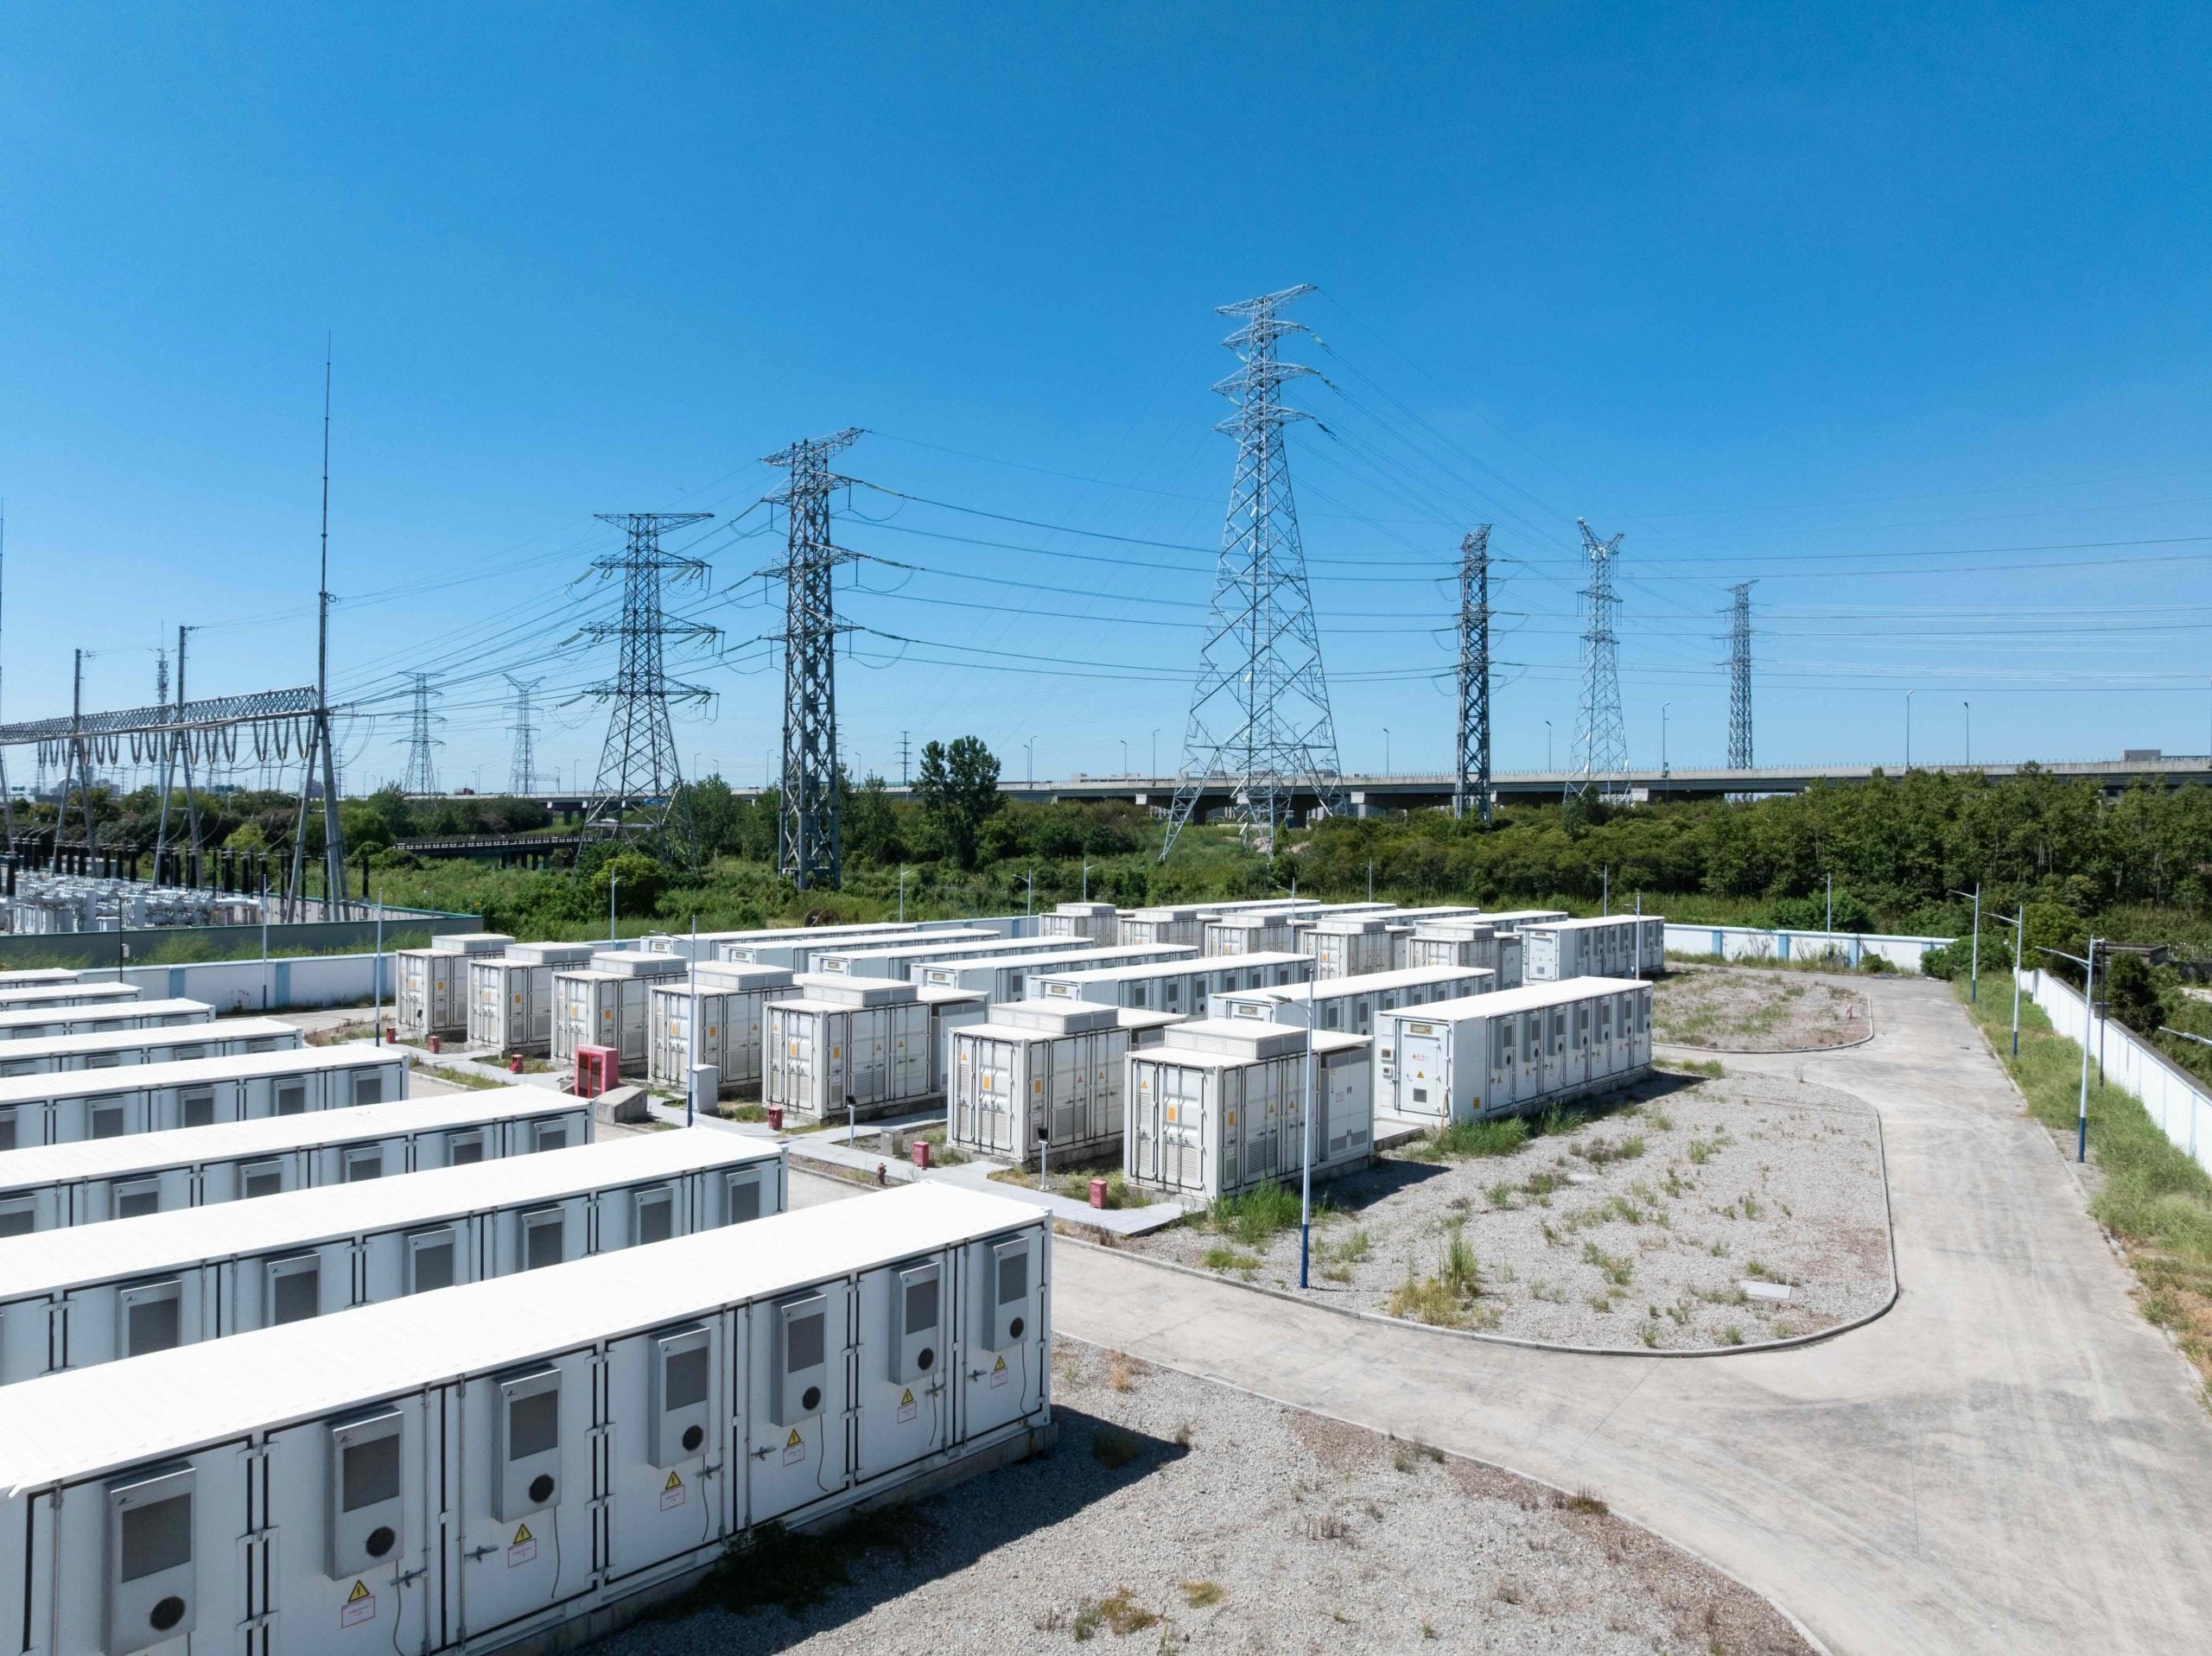
Falling prices make battery storage a winning solution
Battery storage technology, much like solar panels, has undergone rapid cost reductions in the last decade. The average price of lithium ion battery packs dropped to $115 USD/kWh in 2024, a 20% cost reduction from the year before and 84% lower than the average cost a decade ago. As the price has fallen, annual installations of battery storage capacity have increased dramatically at an average rate of 67% per year over the last decade. 69 GW of battery storage capacity was installed in 2024 – almost enough to double total battery storage capacity, which stood at 86 GW in 2023.
The 20% fall in battery pack costs in 2024 marks the largest percentage reduction in cost in a single year since 2017, and the largest absolute reduction since 2019. These cost reductions have been driven by economies of scale as manufacturing capacity has stepped up, and by increased adoption of lower-cost battery chemistries such as lithium iron phosphate (LFP), which eliminates the need for nickel and cobalt. Material costs have also come down after a brief surge in lithium prices in 2022.
Solar and batteries combined are a powerful combination
The low cost of lithium ion batteries makes them an ideal choice for storing the excess electricity produced by solar power during the sunniest hours until it is most needed. Alongside other storage technologies, demand-shifting and enhanced interconnection between countries, they can enable larger amounts of solar power to be successfully integrated into power systems.
In Europe, co-locating battery storage systems with solar plants improves the business case for solar. A recent study found that in Germany, the cost of building and operating utility-scale solar with integrated battery storage has now become cheaper than the equivalent cost for gas-fired power plants.
In the United States, California is at the forefront of using battery storage to complement large amounts of solar power. In 2024, batteries routinely met close to a fifth of daily peak load in the evening hours, displacing gas generation. This has been a rapid change: the average share of evening peak load met by batteries nearly doubled from 2023 to 2024, while just three years ago, California’s battery fleet met less than 2% of evening peak load.
Batteries have now become so cost-competitive that they have opened up the possibility of round-the-clock solar power becoming a reality. In early 2025, the world’s first 24-hour solar PV project was announced – 1 GW of baseload electricity capacity in Abu Dhabi. The state-owned renewable energy company Masdar provided a $6 billion investment to build 5 GW of solar and 19 GWh of battery capacity, planned to come online in 2027.
The potential for round-the-clock solar will be transformative, outcompeting fossil fuels both on costs and security of supply. The rapid growth of solar and batteries is already transforming electricity systems around the world, but there will be an even more profound shift in the coming years as energy storage technologies reach scale.
2.2
Clean generation is expected to meet higher levels of demand growth
Emerging drivers of demand like EVs, heat pumps and data centres have structurally raised demand growth. Though long-term demand forecasts have been revised upwards, there remain uncertainties about the scale of growth that will materialise in the coming years. Clean generation is still expected to expand quickly enough to exceed higher levels of demand growth, but achieving significant reductions in fossil fuel generation will now require higher levels of clean deployment.
Demand growth is higher than it used to be
2023 and 2024 saw the same rate of electricity demand growth of 3.3%, once adjusted for differences in temperatures (see chapter 1). This is higher than the 2.5% average growth seen over the previous decade, and in part reflects the emergence of new drivers of electricity demand such as EVs, heat pumps and data centres. Combined, these three technologies increased electricity demand by 0.7% in 2024. This is more than double the rate of demand increase they contributed five years ago, when they were responsible for increasing global electricity demand by 0.3% per year.
Emerging drivers cause higher rates of electricity demand growth
Emerging drivers of electricity demand such as EVs, data centres and heat pumps have shown similar rates of growth over the last two years. These three technologies are estimated to have added 0.7% to global demand in 2024 (+195 TWh), a slight step up from the 0.6% they added in 2023 (+174 TWh).
Electrification is a major driver, as systems that once ran on fossil fuels switch to electricity, increasing electricity demand but reducing overall energy demand through efficiency gains. EV electricity demand grew by an impressive 38% in 2024 (+62 TWh), increasing from 163 TWh in 2023 to 225 TWh in 2024 and adding 0.2% to global electricity demand. This increase was five times larger than the growth in EV electricity demand seen in 2019. Heat pumps are estimated to have added an additional 22 TWh electricity demand in 2024, which was lower than the 25 TWh seen in 2023, as sales in key markets slowed slightly.
Demand from data centres and cryptocurrency mining is estimated to have increased by 20% (+111 TWh) in 2024, slightly higher than the increase seen in 2023. This added 0.4% to global electricity demand in both years. Crypto mining is estimated to have driven 40% of the overall 111 TWh increase in 2024.
These emerging drivers mean that electricity demand growth is structurally higher than it was over the previous decade, when it averaged 2.5% per year.
Expectations rise for future demand growth, but remain uncertain
Looking to the future, forecasts for electricity demand growth have been revised upwards. If high short-term forecasts become reality, it would represent a big step up in structural demand growth compared with 2024. The size of temporary factors driving demand growth in 2024 raise questions about whether this high growth will be maintained in 2025. In the longer term, the scale of future growth of emerging drivers of demand remains uncertain.
Expectations for future electricity demand growth are now much higher than they used to be
The International Energy Agency’s (IEA) current outlooks for future electricity demand envisage higher levels of demand growth than was previously expected. The IEA’s STEPS scenario released in October 2024 forecasts annual demand growth of 3.3% between 2023 and 2030, higher than the 2.7% growth they forecast in 2023 between 2022 and 2030. The upgrade to 3.3% annual growth equates to an additional 1,687 TWh of annual electricity demand by 2030, with the IEA citing increased expectations for demand from data centres as well as increased power usage for cooling, alongside electric mobility and light industrial consumption.
More recent analyses point to even faster growth. In February 2025, the IEA published a short-term forecast for the years 2025-2027, in which total generation is expected to increase by an average of 3.7% annually.
Factors driving demand growth in 2024 raise questions about whether this high growth will be maintained in 2025
There are reasons to question whether the levels of demand growth forecast by the IEA for the next three years will materialise. If they do, this would represent a significant increase in structural demand growth. Two key factors – the impact of heatwaves globally and a rebound in industrial demand in China in January 2024 – added considerably to demand growth last year but will not contribute this same amount year after year. Combined, these factors were responsible for almost a quarter of the demand growth seen in 2024; without them, demand growth would have been 0.9% lower.
Temperature effects were the most significant temporary factor, adding 0.7% to demand growth in 2024 because of much higher temperatures around population centres compared with the year before (see Chapter 1). If 2025 sees the same intensity of heatwaves as in 2024, this would result in no year-on-year impact on demand growth caused by temperatures. If other demand growth were to remain stable year-on-year, then 2025 would see electricity demand growth of 3.3% instead of the 4.0% seen in 2024. If summer temperatures in 2025 are cooler than in 2024, then demand growth would be even more modest.
Secondly, China’s industrial demand growth is unlikely to be as high in 2025 as it was in 2024, when it was still being influenced by the economic recovery from Covid-19. January 2024 saw a significant rebound (+58 TWh) in industrial electricity demand in China compared to the reduced level seen in January 2023, which was affected by Covid-19. The increase in Chinese industrial demand in January 2024 alone contributed 0.2% to global demand growth in 2024. The high rate of growth seen in the first month of the year was not sustained throughout the rest of 2024.
Without these additional factors driving demand growth beyond 2024, the IEA’s forecast of 3.7% annual growth in total power generation over the next three years would represent a significant step up in structural growth. It remains to be seen if such high levels materialise.
Large uncertainties remain across many sectors
Electricity demand growth forecasts are being revised upwards amid intense speculation about the impact of new major consumers such as data centres.
Rising demand for electricity to train models for artificial intelligence has increased data centre power consumption in recent years, following a period of stable demand in the sector. Looking forward, recent projections from the Lawrence Berkeley National Laboratory (LBNL) suggest that electricity consumption by US data centres could triple from 176 TWh in 2023 to reach 580 TWh in 2028 – which would then account for 12% of US electricity demand. However, the LBNL’s lower-end estimate places demand from data centres at 325 TWh, just over half the high-case estimate. The uncertainty in these forecasts by 2028 is equivalent to Australia’s annual electricity consumption.
Clean electricity is growing quickly enough to meet higher levels of demand growth
Clean generation is still expected to exceed growth in electricity demand
Forecasts for wind and solar capacity additions from the Global Wind Energy Council (GWEC) and Bloomberg New Energy Finance (BNEF) predict strong growth in both technologies. BNEF predicts solar capacity additions to reach close to 1 TW per year by 2030, up from the 585 GW seen in 2024. Meanwhile, GWEC expects annual wind capacity additions to reach 182 GW by 2028.
Assuming typical capacity factors, we estimate that these new additions would result in solar generation growth of 21% on average per year between 2024 and 2030, and wind generation growth of 13% per year. Combined with modest growth in hydro and nuclear power, clean generation is expected to grow at an average rate of 9% per year between now and 2030, adding a combined 8,399 TWh of annual generation by 2030.
The expected growth in clean sources would be sufficient to keep pace with a demand increase of 4.1% per year to 2030, which exceeds the 3.3% demand growth expected in the IEA’s STEPS scenario as well as their short-term forecast of 3.7% growth over the next three years.
The expectations for demand and clean growth mean that fossil generation is set for structural decline over the rest of the decade, by a small margin in the near-term and a confident margin by the end of the decade.
Separating the signal from the noise for future fossil generation
Clean generation growth is expected to exceed demand growth over the rest of the decade, but in the short-term the higher expectations for demand growth means the gap with clean generation growth has narrowed. Over the next few years, the size of changes in fossil generation will be small but noisy, and partially determined by fluctuations in weather conditions from one year to the next.
As an example, temperature effects increased demand growth by 208 TWh in 2024, but reduced demand growth by 186 TWh in 2023. Weather conditions can also impact the supply of clean generation: wind and hydro conditions in 2024 were both below the long-term average. If global weather conditions in 2024 had been in line with the five-year average, wind generation would have been 3.7% higher (+92 TWh) and hydro generation would have been 2% higher (+86 TWh). How these factors interact in the coming years will significantly determine the scale of fossil generation declines.
Although the world is close to a new era of structurally falling fossil power, in the short-term there are likely to be year-on-year fluctuations with small increases or decreases in fossil generation depending on weather conditions and other temporary factors. In the long-term, despite higher demand growth projections, clean growth will be sufficient to maintain consistent declines in fossil generation. However, based on current industry forecasts these declines will initially be small. Unlocking rapid declines in fossil generation will require faster deployment of clean generation, alongside the expansion of grids and flexibility mechanisms such as storage.
2.3
Future electricity demand growth in India and China will be powered by clean sources
China and India are breaking the long-standing link between electricity demand growth and fossil fuel expansion in the power sector. In 2024, China’s clean electricity additions met 81% of demand growth, driven by record installations of wind and solar capacity. India’s solar capacity additions in 2024 doubled compared to 2023. The two largest emerging economies are on a path of clean electricity expansion that is set to reverse their power sector fossil growth trends, tipping the global balance on fossil generation.
China and India are decoupling electricity demand growth from fossil growth
China’s and India’s economic development has been accompanied by large increases in electricity demand. India’s electricity demand has tripled in the last two decades, while China’s has quadrupled. Fast paced clean electricity deployment is now breaking a long-term trend, as fossil generation is no longer growing at the same rate as electricity demand. This decoupling is happening because a growing share of demand growth is being met by an expansion of clean sources rather than fossil generation.
In China, this process started in the early 2010s, with rising wind, hydro and nuclear power meeting increasing shares of demand growth. In recent years, solar has surged to the point where clean sources are now growing at a rate fast enough to meet all demand growth – bar yearly fluctuations in weather affecting demand and hydro output – and are on track to start replacing fossil generation.
India’s decoupling of demand growth and fossil growth began more recently. In 2024, India still met about two-thirds of its demand growth with fossil fuels, specifically coal power. With increasing deployment of clean capacity, India could meet all new demand growth with clean electricity as soon as 2030, according to the IEA’s STEPS scenario. This would lead to a plateauing of fossil generation in the country. Ember’s modelling of India’s power sector to 2032 shows that limiting the growth of fossil fuels through a build-out of renewables, particularly solar power, brings cost benefits.
The end is in sight for China’s fossil-based demand growth
China’s staggering growth in electricity demand over the last two decades was accompanied by a rapid rise in fossil generation. Wind, solar, hydro and nuclear deployments have now reached levels sufficient to meet China’s structural (non-temperature related) annual rise in power demand. As a result, a substantial expansion of fossil generation is increasingly unlikely.
Clean electricity deployment in China takes the next step
In the last two years, China has seen a surge in clean electricity, primarily driven by large-scale wind and solar rollouts. Solar capacity jumped by 217 gigawatt of AC capacity (GWac) in 2023—more than double the 86 GWac added the previous year (many countries report solar capacity data in AC instead of DC. DC capacity is used in this report if not otherwise specified). In 2024, capacity installations increased further to reach 277 GWac. This constitutes more than a tripling of the installation rate in just two years. Wind capacity saw the highest-ever additions in 2024, with 79 GW installed after a record-setting 2023 (76 GW).
With this rapid increase in 2023 and 2024, China more than doubled its total installed solar capacity in just two years, rising from 393 GWac in 2022 to 887 GWac in 2024. China led the world in 2024 as it made up an estimated 57% of global solar capacity additions and 60% of global wind capacity additions. The step-up in capacity deployment in the last two years will not be an outlier. BloombergNEF expects China’s solar capacity deployment in 2025 to increase by a further 12% compared to 2024. As of 2024, China had nearly twice the amount of wind and solar capacity under construction as the rest of the world combined, pointing to continued fast growth in the coming years.
Additionally, China boasts the largest pipeline for large-scale hydroelectric power stations and nuclear plants, and has seen the largest increases from these sources of any country in recent years.
Combined, the scale of clean power deployment in China has reached a level where it can meet the structural growth in China’s electricity demand.
China’s record clean power additions put falling fossil power generation in sight
Growth in clean electricity generation met 81% of China’s increase in electricity demand in 2024, the highest share since 2015 when demand fell. The 6.6% (+623 TWh) rise in electricity demand was largely met by a rise in wind and solar generation (+356 TWh), and a rebound in hydro generation (+130 TWh). Consequently, fossil generation only increased by 116 TWh, a third of the increase seen in 2023.
However, hotter temperatures in 2024 compared to 2023 resulted in an elevated demand rise. The impact was particularly large during the heatwaves the country experienced in the summer of 2024. Without the effects of hotter temperatures, clean generation would have been enough to meet 97% of China’s rise in electricity demand.
Additionally, January and February saw the last effects of the rebound in industrial electricity demand after Covid-19 restrictions were lifted in early 2023. This temporary boost contributed to a 10.9% increase in overall electricity demand over January and February 2023, amounting to nearly a quarter (24%) of China’s total demand growth in 2024. For the rest of the year, demand grew at a much more moderate rate of 6.1%.
Short-term uncertainties, but long-term outlook points to falling fossil generation in China
China is close to meeting all demand growth with clean sources, which will mark a turning point where fossil fuels reach their peak and begin to decline. In the short term, uncertainties remain on both the demand and supply sides.
On the demand side, temperature fluctuations drive temporary changes from year to year. On the supply side, China’s hydro output rebounded by 130 TWh in 2024 after drought-induced lows in 2023. Yet capacity factors were still below historical levels, and further recovery in 2025 remains uncertain. While wind and solar outputs are generally more stable, the large installed capacity means that even small changes in wind conditions across years can significantly affect generation. In 2024, poorer wind conditions in China masked underlying growth from new capacity. Solar output varies less from year to year, but can still affect output notably.
These short-term factors can obscure underlying trends, making year-on-year predictions challenging. However, with rapid expansion in solar and wind capacity, further increases in fossil generation are becoming less likely. In fact, 2025 may mark the first decline in fossil generation since 2015 – even as electricity demand continues to rise – signaling an end to the era of sustained large-scale fossil generation growth in China.
India’s fossil surge could already be slowing
With China close to entering a new era of falling fossil generation, India is likely to become the country with the largest fossil generation growth in coming years, surpassing China. Just like in 2023, India recorded the second-largest increase in fossil generation of any country, at 67 TWh in 2024. However, India and similar emerging economies now have cleaner alternatives to fossil-led growth, limiting a potential surge in fossil generation.
India’s clean power deployment is ramping up
The economics for new power have shifted heavily in favour of renewables. The cost of solar power fell by more than 90% between 2010 and 2023. Consequently, deployment is rising sharply worldwide, and India is no exception. India’s solar power capacity increased by 24 GWac in 2024 – more than twice as much as in 2023. Only China and the US installed more solar capacity in 2024. Installations are only expected to increase further. Utility-scale projects already under construction as of January 2025 will nearly double India’s wind and solar capacity.
There are currently 143 GW of wind and solar capacity under construction in India, consisting of 82 GW of solar, 25 GW of wind and 36 GW of hybrid capacity (wind and solar), according to government reporting. These projects all have an expected completion date before the end of 2028.
India’s government has set a broader target of 500 GW for clean power capacity by 2030, up from 211 GW in 2024. Additionally, there are 5 GW of nuclear capacity and 15 GW of hydro capacity currently under construction, with commissioning expected before the end of 2028.
As explored in chapter 2.2, storage is a critical element of the continued build-out of flexible, cost-effective clean power, and India is no exception. To further accelerate the deployment and integration of solar power in India, the Indian government has advised implementing agencies and state utilities to include energy storage systems with a minimum of two hours of storage alongside solar facilities.
Clean electricity is reducing the need for additional fossil power
India’s rapid clean capacity growth will significantly reduce the increase in fossil generation over the next few years. In the six years between 2019 and 2024, electricity demand increased by 478 TWh, with clean generation meeting 33% of this increase. The IEA’s STEPS Scenario projects a further 844 TWh rise in electricity demand by 2030. Despite this larger increase, the rapid deployment of clean power, predominantly from solar and wind, could meet an estimated 75% of this demand growth.
Clean growth in China and India can tip the balance towards a decline in fossil generation at a global level
Bending the curve of fossil generation at a global level depends on country level trends. The first major emitters to industrialise – the EU, the US and other OECD economies – have seen fossil generation peak in the early 20th century and have contributed to a reduction of fossil use in the power sector for more than 15 years.
Simultaneously, fast growing Asian economies, especially China and India, have seen a rapid increase in electricity demand and fossil consumption for electricity. As a result, they have dominated the global increase in fossil generation over the past two decades.
In the last five years, global annual fossil generation has increased by 1,165 TWh. China alone accounted for 1,104 TWh of this increase, which was equivalent to 95% of the net global increase between 2020 and 2024. India contributed a further 322 TWh, or 28% of the net global increase. Other countries combined saw a net reduction of 260 TWh in fossil generation.
In the next five years, it is the trend reversal in China and India that will tip the balance towards a global decline in fossil generation. Using the IEA’s STEPS Scenario, India’s fossil generation is expected to grow by an estimated 197 TWh by 2029. This is consistent with estimates from India’s existing renewable capacity pipeline. This increase would be just under half of the increase over the previous five years.
The largest reversal according to the STEPS scenario would come from China, turning an increase of 1,104 TWh in the previous five years into a fall of 501 TWh for 2025-2029. As discussed earlier, this shift is driven by the rapid expansion of clean electricity, which has decoupled demand growth from fossil generation. Combined with larger falls in the rest of the world of 849 TWh, global fossil generation in 2029 would be 1,153 TWh (6.3%) lower than in 2024.
With China and India turning towards clean growth, established clean energy players need to double down
Overall, 115 countries making up 39% of global electricity demand have seen their fossil generation remain the same or decline over the last five years. If China and India join this group, it would raise the share of global electricity demand in economies with falling fossil generation to 79%, thereby tipping the balance on global fossil generation and power sector emissions.
Consolidating the fall in global fossil generation not only requires the rapid scale-up of clean power in China and India, but also the continued reduction of fossil generation in the United States, the EU and other advanced economies. Recent US policy announcements, signalling a trend reversal away from clean power back towards a growth model relying on more fossil fuels, risk slowing the decline of US fossil generation, which peaked in 2007.
The overall trend in the global power sector shows that the next few years will be marked by a rapid and increasing build-out of renewables, with solar power at the forefront. Countries that focus on adapting appropriate policies to take advantage of integrating these low-cost and fast-to-deploy technologies will reap the benefits of the clean energy transition. Those who choose to turn their backs risk being left behind.

Related Content