Appendix: Methodology
Downloads
Data
Global gridded data is provided in netCDF format. Data at the locations of GEM coal, oil and gas extraction sites and country production data are provided as CSV files. The global files are provided to enable data extraction for any location, not only the fossil fuel sites featured in the study, but also other sources such as landfill sites, and to support the creation of maps for sub-regions, countries, or other areas of interest.
For more details on the provided data, please refer to the data description document below.
Methods
This is a technical description of the method and inputs used to derive the detection categorisation.
Five gridded datasets are combined to create a score with three categories; favourable, moderate and difficult for methane detection. The scoring system is designed flexibly to be run on any spatial resolution or timestep. For the purposes of this study, each dataset is interpolated onto a consistent spatial and temporal grid (0.1o x 0.1o , which is approximately 10 km resolution at the equator, and a monthly timestep). The spatial grid was chosen to be the same as the ERA5-land grid.
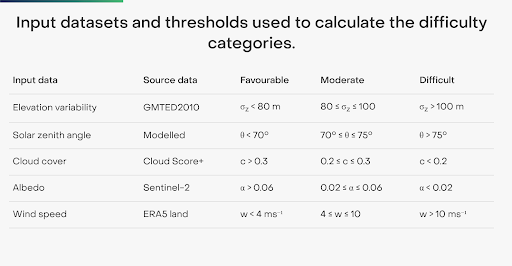
For each input dataset, the conditions in each grid cell are labelled as favourable, moderate or difficult, based on the thresholds defined in the table below.
A combined category for each grid cell / month is assigned as follows:
- Favourable : All inputs must have favourable categories.
- Moderate: One or more inputs must have a moderate category.
- Difficult: One or more inputs must have a difficult category.
The result is a detection category for every month, for every 0.1 degree pixel globally.
Elevation variability
Mountainous regions are identified using the variability in elevation from the GMTED2010 digital elevation model. The standard deviation of the elevation within a 0.1-degree grid box is derived from 30 arcsecond data. Standard deviations > 100m are classified as difficult. Values between 80m and 100m are classified as moderate and less than 80m are favourable. These thresholds are the same as those used to apply quality flags in the TROPOMI retrieval algorithm.
Solar zenith angle
Solar zenith angle is modelled using the day of the year and latitude. Monthly values are calculated as the mean of the maximum daily values. Solar zenith angles greater than 75o are classified as difficult, between 70o and 75o are moderate and less than 70o are favourable. These thresholds are taken from the quality flags applied to the TROPOMI retrieval algorithm.
Cloud Cover
We identify areas too cloudy for methane retrieval using the Cloud Score+ product, available on Google Earth Engine. The product has been derived using Sentinel-2 imagery and machine learning to identify the similarity between cloudy and clear sky images, and contains two cloud scores. Here, the so-called cs band is used, where values of 0 represent “cloudy” skies and 1 represents “clear” skies. Monthly mean Cloud Score + data were extracted for the years 2020-2023. A monthly average is calculated over these years to account for interannual variability in cloudiness.
The CloudScore+ developers provide a recommended threshold of 0.65 to distinguish between clear and cloudy days, however this threshold is only valid for the raw 10m daily data. A new threshold is needed when the data is aggregated onto the 0.1 degree spatial resolution and a monthly time step. The parameter tuning section below describes how the favourable threshold was empirically selected. The tuned cloud cover threshold for ‘favourable’ conditions was estimated to be greater than 0.3. The ‘difficult’ threshold was defined as ≤ 0.2. Judgement was used when selecting this threshold to ensure that countries had a distribution of oil, gas and coal production in both the ‘moderate’ and ‘difficult’ categories.
Albedo
Surface albedo in the shortwave infrared, where methane sensing takes place, was estimated from Sentinel-2 using band 12, centred around 2190 nm. The data is masked to remove inland water and ocean using the MODIS land classification map. The albedo was cloud masked using the Cloud Score+ product described above. Monthly average albedos are calculated using Google Earth Engine and aggregated from 10 m to 0.1o x 0.1o resolution. Monthly data is output for the years 2020-2023. A monthly average is calculated to account for interannual variability in albedo and reduce the impact of cloud cover on the data coverage. The parameter tuning section below describes how the threshold for favourable detection was selected. The empirically tuned albedo threshold for ‘favourable’ conditions was estimated to be greater than 0.06. The ‘difficult’ threshold is defined with albedos ≤ 0.02. This value was selected because it is associated with the low-quality data in the TROPOMI retrieval algorithm.
Wind speed
We use monthly mean zonal (u) and meridional (v) 10 metre wind speeds for the years 2020-2023 from the ERA5-Land dataset, available on the Copernicus Climate Data Store. Wind speed is calculated from the components and a monthly climatology is calculated. Wind speeds below 4m/s are labelled as favourable, between 4-10 m/s are labelled as moderate, and greater than 10m/s are labelled as difficult. The parameter tuning section below describes how the ‘favourable’ threshold was selected. For wind speed, ‘difficult’ was defined as exceeding a threshold of 10 m/s. This threshold was loosely informed by publications indicating that the probability of detection is lower at higher wind speeds. These studies showed reduced probability of detection up to 8 m/s, so we opted for 10 m/s to err on the side of caution. This is a semi-quantitative approach, as the threshold may vary depending on emission rates and there is no clear definition of the ‘moderate’ and ‘difficult’ categories.
Threshold tuning
To establish favourable thresholds for cloud cover, wind speed, and albedo, we tuned these parameters using 2,962 methane plume observations from TROPOMI, detected by Kayrros and IMEO. We explored a range of plausible threshold values—wind speed (1–14 m/s), cloud cover (0.25–0.6), and albedo (0.025–0.3)—and generated 500 different combinations using Latin hypercube sampling. For each combination, we checked how often TROPOMI observations happened in favourable locations and months. We defined the best set as the one that found observations in favourable conditions in about 85% of the cases.
Note that only the ‘favorable’ categories were tuned, as it is straightforward to define whether an observation exists or not. The threshold separating ‘moderate’ and ‘difficult’ categories was not tuned in this way because it is unclear how to do so precisely. Instead, we set those thresholds based on our judgement for each parameter, as described above.
Limitations of the method and future work
There are no universal thresholds that apply to all satellites, and individual sensors may be better at detecting methane than others in some environmental conditions. For instance, sensors with a high spatial resolution (e.g., GHGSat, EMIT, CarbonMapper) are able to detect methane in some mountainous regions where an area flux mapper (TROPOMI) would find this challenging. Moreover, for most parameters there exist no clear physical limits where the sensor stops detecting methane, but rather a gradual degradation of its expected performance. Threshold tuning was performed only on a limited dataset, based on one sensor, and including only positive detections. Therefore, all provided thresholds should be treated as rough guides and not as hard physical limits for satellite performance.
Another limitation is that the detection categories are based on monthly data, whereas satellite observations represent a single, instantaneous overpass. This simplification is due to the practicalities of managing large datasets. However, using monthly data may obscure the variability present in daily observations
Not all factors that impact methane retrieval are included in this study. For instance, high aerosol load could be of particular importance over arid and semi-arid regions but has not been taken into account. Ground albedo variability will also impact methane retrieval, especially for multi-spectral sensors, making it difficult to distinguish methane plumes from ground artefacts; this has also not been considered in this study.
Location fossil fuel assets
The locations of fossil fuel extraction sites are taken from the Global Energy Monitor (GEM) Global Coal Mine Tracker (GCMT) and Global Oil and Gas Extraction Tracker (GOGET). Monthly ‘difficult’, ‘moderate’ and ‘favourable’ categories are calculated for the nearest latitude and longitudes for 3,778 operational coal mines and 4,703 operational oil and gas upstream assets. Only onshore oil and gas exploration sites are included.
Fossil fuel production data
Coal production data is sourced from the recently released September 2024 supplement to the Global Energy Monitor’s Coal Mine Tracker. This supplement provides historical production figures for operational coal mines worldwide with capacities exceeding 1 million tonnes per year, covering the years 2017 to 2023. For the analysis, the production values from the most recent year available for each coal mine is used.
Oil and gas production data comes from the Global Oil and Gas Extraction Tracker (GOGET).
The data includes extraction sites that have production of 1 million barrels of oil per year or more and or reserves of 25 million barrels of oil. To estimate the combined oil and gas production, gas output is converted into barrels of oil equivalent per year. Similar to coal, the production data for the most recent available year is used in the analysis.
Production in ‘difficult’, ‘moderate’ and ‘favourable’ categories is calculated by multiplying the GEM production by the proportion of the year classified with each category. It is important to note that the GEM dataset does not include production information for all listed assets, resulting in some missing data. However, we chose this dataset because it is openly accessible.
Acknowledgements
Contributors
The authors would like to thank Reynaldo Dizon for creating the illustrations of this report.
The authors would also like to thank the number of colleagues that offered valuable comments during the conceptualisation and preparation of this report, including Dody Setiawan, Zitely Tzompa Sosa, David McCabe, Sabina Assan, Hannah Broadbent, Eleanor Whittle, Muyi Yang, Jonathan Banks, and Steve Reyes.
We thank all external reviewers for their feedback which helped to improve the report.
Cover image
Cover photo credit: Unsplash

Related Content