Graphic of the week
Discover a new graphic on the global clean energy transition every Monday.
Last updated: 1 June 2026
Featured insights
Visual storytelling highlights
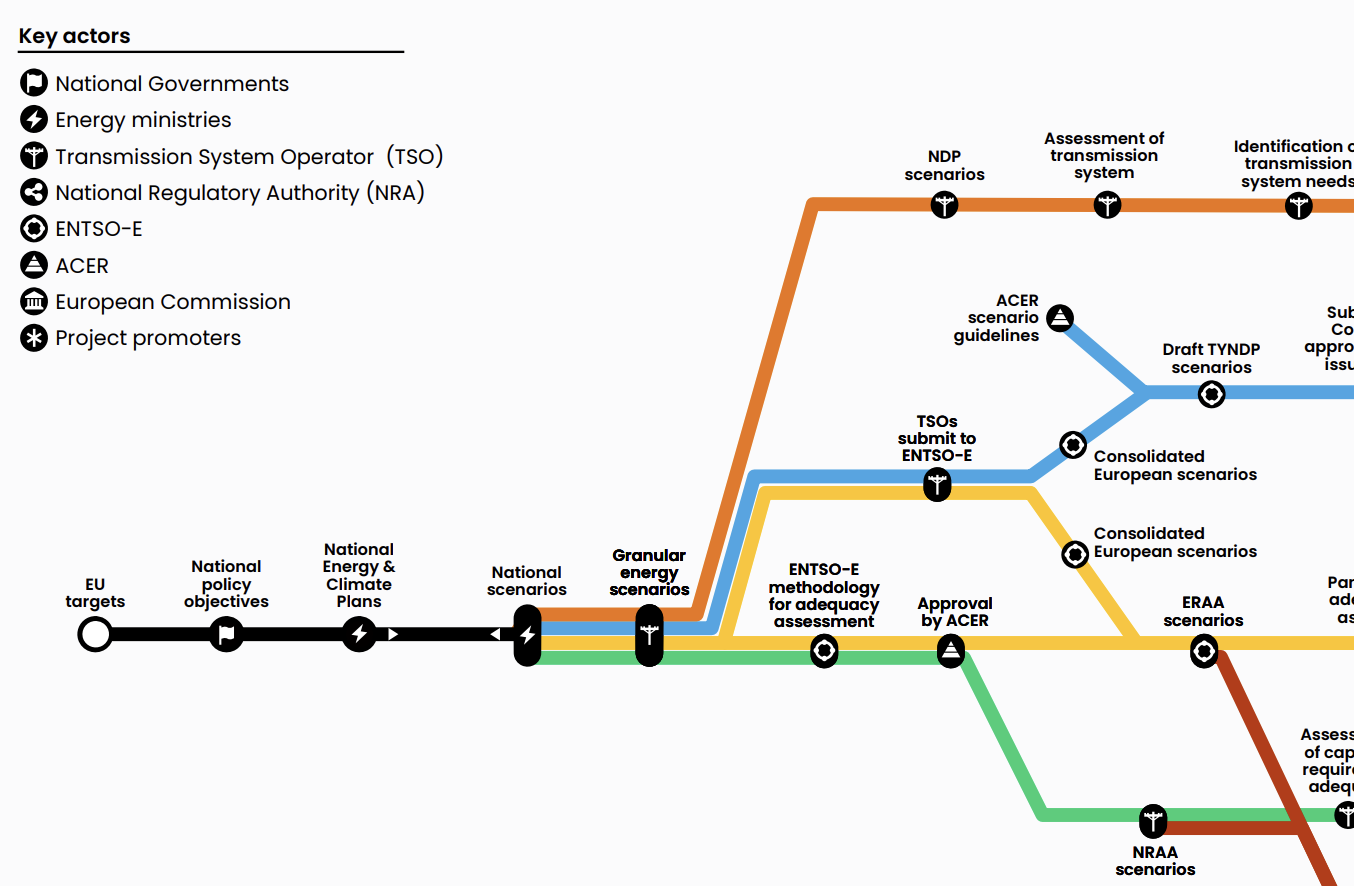
Navigating power system planning in the EU
Everything in the power system is connected – except how it is planned. How else would you explain the tangled web of processes used by EU countries to plan their future power systems, than as a tube map?
Published: 23 September 2025
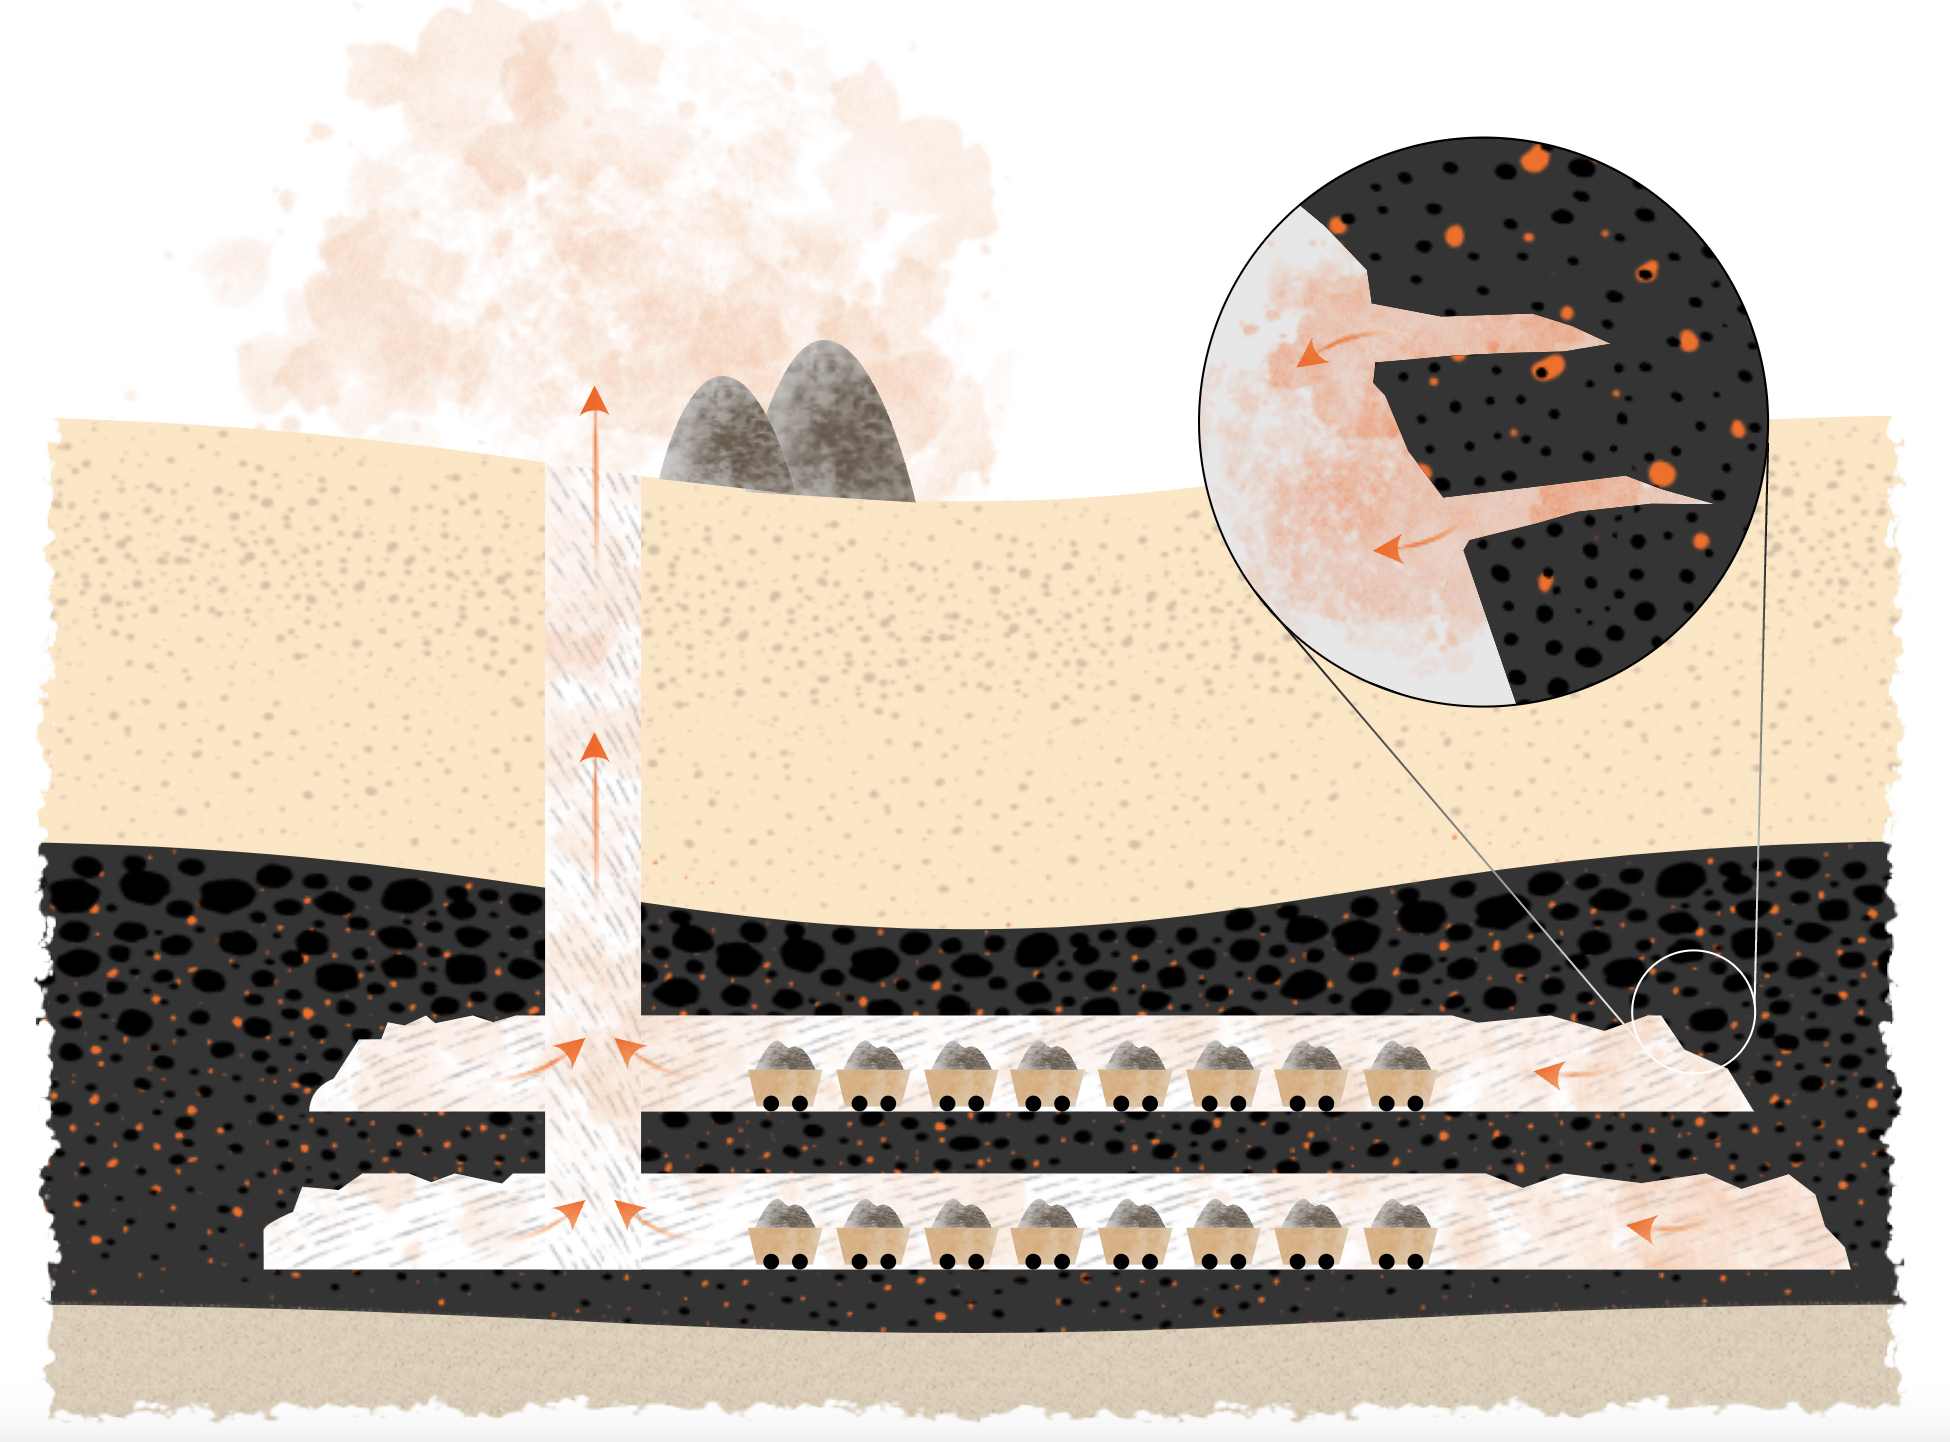
Coal is dirtier than you think
Burning coal for energy is the single largest contributor to global warming, accounting for 41% of global carbon dioxide emissions.
But there is one fact about coal that receives very little attention: coal mines are a major source of methane.
Related content

Datasets
Coal Mine Methane National Dataset
The latest data in coal mine methane emissions, satellite monitoring potential and confidence scoring in reported emissions.
Last Updated: June 1, 2026

Data tools
Wind and Solar Capacity Data Explorer
The latest monthly data on wind and solar capacity, including total installed capacity, month-on-month and year-to-date additions across 25 countries and economies, covering around 93% of global solar capacity and 92% of global wind capacity.
Last Updated: June 1, 2026
Data tools
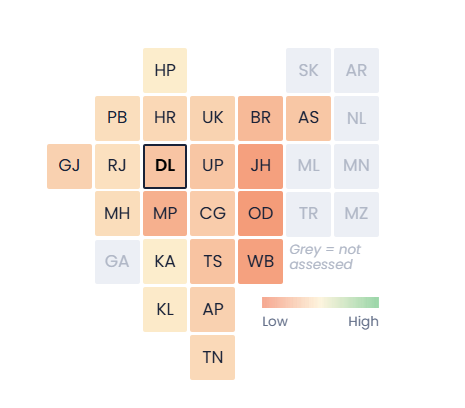
Indian States’ Electricity Transition (SET) Data Tool
India’s overall electricity transition depends on state-level action. Explore how states are progressing across transition parameters including solar and wind capacity addition, energy storage, as well as enabling policies for renewable energy integration and electric vehicle (EVs) adoption
Last Updated: June 1, 2026
Data tools
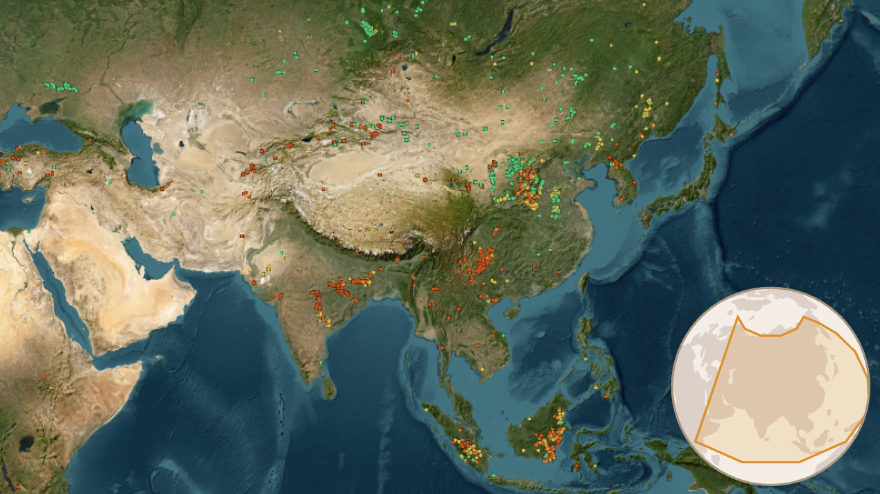
Satellite Coal Mine Methane Observation Map
An interactive map showing the potential of methane emission detection, via satellites, at worldwide coal mining sites throughout the year
Last Updated: June 1, 2026