

Europe Electrification Data Explorer
Track the progress of electrification across the 27 EU Member States, Norway and the UK. Explore sector-by-sector final energy consumption, domestic heat pump and electric vehicle deployment and avoided fossil fuel use data. The latest annual estimates are provided ahead of the official Eurostat figures.
Last Updated: 3 Nov 2026
Anchor point: Data tool
Anchor point: About
About Ember’s Europe electrification data explorer
Electrification means replacing fuels – often fossil fuels – with electricity for final energy uses such as heating buildings and road transport. Electrifying Europe’s energy system using homegrown clean power is the single most effective way to reduce the region’s dependence on imported fossil fuels. It is also critical to achieving the EU’s energy and climate goals, which include indicative electrification targets of 32.5% by 2030 and 45% by 2040.
Ember’s European electrification data explorer provides a unified, open-access platform for tracking how quickly electricity is replacing fossil fuels across the 27 EU Member States, Norway and the UK. The data is available at both sector and subsector level. The explorer also tracks the deployment of key technologies driving electrification, including electric vehicles and domestic heat pumps.
Our data explorer provides advance energy estimates, beating the statistical lag
Official European energy statistics have a significant structural lag. Eurostat’s complete annual energy balances are published 12–14 months after the end of the reference year. This means decision-makers are often steering policy and investment using data that is more than a year out of date.
By combining provisional Eurostat data with the latest national statistics, our tool delivers modeled estimates of final energy consumption several months ahead of the official Eurostat publication. This provides an early, reliable gauge of transition progress while policy and investment decisions can still influence its direction.
Open and reproducible data
All historical series, advance estimates and technology counts are freely available under the Creative Commons Attribution 4.0 (CC-BY 4.0) license and can be downloaded directly in CSV format.
Anchor point: Datasets

Anchor point: Methodology
Methodology
Read more about Ember’s methodology here:
Anchor point: FAQ
Frequently Asked Questions (FAQ)
Q: What is the current electrification rate of the European Union?
A: According to Ember’s advance estimate, electricity accounted for approximately 23.6% of final energy consumption across the EU-27 in 2025. The rate has risen slowly but steadily from 22.8% in 2021, although progress will need to accelerate to meet the EU’s targets.
Europe includes some global leaders: Norway has the highest electrification rate in Europe and is among the world’s most electrified countries at 54%, while Sweden and Finland both exceed 30%.
Q: How does Ember provide electrification data ahead of Eurostat?
A: Eurostat publishes complete annual national energy balances with a reporting lag of 12–14 months. Ember bridges this gap by combining more recent provisional Eurostat energy balances with the latest available national statistics to produce robust indicators for 2025.
Q: How often and when will this data explorer be updated?
A: The energy balances in the tracker will be updated as soon as new provisional or official data is available. The provisional Eurostat data used in our estimates is usually available 6 months after the end of the reference year. Official Eurostat energy balances are usually released 14 months after the end of the reference year. Heat pump sales and stock data are provided by the European Heat Pump Association, who typically release new annual data within three months of the end of the reference year. Electric vehicle data is taken from Ember’s global EV sales tracking tool, which is updated monthly.
Q: What is the difference between domestic heat pump stock and annual sales?
A: Heat pump sales are the number of new units sold during a calendar year. Heat pump stock is the total number of operational units currently used to heat buildings.
Q: Which countries are included in the Ember’s Europe Electrification Data Explorer?
A: The explorer covers 29 European countries: all 27 EU Member States, plus Norway and the United Kingdom.
Q: Are the energy balances shown in their net or gross energy content?
A: Energy balances can be expressed in either net or gross energy content, depending on which calorific values are used for conversion. Eurostat uses Net calorific values (NCV) to calculate its energy balances. UK energy balances as published by DUKES are expressed in gross calorific values (GCV). To maintain comparability between these two sources, Ember shows the UK energy balances in NCV as well, using the official calorific values published by DUKES.
Q: Why is the sum of sub-sectors shown in the tool not equal to the value of ‘All sectors’?
A: The fourth sub-sector, called ‘Other sectors’, cannot be viewed in the tool itself. It consists of ‘Agriculture and forestry’, ‘Fishing’ and ‘Unspecified other sectors’ and combined, their total energy consumption accounted for only 3.6% of the EU’s total energy consumption in 2024, which means their effect on Europe’s overall electrification trajectory is negligible. They are, however, included in the data available for download.
Anchor point: Contact


Related Content
Data tools
EV Sales Data Tracker
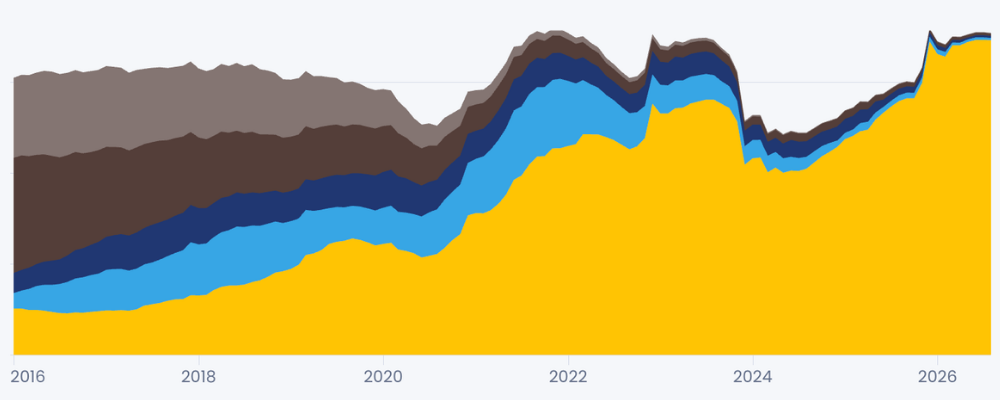
An open data tool to track and compare monthly figures for electric and combustion car sales in 56 countries, which accounted for over 90% of global EV sales in 2025. Includes estimates for EV oil displacement and global EV sales based on latest data.
Last Updated: 03/11/2026

Data tools
China Electricity Data Explorer
Explore province level electricity generation and emissions data for China
Last Updated: 03/11/2026

Data tools
Wind and Solar Capacity Data Explorer
The latest monthly data on wind and solar capacity, including total installed capacity, month-on-month and year-to-date additions across 25 countries and economies, covering around 93% of global solar capacity and 92% of global wind capacity.
Last Updated: 03/11/2026
Data tools
Indian States’ Electricity Transition (SET) Data Tool
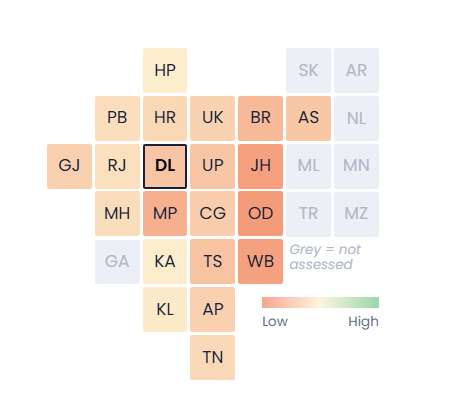
India’s overall electricity transition depends on state-level action. Explore how states are progressing across transition parameters including solar and wind capacity addition, energy storage, as well as enabling policies for renewable energy integration and electric vehicle (EVs) adoption
Last Updated: 03/11/2026