Electric Asia | Ember

Electric Asia

How Asia is leading the electric age, powering its rise and reshaping the global order.

11 Jun 2026
10 Minutes Read
Download PDF

Table of Contents

Full slidedeck
Read

Key highlights

4%
Asia has just 4% of global oil and gas reserves, which means it has to import $1.1tn of fossil fuels every year.
75%
Asia manufactures three quarters of the electrotech machinery powering the electric age.
84%
84% of Asia’s electricity demand is in economies with higher electrification rates than the United States.

About

This report examines the Electrotech Revolution in Asia, three groups of technologies transforming how the world generates, uses and moves electrons: renewable supply from solar and wind; electricity demand from electric vehicles to heat pumps; and connections from batteries to digitalisation. It analyses the incentives driving the shift and the stakes for the region.

It covers four sub-regions – Greater China, Southeast Asia, South Asia and Northeast Asia – and draws on Ember data for electricity generation, the International Energy Agency for final energy demand and UN Comtrade for trade flows. Further details on methodologies and data sources are given in the Appendix.

Executive summary

The electric age and the rise of Asia

If the defining economic story of the century is the rise of Asia, the defining energy story is the rise of electricity. The two are usually told apart. This report argues they are one: Asia’s rise is electric, and the electric age hastens Asia’s rise.

Electricity has been the century’s fastest-growing energy carrier, overtaking oil in 2007 as the leading supplier of useful energy worldwide. Over the same years, Asia has been the fastest-growing region. In 2016, China passed the United States in purchasing-power terms, and South and Southeast Asia together passed the European Union in 2021. Two features bind these stories together.

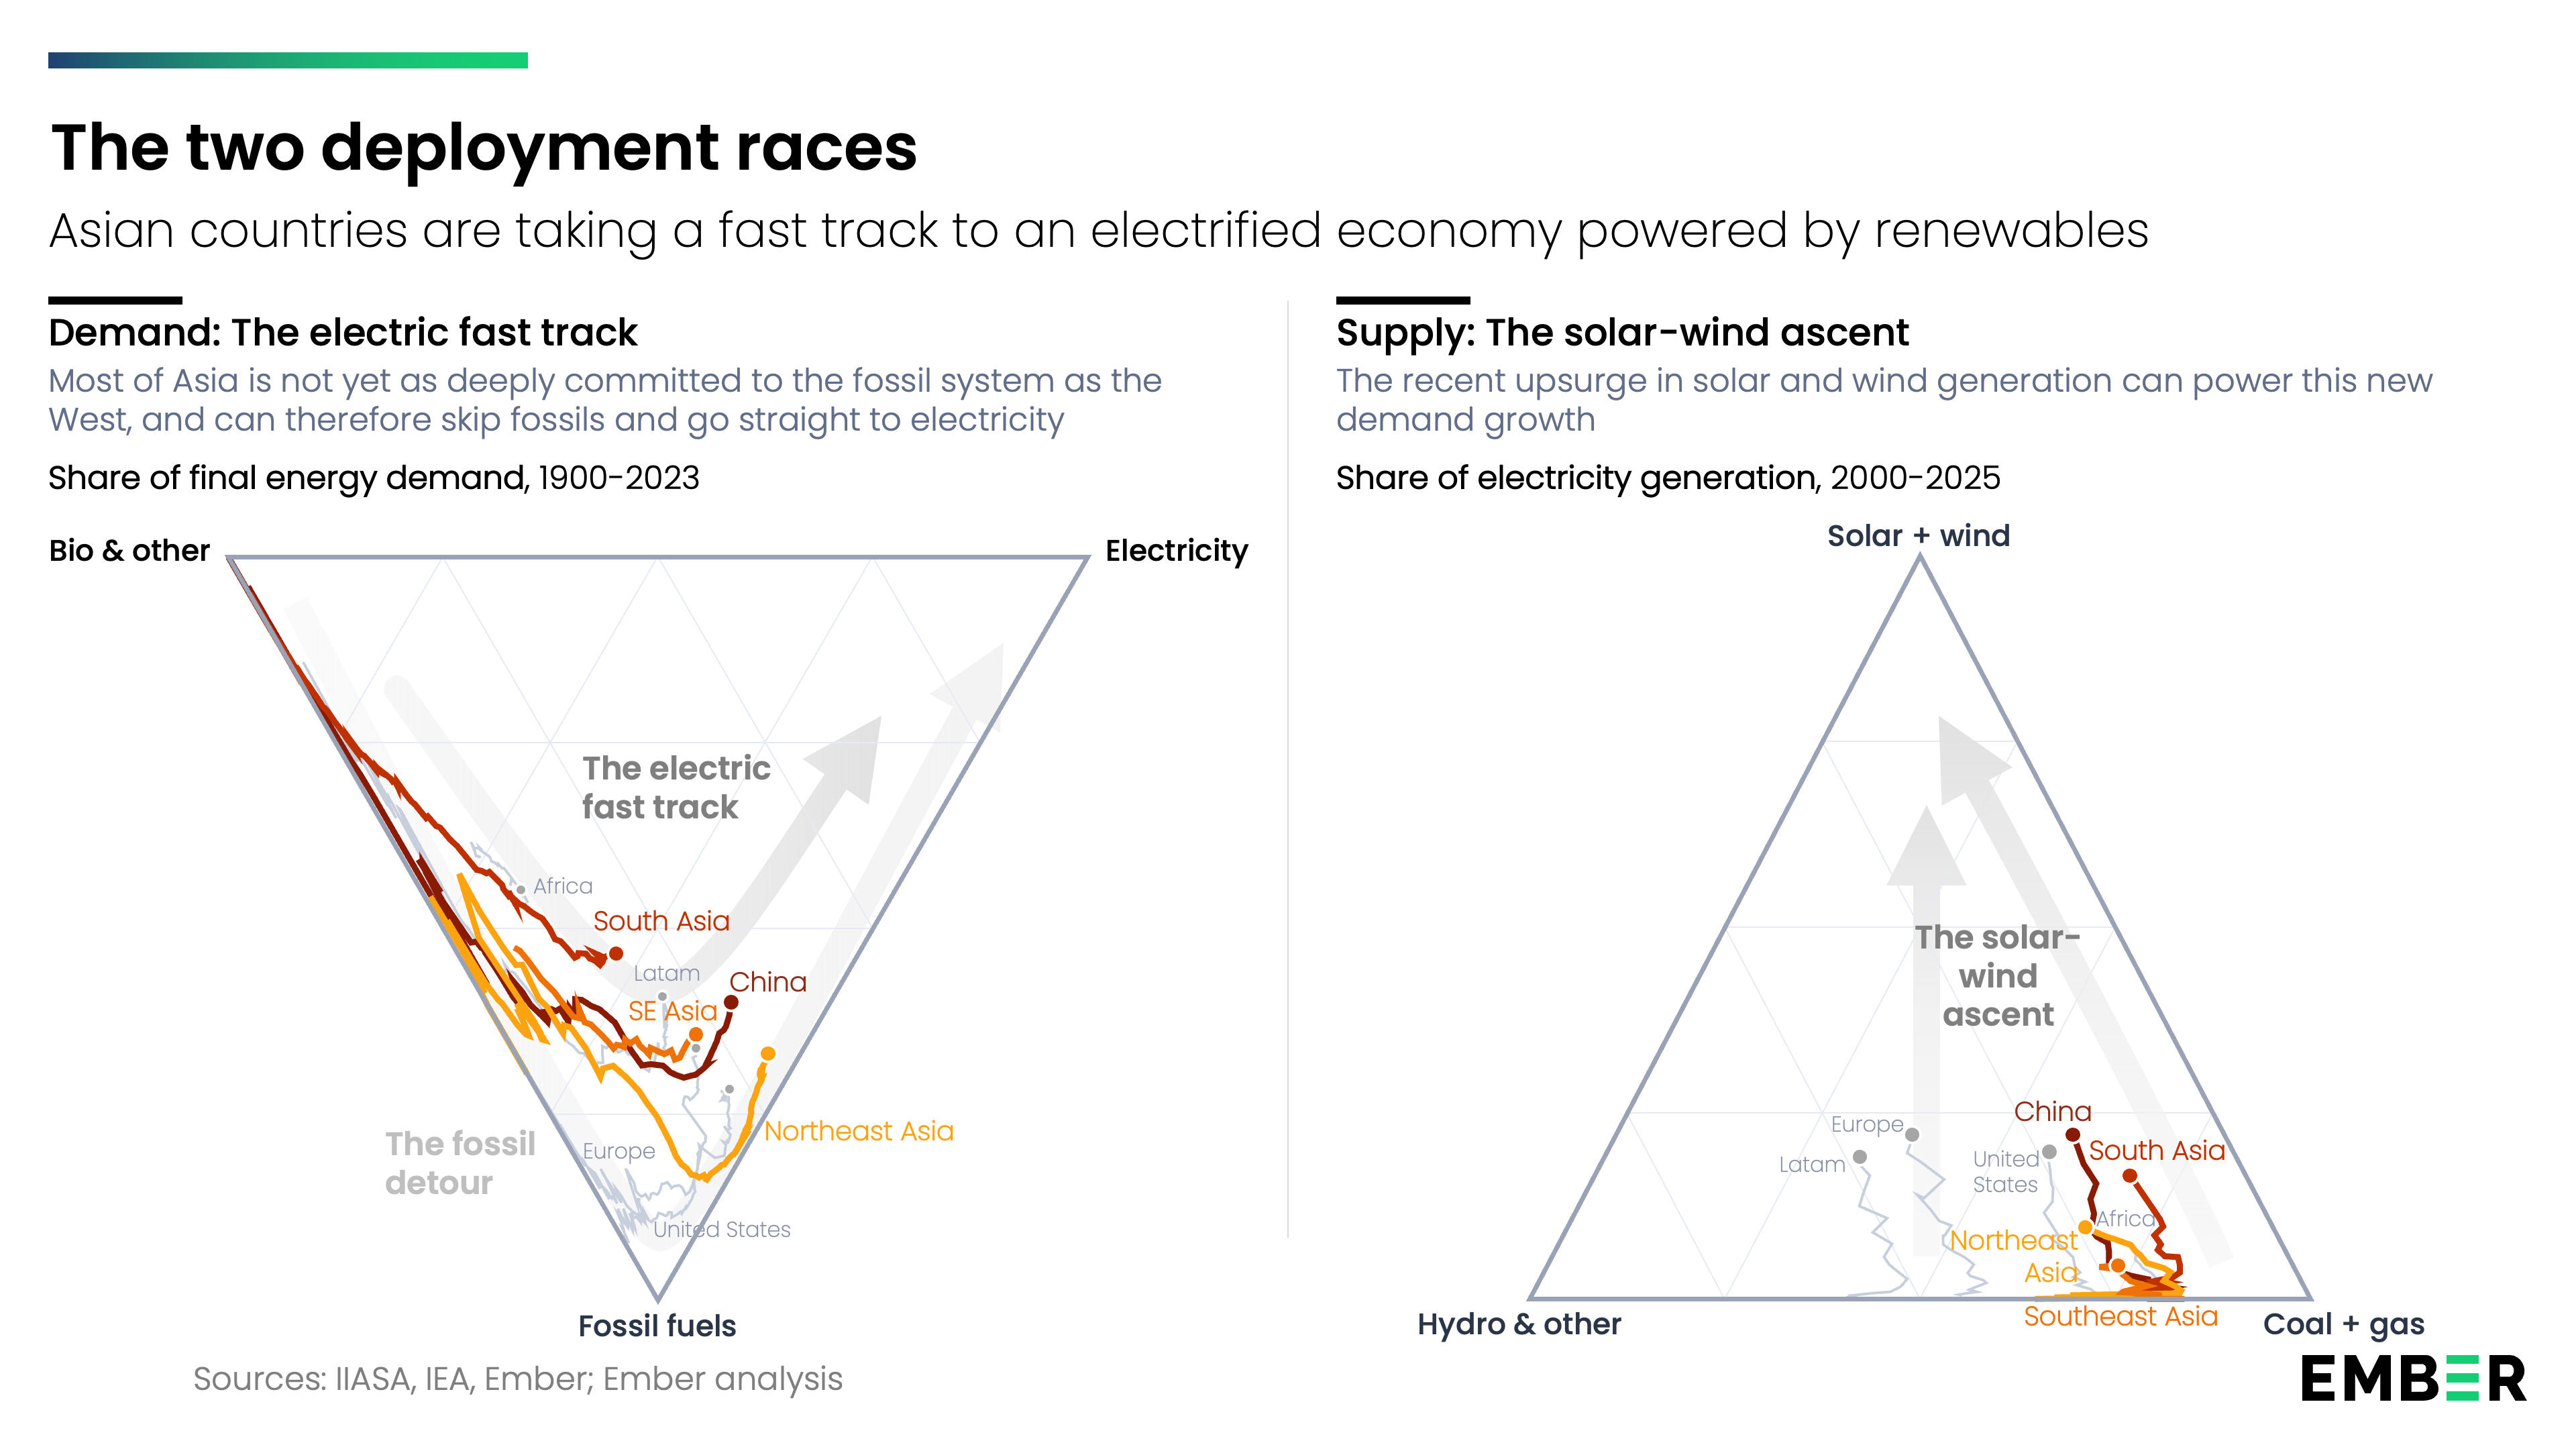
The first is that Asia is taking an electric path. Since the turn of the century, Asia has driven three quarters of the growth in global electricity. In the West, GDP and electricity demand decoupled long ago; in Asia, they rise in lock-step. Asia has achieved greater electrification at lower incomes per capita. No growth in history has been this electric.

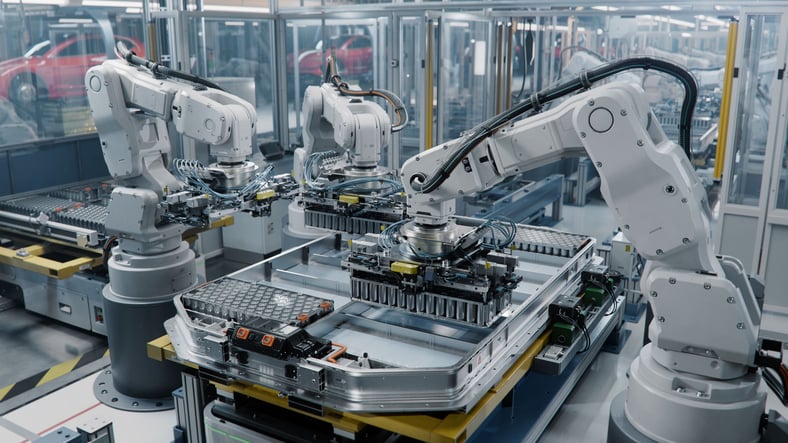
The second runs deeper. It is a change in what energy is. Coal, oil and gas are commodities, dug from the ground. Solar panels, batteries and wind turbines are technologies, built on a production line. The energy revolution is the shift from extraction to manufacturing.

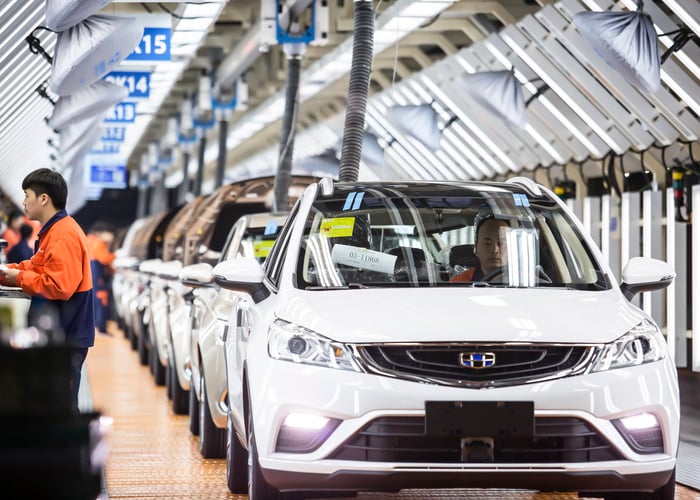
Enter Asia – the world’s factory. Asia builds most of the world’s solar panels, batteries, power electronics, electric motors and cars. Its strengths fit the new energy system.

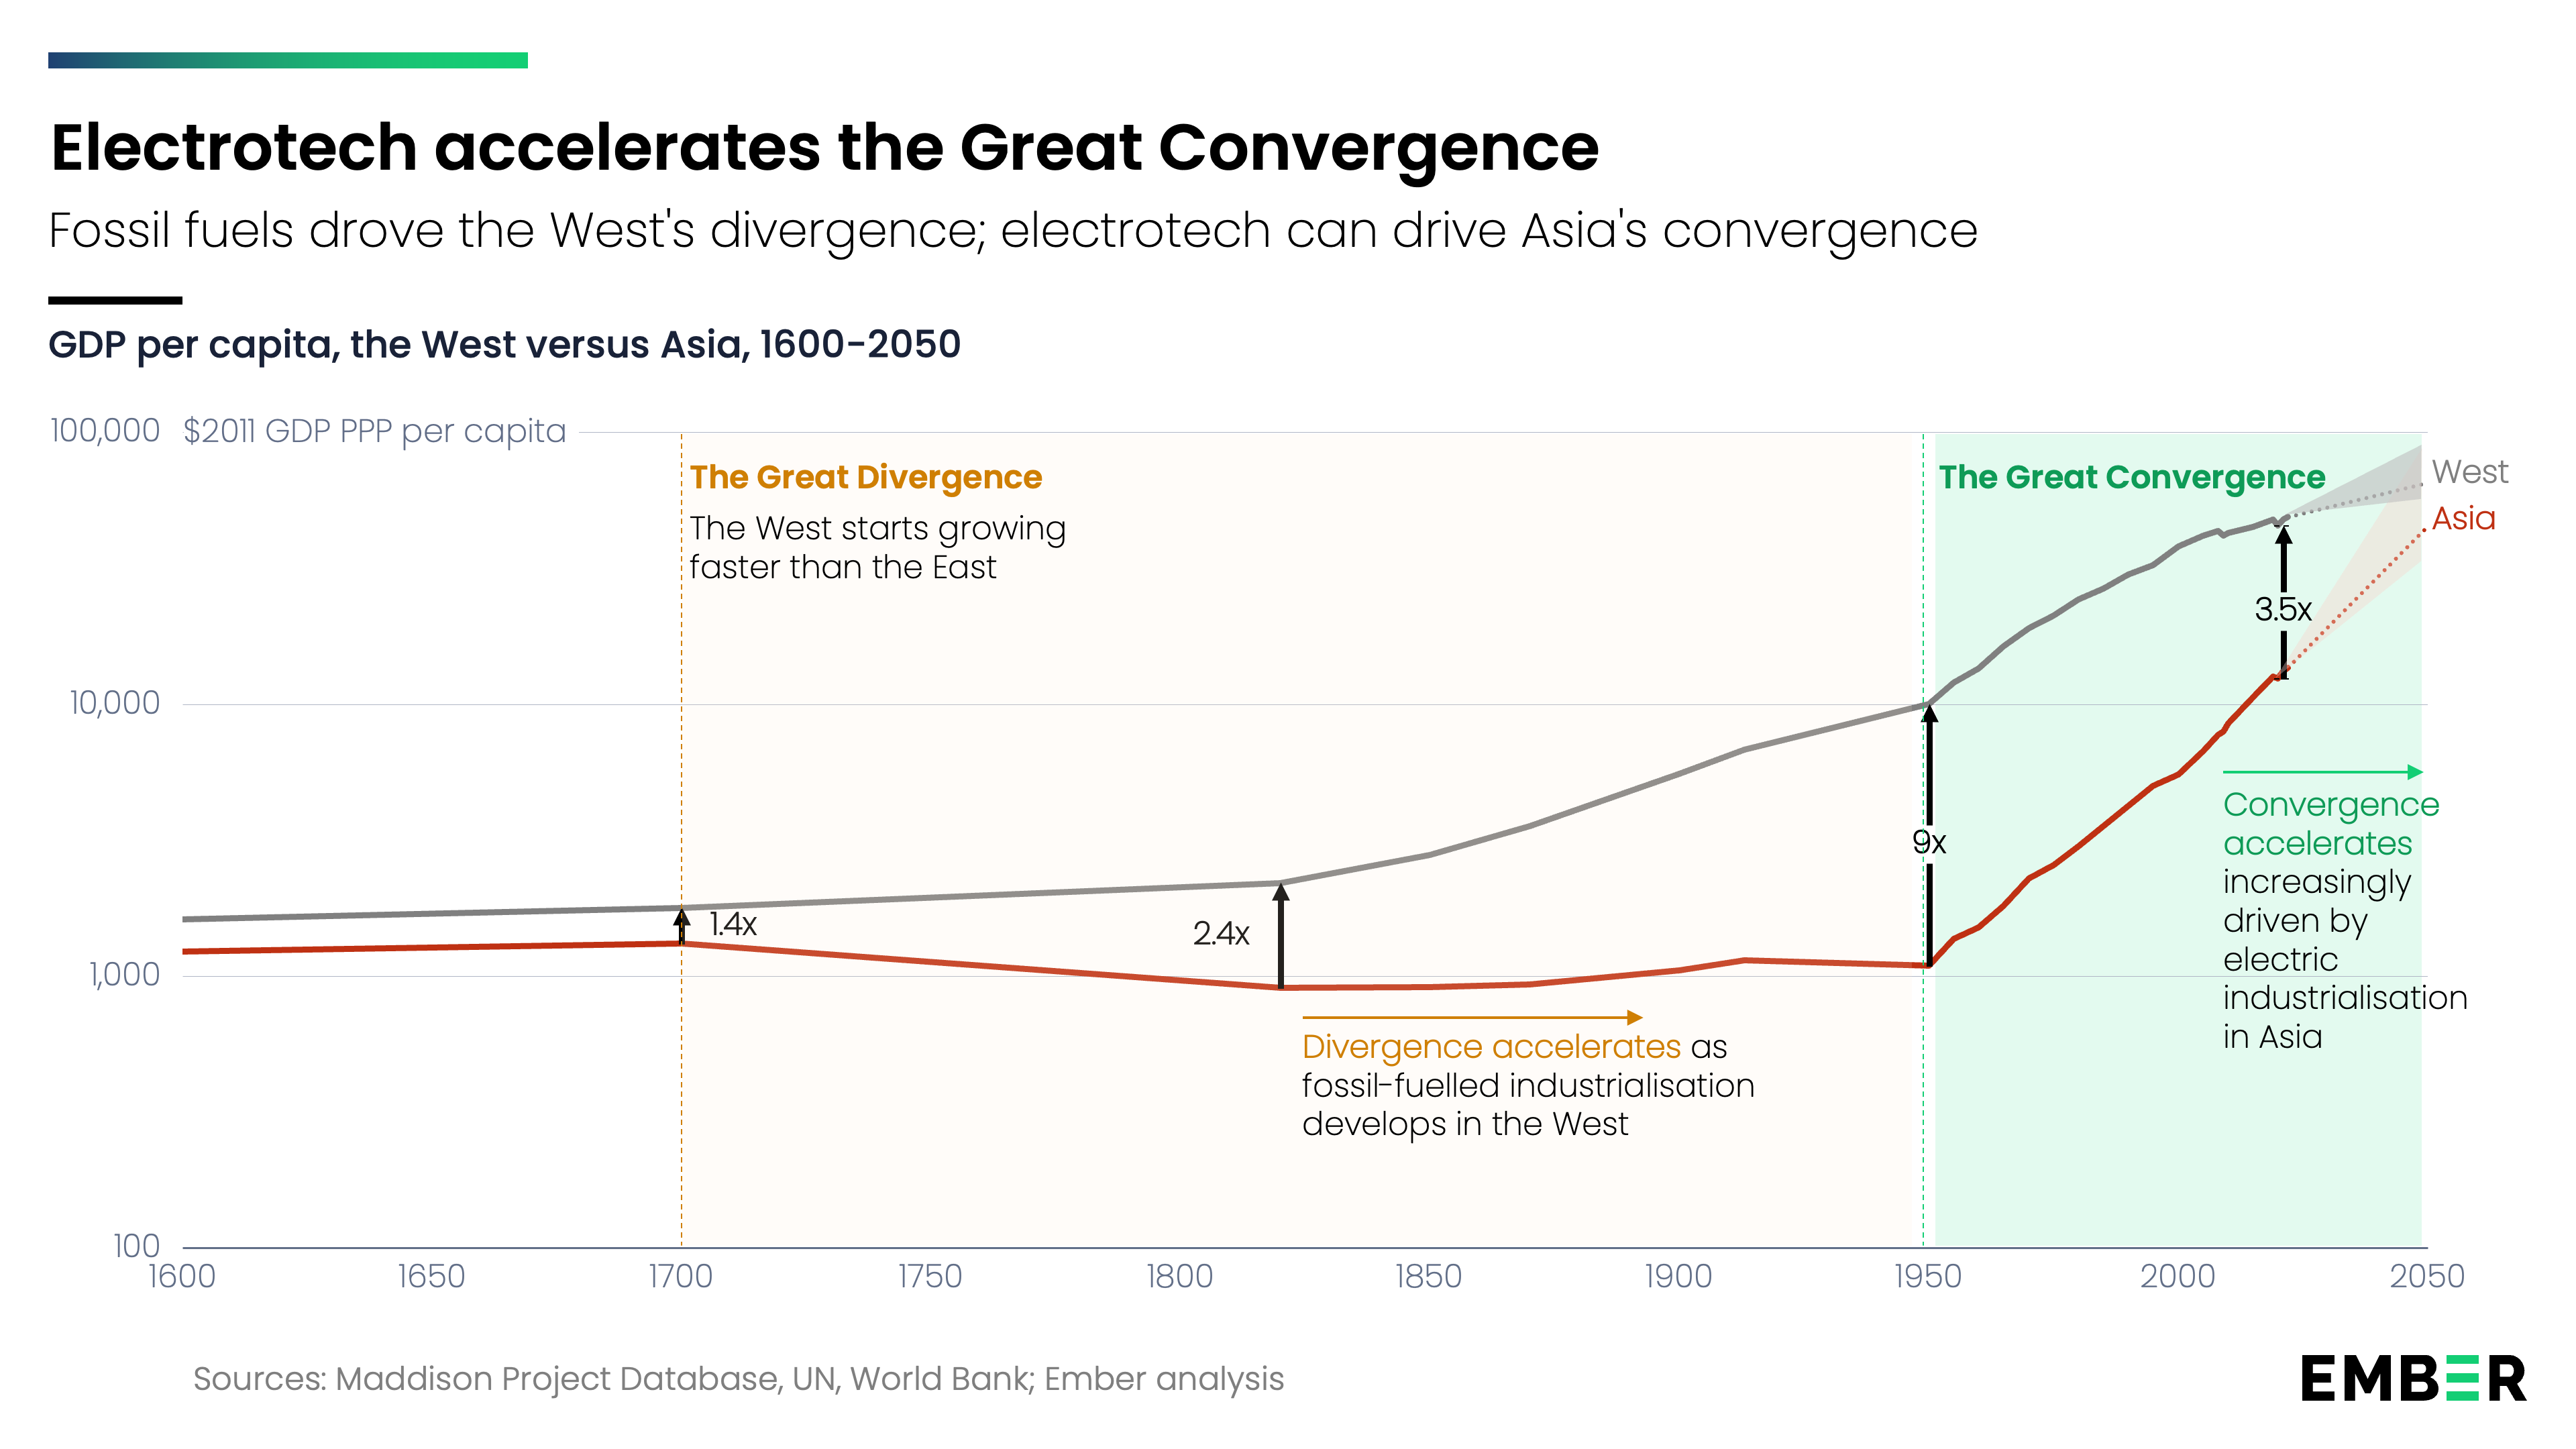
Such a shift carries historical weight. After 1800 the West pulled ahead of Asia, a parting of fortunes known as the Great Divergence. Energy sat at the core of this divergence: first coal, then oil, and the engines built to burn them. These innovations favoured Western strengths and underwrote two centuries of wealth and power.

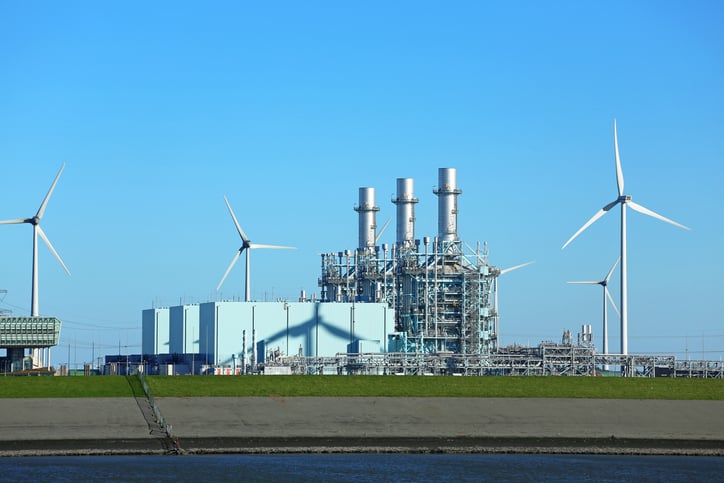
The Great Convergence – the East closing in on the West – also has an energy story, and it runs the other way. The new vector is electricity, and the electro-technologies that run on it. The new centre is Asia. Its lack of oil and gas was a weakness in a fossil world. It is a blessing in an electric one.

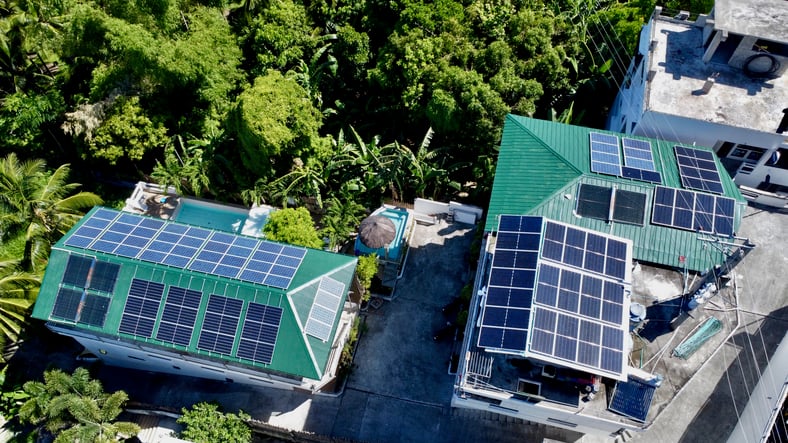
China is, of course, the giant. But change is radiating outwards. From Vietnam to Bangladesh, electrification rates are higher than in Europe or the United States. From Pakistan to Japan, solar’s share of power beats the US. From Thailand to Nepal and Indonesia to Singapore, EV uptake is ahead. Strip China out, and the rest of Asia still outbuilds the world in solar modules and battery components.

For years the economics of electrotech have been improving rapidly. A decade ago, solar began to beat coal, and electric cars beat petrol over their lifetimes, once fuel was counted. Today solar and EVs are cheaper to buy outright, even before the fuel savings. For economies short of capital, the door is now open to rapid change.

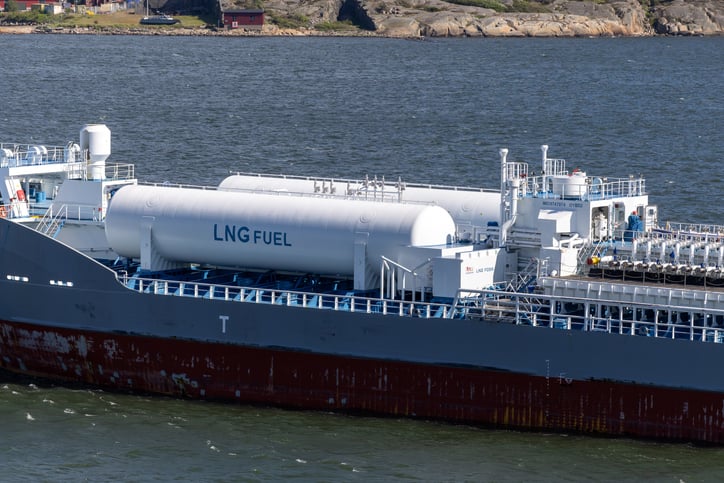
Then came Hormuz: the closure of Asia’s petrol station. The region buys nearly half of its oil from the Gulf, a deeper reliance than Europe had on Russia. It is the second blow in four years. The first came in 2022, when Russia cut off Europe, and Europe outbid Asia for gas, pricing out poorer countries. If electrotech is the pull of opportunity, the twin fossil shock is the push of necessity.

Economics, security and industrial opportunity now all point in the same direction. Asia holds half the world’s people and 4% of its oil and gas, but three quarters of the electrotech factories that can replace the fuel it lacks. The Great Divergence was powered by the energy the West mastered. The Great Convergence runs on the energy that Asia manufactures. If this is to be the Asian century, its path will be electric.

Key takeaways

01

Asia is electrifying rapidly, charting a new path.

The region generates more than half the world’s electricity and accounted for three quarters of global electricity demand growth since 2000. It overtook the West on electrification in 2016, and the gap is widening as it electrifies five times faster. Electricity met 26% of its final energy demand in 2023.

02

What started in China is spreading throughout Asia.

Southeast Asia overtook the US on electrification in 2023 and on EV sales share in 2024; South Asia passed it on solar share in 2022. 84% of Asia’s electricity demand sits in economies more electrified than the US. Excluding China, Asia still out-produces the rest of the world in solar modules and battery components.

03

Asia’s geography favours electrotech.

Asia has just 4% of global oil and gas reserves, and imports $1.1 trillion of fossil fuels every year, accounting for 31% of its primary energy demand. Yet it is an electrotech superpower. Asia manufactures over 95% of solar panels, 85% of batteries and 75% of wind turbines. It has enough solar and wind resources to supply at least 14 times its total energy demand and 100 times its oil and gas production.

04

Falling electrotech costs have opened the door to rapid change.

Solar plus storage undercuts three-quarters of planned gas plants. In China, electric cars are cheaper to buy than petrol ones, with the average city EV retailing at $10,000. Over 70% of the energy system can already be electrified using commercially available technologies. None of this was true even five years ago.

05

The closing of Hormuz is the catalyst.

In 2024, Asia imported 45% of its oil and 30% of its LNG from the Middle East, making the region uniquely vulnerable to geopolitical disruption and fuel price shocks. Today’s high prices and shortages are forcing many Asian economies to rethink their energy strategy.

06

Asia has a new playbook.

Deploy electrotech at home and export it to the world. At home, two levers stand out. On supply, solar and batteries can replace expensive LNG. On demand, electric vehicles can halve Asia’s oil imports, saving over $300 billion a year. As electrotech frees a growing share of Asia’s trillion-dollar fossil import bill, more capital can flow back into electrotech. Get this right, and the prize could be the Asian century.

Supporting materials

Downloads

Download the complete slidedeck PDF.

Slidedeck – Electric Asia (PDF)

Sources

Data on electricity generation are sourced from Ember’s Electricity Data Explorer. Solar export figures are taken from Ember’s China’s Solar PV Export Explorer. Data on final energy and electrification are drawn from the International Energy Agency’s World Energy Balances. Electrification is measured as the share of electricity in final energy consumption.

For long-run historical energy data, the report uses IIASA’s Primary, Final and Useful Energy Database created by Simon De Stercke. For long-run GDP estimates we use the Maddison Project database.

International trade data, including import and export volumes and prices, are drawn from UN Comtrade and the Observatory of Economic Complexity (OEC) . Economic and population indicators come from the World Bank.

Data on sales and prices of electric vehicles are sourced from the IEA’s Global EV Data Explorer.

Methodology

To calculate the share of Asia that has leapfrogged the United States, we measure electrification and solar against Asian electricity demand, and electric vehicles against Asian car sales.

Slides 18 and 45 use ternary charts. Each point sits inside a triangle whose three corners sum to 100 per cent. The nearer a point lies to a corner, the larger that variable’s share.

Historical road transport oil demand for Asia is taken from the IEA. From there we project two illustrative paths to 2050. In the Fossil path, road oil grows 2 per cent a year. In the Electric Fast Track, electric vehicles follow an S-curve, modelled using a logistic curve fitted to Asia’s historical EV sales share. The gap between the two paths is the oil demand avoided by electrification. We value that gap at 60 dollars a barrel to give the potential savings by 2050.

To measure the annual economic cost of fossil fuel import dependency, we sum each country’s annual oil, gas and coal imports on a net basis (i.e. after exports) and compare the total to its annual GDP. We also allocate these net imports to sectors, fuel by fuel, following each country’s energy mix from the IEA. We then apply the following displacement assumptions: EVs can displace all oil imports in road transport; renewables can displace all fossil imports in power; electrifying buildings can displace all fossil imports in the buildings and industrial electric technologies can electrify up to half of industrial energy demand, counting only the room each country has left to reach that level. No specific timeframe is prescribed to this potential, as the pace at which nations realise these savings depends on choices made today.

The number of electrotech jobs (Slide 54) is based on data from the IEA’s World Energy Employment 2025. It combines the following categories: Solar PV, Wind, Grids, EVs and batteries, Industrial efficiency, Efficient appliances and lighting, Heat pumps, Other efficient and renewable HVAC, and Critical minerals.

How we define Asia in this report

For the purposes of this report, we have divided Asia into four regions, as described below:

  • Greater China: China, Hong Kong (China), Macao (China), Taiwan (China)
  • Northeast Asia: Japan, Singapore, South Korea
  • South Asia: Bangladesh, Bhutan, India, Maldives, Nepal, Pakistan, Sri Lanka
  • Southeast Asia: Brunei Darussalam, Cambodia, Indonesia, Lao People’s Democratic Republic (the), Malaysia, Myanmar, Philippines (the), Thailand, Timor-Leste, Viet Nam

When granular data was not available for certain sources, data for “Asia-Pacific” was used.

Disclaimer: The boundaries and names shown and the designations used in this report do not imply official endorsement or acceptance by Ember.

Acknowledgements

The authors would like to thank Ardhi Rahmani, Assaad Razzouk, Biqing Yang, Chelsea Bruce-Lockhart, Danny Kennedy, Dave Jones, Dinita Setyawati, Duttatreya Das, Georgia Miller, Hannah Broadbent, Lauri Myllyvirta, Muyi Yang, Neshwin Rodrigues, Rini Sucahyo, Shiyao Zhang, Sumant Sinha, Tim Buckley, and Tito Das for their input and insights.

Authors: Daan Walter, Sam Butler-Sloss, Antoine Issac, Kingsmill Bond, Aditya Lolla


Cover image

An indoor view of a Geely electric vehicle factory in China, showing multiple white cars moving along an illuminated assembly line with factory workers present.

Credit: xieyuliang / Getty Images Plus

Share