Indonesia's captive coal giant꞉ better data to shape industrial competitiveness | Ember

Indonesia’s captive coal giant: better data to shape industrial competitiveness

Data rigour in Indonesia’s captive power sector could strengthen emissions monitoring and help drive investments for green industries.

24 Sep 2026
18 Minutes Read
Download PDF

Highlights

161 TWh
Estimated captive power generation by 2025, with half going to the nickel processing industry.
83%
The share of coal generation in the total captive fleet by 2025. This is a 13pp discrepancy with HEESI 2025.
135 Mt
The estimated CO2 emissions from captive power activities.

Executive summary

Decarbonising captive power sector is key to Indonesia’s green economy

Being a major contributor to emissions, accounting for 48% of total power sector emissions in 2024, captive power with limited compliance in operational reporting can hinder transparency and create data inconsistencies. Using an industry-focused bottom-up approach that complements the Ministry of Energy and Mineral Resources (MEMR)’s latest Handbook of Energy and Economic Statistics of Indonesia (HEESI) 2025 data, our analysis provides an estimate of captive coal power generation of more than 133 TWh.

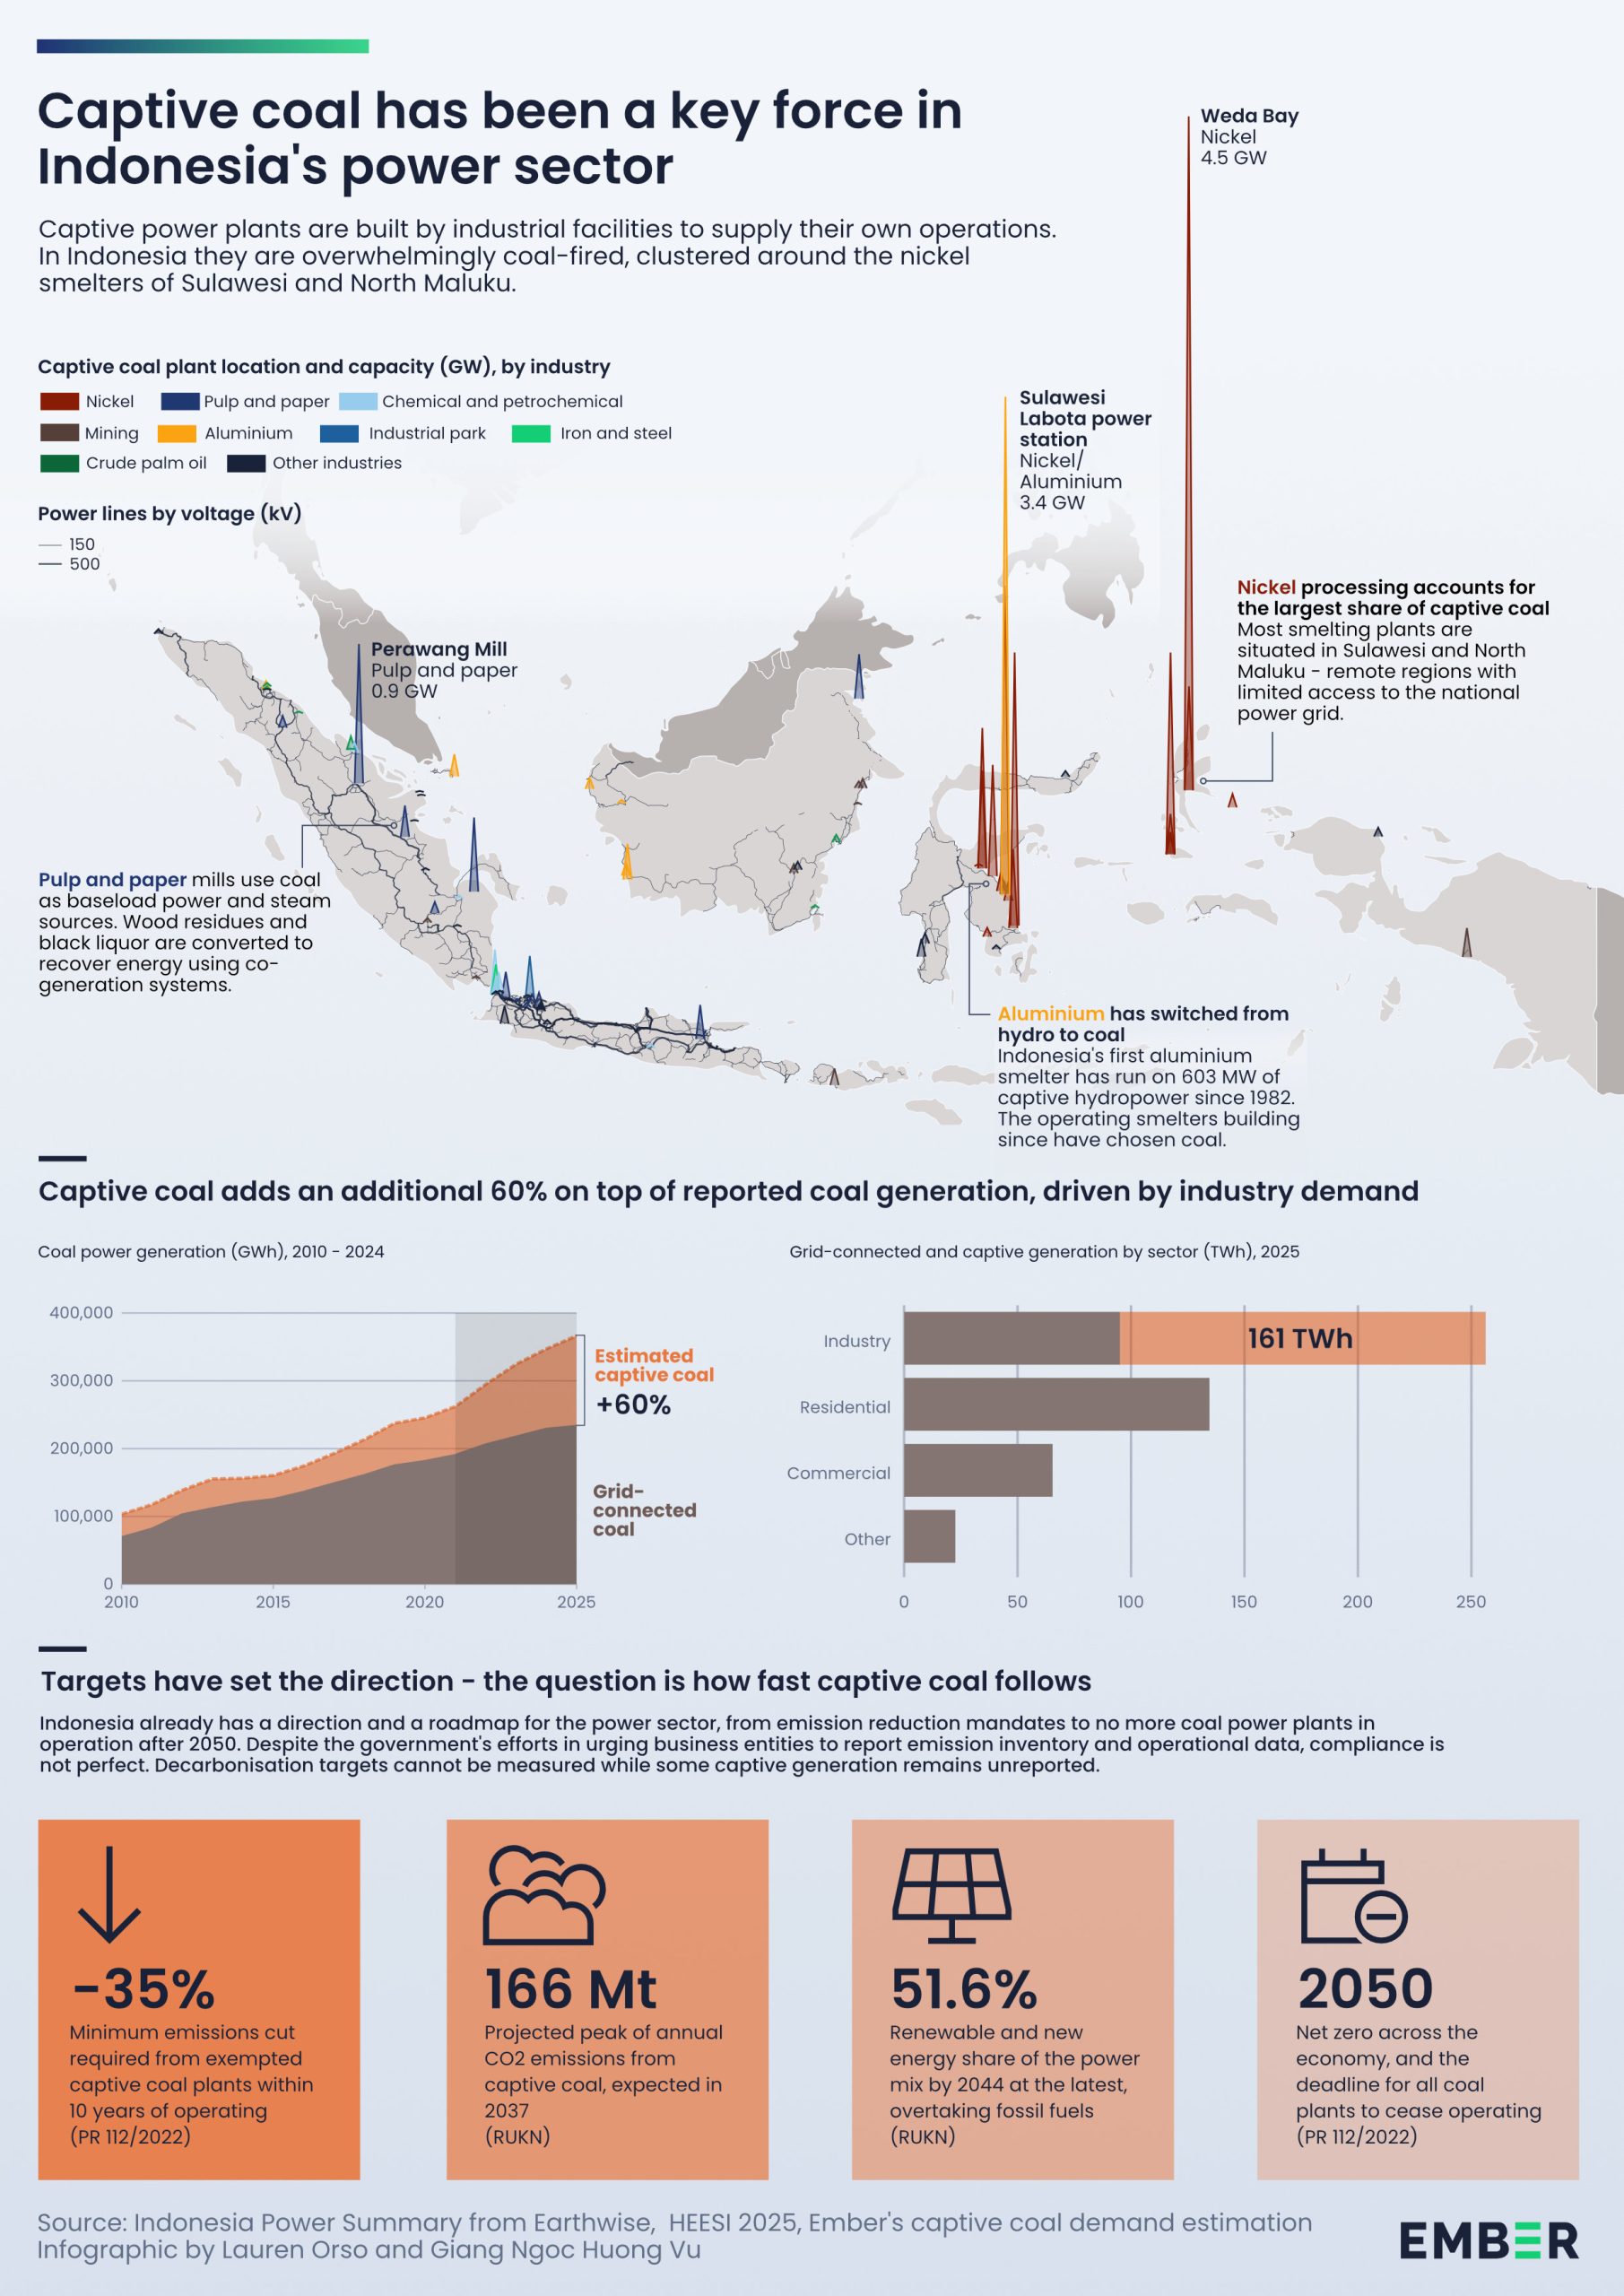
The nickel industry contributed to industrial development in Indonesia. Since the ban on unprocessed nickel exports in 2020, Indonesia became the leading processed nickel exporter, supplying more than half of global production in 2023. Given their energy-intensive nature, most smelters that are located in remote regions, such as Sulawesi and North Maluku, still rely on captive coal. A few facilities are reported to draw less than 1% of their energy consumption from the state-owned PLN grid.

The transparency of captive coal data in the Indonesian official energy policy document has been anticipated since the JETP CIPP document was published in 2025. Officially, the Handbook of Energy and Economics Statistics (HEESI) 2025, launched in August 2026, includes plant-level data on the captive power sector. It reported more than 28.5 gigawatts (GW) of installed capacity and more than 144 terawatt-hours (TWh) of electricity production from IUPTLS (captive plants for own-use power supply) and IUPTLU (captive plants supplying to the public) license holders. The HEESI’s latest version helps strengthen data transparency by providing a license-based classification of power plants.

To provide a comparison, we estimate current and historical captive power demand across industries, based on previous work by the Just Energy Transition Partnership (JETP) Secretariat – the coordinator for internal and external stakeholders on the JETP, Global Energy Monitor (GEM)’s Plant trackers, and Earthwise (EW)’s Indonesian Captive Coal Database.

Our analysis shows that in 2025, more than 161 TWh of electricity was supplied by captive power, a discrepancy of 12% with HEESI and 1.7 times that of PLN’s electricity sales to industrial consumers in the same year. Coal contributes around 134 TWh of captive supply in our analysis, 30 TWh more than HEESI and more than half of on-grid coal production in 2025. The fossil captive power contributes to around 135 Mt CO2 emissions.

Complementing HEESI’s fuel breakdown of captive production, our approach also provides a breakdown of captive generation by industrial end-users. Nickel processing alone accounts for more than 81 TWh, where over 94% of it is coal-fired, followed by pulp and paper (22 TWh) and multi-industry industrial parks (13.5 TWh).

Renewables, accounting for about 10% of total demand in 2025, are more visible in non-nickel industries. Hydropower historically fuelled the first Indonesian aluminium smelter with almost 4 TWh in 2025, yet its share has been shrinking recently owing to newly operating smelters that are more coal-driven. Meanwhile, the use of bioenergy is more prevalent in pulp and paper and crude palm oil (CPO) mills, subject to the combined heat and power (CHP) systems that can valorise biomass by-products for generating electricity and useful thermal energy. These sectors can be the first step to reduce captive coal with their proximity to the PLN’s grid.

The government and industries have also pushed for the deployment of large-scale solar and storage in industrial zones and nickel smelter facilities, through a Nickel Decarbonisation Roadmap, targeting more than 47 GW of renewable energy capacity and 5.1 of green hydrogen. Scaling up renewables in captive power will rely on the distinctive nature of each industry and each renewable energy source’s technical potential. A few industrial interventions have been proposed, including industrial clustering, fuel switching, and carbon capture and storage (CCS), some with high economic costs and uncertainties. However, technologies with the least cost options and technical benefits, such as solar and storage installed close to the captive plants should be prioritised to avoid Indonesia from falling into the carbon lock-in trap.

Data rigour for captive power is more than an accounting task. While Indonesia already has policy and regulatory frameworks to decarbonise the industrial sector, from Presidential Regulation 112/2022, net-zero commitment by 2060, and emission reductions to renewable energy targets, these strategies should be complemented with clearer guidelines or mandates to limit off-grid emissions, effective collaboration among responsible stakeholders and strong political will. Capacity mapping cannot capture captive demand or CO2 emissions, as applying a universally assumed capacity factor across different industries could lead to systematic miscalculation of generation and emissions. Furthermore, an increasingly sustainability-conscious market, namely the EU’s Carbon Border Adjustment Mechanism (CBAM), can impose penalties and jeopardise the competitiveness of Indonesian export commodities.

Therefore, an enhanced reporting system for captive power, supported by robust methodologies and compliances from industrial operators to provide granular facility-level data, is a precondition for Indonesia to maintain its competitive industrial position, as well as lay a foundation for a credible carbon trading market and better national decarbonisation efforts tracking.

Captive coal power has been massively driven by Indonesia’s metal downstreaming boom, placing industrial power supply at the centre of national planning. How this capacity is steered will determine not only the pace of the country’s energy transition, but also its global competitiveness as overseas markets embed carbon metrics into trade policy. Bridging top-down national reporting in HEESI with a bottom-up approach establishes the transparent baseline essential for credible decarbonization. Prioritising this integration is critical if Indonesia is to align its primary industrial growth drivers with its climate ambitions.

Katherine Hasan
‍
Analyst, Centre for Research on Energy and Clean Air

Mandating the limit of coal use in the captive power sector could accelerate Indonesia’s green economic ambitions. As coal reserves become increasingly constrained, harnessing Indonesia’s abundant solar resources could unlock its economic potential and establish the country as a global green-industry leader.

Dr Dinita Setyawati
‍
External Affairs & Strategic Impact Lead, Ember

Captive power use is increasing Indonesia’s industry, and it limits the country to achieve decarbonisation targets. The latest HEESI has provided a top-down approach to capture the operation of this special sector. Our analysis proposes a bottom-up perspective with greater focus on industrial activities to complement HEESI’s data, aiming to strengthen the data quality to better track Indonesia’s decarbonisation efforts.

Giang Vu
‍
Data Analyst, Ember

Key takeaways

01

Indonesia’s off-grid coal fleet produced roughly 60% as much electricity as its grid-connected coal plants

Captive coal generation is estimated to be roughly 134 TWh in 2025, equivalent to 58% of 233 TWh generated by on-grid coal – up from 50% in 2024. This generation sits largely outside Indonesia’s energy transition commitments, equivalent to around 135 Mt of CO2 emissions, and an additional 30 TWh generation from captive coal fleets compared with HEESI’s data.

02

Coal makes up majority in the captive power fleet, supplying mainly energy-intensive nickel smelting plants with limited grid access

By the end of 2025, more than 81 TWh of captive power is estimated to go toward the nickel processing activities, of which more than 94% comes from coal. Most smelting plants are situated in Sulawesi and North Maluku – remote regions with limited access to the national power grid.

03

Captive coal reliance extends beyond nickel, and these industries are the low-hanging fruit for decarbonisation

More recent operating aluminium plants, built by both Indonesian and Chinese companies, are leaning towards captive coal supply with current generation of 12.2 TWh in 2025. Meanwhile, pulp and paper already meet 20% of its captive demand without coal through combined heat and power systems from black liquor and wood waste, and palm oil mills run largely on their fruit bunches and kernel shells. As these sectors cluster in Sumatra, Java, and Kalimantan, within reach of the PLN’s interconnections – an easy start for stabilising captive coal.

04

Solar paired with battery storage system can replace captive coal

Our analysis found that around 70 GWh of captive solar is generated for the pulp and paper industry. Solar is also recorded as alternate fuel for some captive coal plants. Given there is more than 490 GWp of on-site solar potential, cost-effective solar and storage can be a viable option for round-the-clock supply for energy-intensive industries and meet Indonesia’s 100 GW solar plan.

Chapter 1

Massive growth of captive coal is hindering Indonesia’s industrial competitiveness

Industrial activities serve as a cornerstone of Indonesia’s economic strategy, driving 40% of GDP growth and employment opportunities. Among these, nickel extraction and processing position Indonesia as a vital link in the stainless steel supply chain and are driving growth for EV manufacturing. The domestic nickel processing industry developed rapidly after the ban on unprocessed nickel exports in 2020. In 2024, Indonesia’s nickel production reached more than 2.3 million metric tons, accounting for more than 62% of global production.

However, this industrial expansion has brought energy demand complexities to the forefront. For energy-intensive industries such as nickel, aluminium, and steel, smelting centres are usually located in remote areas with limited access to the national power grid. Concentrated in Sulawesi and North Maluku, they rely on captive coal as the primary supply of electricity for efficiency reasons. We estimate that industry drew more than 161 TWh from captive power in 2025, equivalent to roughly 1.7 times PLN’s electricity sales to industrial customers that same year.

In an effort to keep track of captive power in Indonesia, the JETP Secretariat estimated that among 25.9 GW of captive power plants built by 2024, 75% of them run on coal. Nickel processing stands out as one of the most captive energy-intensive industries, with a capacity of about 14 GW – of which 95% is coal-based.

The trajectory of the mineral extraction and processing industry creates a dichotomy between Indonesia’s ambitious industrial pathways and its national energy transition commitments.

Chapter 2

Government’s efforts to decarbonise the industry sector and shy away from coal

Understanding that aligning downstreaming strategies with sustainability is essential for long-term competitiveness, Indonesia’s government has developed long-term national plans and emission mandates to decouple economic growth from carbon-intensive energy sources.

The government’s energy transition strategy is fundamentally driven by the Presidential Regulation (PR) 112/2022, which imposed a ban on newly built coal power plants, emission reduction mandates of at least 35% within 10 years of operation for exempted captive plants built for “national strategic projects”, and a coal phase-out in the power sector by 2060. The Just Energy Transition Partnership (JETP) Comprehensive Investment and Policy Plan (CIPP) further supports these regulatory frameworks. The CIPP provides a roadmap for a structural shift in the power sector, with ambitious renewable energy generation targets of 44% by 2030 and grid emission limits (i.e., 250 Mt by 2030, 175 Mt by 2040) to achieve the end goal of net-zero emissions by 2050.

Furthermore, the National Electricity General Plan (RUKN) and MEMR Regulation No 10/2025 on the roadmap of electricity sector transition project that peak CO2 emissions from power generation will occur in 2037 at around 599 million tonnes of CO2, consisting of approximately 433 million tonnes from the grid and around 166 million tonnes from captive power. The national electricity plan provides no further breakdown of this scenario.

Regulations regarding carbon reporting and emission caps already exist in Indonesia, yet uncertainty remains for captive plants. MEMR Regulation No 16/2022 mandated emission allowances (PTBAE) for IUPTLU/PPU and IUPTLS holders, but a category benchmark only applies to grid-connected plants.

Abbreviations glossary: PLN, IUPTLU, IUPTLS, PPU and IPP

PT PLN – PT Perusahaan Listrik Negara (Persero) is Indonesia’s state-owned electricity utility and provider of electricity generation, transmission, and distribution network.

IUPTLU – Izin Usaha Penyediaan Tenaga Listrik untuk Kepentingan Umum, is a license to conduct electricity supply business for public purposes. IUPTLS can generate, transmit, distribute, and sell electricity to the public or PT PLN (Persero). Typical users include independent power producers (IPPs), state-owned PLN and Private Power Utilities (PPUs).

IUPTLS – Izin Usaha Penyediaan Tenaga Listrik untuk Kepentingan Sendiri, is a license to supply electricity for captive use. Holders cannot sell electricity to the public, and typical users are metal smelters and industrial estates.

PPU – Private Power Utility is an electricity supplier that holds the IUPTLU license to supply electricity to the tenants in defined business areas such as industrial estates.

IPP – Independent power producers are electricity suppliers that do not have a defined business area. They generate and sell electricity mainly to PT PLN (Persero) through Power Purchase Agreements (PPAs).

Powering the nickel industry

Most nickel smelter facilities are located in remote locations, with limited transmission support, away from Indonesia’s main grids: the Java-Madura-Bali, Sumatra, Kalimantan interconnections. In some instances, companies use less than 1% of the electricity available from the state electricity company, PLN’s grid. Our analysis shows that almost 60% of captive coal generation (81.3 TWh) is dedicated to nickel processing activities in 2025, followed by pulp & paper (22 TWh) and industrial parks (13.5 TWh).

The National Long-term Development Plan (RPJPN) 2025 – 2045 sets out an ambitious trajectory of 81% absolute national GHG reduction by 2045 compared to the baseline scenario. This is woven into the Nickel Industry Decarbonisation Roadmap in 2025, with four decarbonisation strategies, explicitly focusing on the integration of renewable energy into the nickel processing chain. The roadmap proposes setting up more than 47 GW of renewable energy capacity across the country, with improved transmission infrastructure to reach the remote nickel smelters, and 5.1 GW of green hydrogen, particularly in North Maluku province. When Indonesia’s 100 GW solar plan becomes live, there will be a more significant rise to the renewables target.

The presidential regulation, long-term directions and roadmap have been laid out; however, stronger political will is necessary for the effective coal phase-out implementation in the captive power sector.

Chapter 3

Data quality as an enabler for carbon emission tracking and industrial competitiveness

Indonesia’s coal phase-out policies and initiatives signal a profound national shift towards industrial decarbonisation, yet captive coal remains a Pandora’s box. The reporting and monitoring process remains challenging despite the efforts from the Directorate General of Energy and Mineral Resources (Ditjen Gatrik) of MEMR.

MEMR Regulation No 22/2019 provides guidelines for GHG inventory and requires energy-producing businesses to report their emissions through the APPLE-Gatrik platform. Also, the business-reporting platform AMPERE-Gatrik was launched in 2021 to gather periodic reports on business profiles and operation data from electricity license holders. These inputs contribute significantly to the recording of captive power activities in national statistics. In the latest Handbook of Energy & Economics Statistics of Indonesia (HEESI) 2025, the MEMR reported around 17.3 GW of capacity, and more than 101 TWh of production came from captive coal power plants.

Compliance, however, varies widely across companies, and the resulting gaps carry through national reporting. For example, Ditjen Gatrik’s Electricity Statistics Book 2024 recorded the capacity of coal-fired power plants under the IUPTLS & IUPTLU/PPU (for captive uses) licenses to be 60 MW in Southeast Sulawesi, while this industrial province is identified as having more than 2.4 GW of operating captive coal power plants by the same year from Earthwise’s tracker.

According to Ditjen Gatrik’s 2025 performance report, while part of the electricity consumption data is gathered from reports submitted by IUPTLS & IUPTLU/PPU holders, it is still complemented by calculations from registered capacity and assumed capacity factors to fill the missing data. The report noted the lack of GHG emission and operational data, and this was highlighted in the previous meeting with businesses in May 2026.

In line with the MEMR’s reconciliation of license data through AMPERE-Gatrik/APPLE-Gatrik, HEESI 2025 reflects the change of classification from on-grid/off-grid definition to ownership types (PLN/PPU/IUPTLS). However, ambiguities remain about which captive plants send excess power to the PLN grid. For example, the 119 GWh of power tagged as PLN’s steam-power purchases from “IPP, Captive Power, PPU” in the HEESI 2025 do not show how much excess captive power actually entered the PLN grid. Therefore, applying the same split to the power production and purchase volumes could gain more clarity on excess power purchases from captive plants.

According to the JETP study, license applications and renewals do not need to demonstrate emission reductions conformity with PR 112/2022 or to review performance against approval conditions. Therefore, an integrated database with plant-level statistics, such as license type, grid-connection status, emissions, is essential for monitoring the commitments stated in PR 112/2022.

In an effort to fill this gap, some think tanks and independent organisations, namely GEM, CREA, IESR, and Earthwise, have carried out extensive work on project mapping, analyses and capacity estimation for captive power. The problem is not that captive coal goes unreported, but that it is under-represented.

We looked further into time-series captive generation with a bottom-up approach using production outputs and captive capacity of different industries, using findings from JETP’s study, GEM’s Global Plants trackers, and Earthwise’s captive coal database.

Our analysis shows almost 119 TWh of captive power supply came from coal in 2024, accounting for more than 50% of on-grid coal generation in the same year. With increased demand for industrial activities, we estimate that it reached 134 TWh in 2025, more than 30 TWh greater than the reported captive coal production from HESSI 2025. With differences between top-down and bottom-up methodologies, discrepancies between our analysis and HEESI are expected. However, we still arrive at the same message that coal still plays a major role in the captive power supply, highlighting the need to identify and scale up clean power alternatives.


Beyond providing comparative data for captive power production, our approach also complements HEESI 2025 with a breakdown of industrial captive end-users. More than 81 TWh of captive power goes to the energy-intensive nickel industry, with 95% of it coming from coal in 2025. Coal is perceived to be a more economical and technically feasible alternative, when in reality the Domestic Price Obligation (DPO) caps the coal price being sold to the domestic market to keep the price artificially low, which often becomes the benchmark for negotiations for captive coal price.

Our analysis finds that in 2024, an estimated 119.6 MtCO2 was released by captive power plants, equivalent to 48% of emissions coming from on-grid plants. Emissions increased to almost 135 MtCO2 in 2025. The climate impacts are even larger when accounting for methane released from the coal mining process.

Unrestricted growth of captive power could steer Indonesia away from its net-zero pathways and pose investment and competitiveness challenges to the country’s industrial outputs in international markets, particularly in anticipation of the European Union’s Carbon Adjustment Mechanism (CBAM). According to the JETP Secretariat, the projected coal captive capacity of roughly 28 GW by 2030 (of which 19.9 GW is currently operating and 4.4 GW is under construction) is expected to release 173 Mt CO2. The CBAM, therefore, could impose additional costs and market exclusion for Indonesian export commodities such as iron and steel, cement, aluminium, and fertiliser.

Furthermore, while existing capacity mapping efforts are crucial for tracking the pipeline’s growth, they cannot accurately demonstrate captive demand and CO2 emissions. Captive power serves industrial end-users with variable operation profiles. Therefore, using a universal capacity factor assumption to estimate the generation irrespective of their distinctive industrial use might erase that heterogeneity and risks systematically over- and under-stating generation and emissions across the entire sub-sectors.

Enhancing data quality and methodological rigorousness in captive power generation is a precondition for regulators to set credible carbon-market benchmarks. Emission caps, to date, have been issued only for coal-fired plants connected to the PLN grid and captive plants were initially brought into scope in 2025. While measurement, reporting, and verification (MRV) remains a challenge for Indonesia’s carbon market, an up-to-date database of coal generation and emissions, whether on-grid or off-grid, would enable a more effective cap-and-trade design and allow tracking of emission reduction measures required under Presidential Regulation 112/2022.

Therefore, our bottom-up, industry-focused generation estimates could contribute to that data improvement to HEESI’s data and complement existing capacity tracking work of other organisations. By shedding more light on decarbonisation progress in the captive sector, Indonesia can ensure that its industrial sector remains competitive in international markets.

Chapter 4

Renewables trajectory in non-nickel industries is necessary to avoid further carbon lock-in

Renewables trajectory in the non-nickel sector, including in aluminium industry, pulp & paper, and crude palm oil (CPO) mill plants, is becoming increasingly important to avoid further carbon lock in. Our analysis shows hydro contributes to 33% of total captive generation, or 4 TWh generation in the aluminium sector, with limited use of solar and storage. This captive supply mainly comes from the Sigura Gura and Tangga hydroelectric power plants along the Ashahan river, with a total capacity of 603 MW to supply electricity to PT INALUM’s aluminium smelter in Kuala Tanjung, Batu Bara Regency, North Sumatra since 1982.

More recent aluminium plants, mostly owned by Chinese joint ventures, are leaning more towards coal as captive supply. Earthwise recorded more than 1.3 GW of captive coal power plants are dedicated to aluminium/alumina smelters by 2025, scattered in West Kalimantan, Riau Islands, and Central Sulawesi.

Biomass byproducts are usually used in combined heat and power (CHP) cogeneration technology to produce heat and power. In the pulp and paper industry, byproducts include black liquor and wood waste, while they are empty fruit bunches and palm kernel shells for CPO. These byproducts can be recycled to power steam boilers that drive steam turbines for electricity generation in various capacities. Many small-scale (less than 10 MW) palm mills across Indonesia, like Sungai Rungau Mill in Central Kalimantan, can generate their own electricity from biomass residues. At the larger scale, the 535-MW Kerinci mill, owned by PT Riau Prima Energy, has been generating electricity from mill wastes, wood, and other agricultural biomass wastes for self-sufficiency since 1998. The use of biomass needs to be approached with caution as there are associated emissions that can be more polluting than fossil fuels.

These sectors are the low-hanging fruits for decarbonising captive demand as they sit in Sumatra, Java, and Kalimantan, within the PLN’s interconnections. The JETP Captive Coal study projected that by 2040, around 21 TWh of aluminium captive demand could be integrated onto the grid by 2040.

The use of solar and storage is limited in the captive sector. Earthwise’s database reports the use of renewables as an alternate fuel in several captive coal power plants across different industries, mostly in pulp and paper, and chemicals. Although the exact capacity is unknown, some of these plants are complemented by bioenergy and solar. In the Pulp & Paper industry, we found that solar contributes to 70 GWh of generation in 2025. Given there are more than 490 GWp of solar potential for all captive power sites, it leaves plenty of room for cost-effective solar and storage expansion, as part of Indonesia’s 100 GW solar plan.

Renewable energy trajectory focusing on clean and cheap technologies such as solar and storage is required to maintain Indonesia’s economic competitiveness in producing low-carbon commodities. Based on JETP, WRI, and IESR, the country needs a clear regulatory framework for the captive power sector that strikes a balance between industrial expansion and energy transition goals, multilateral synergies among responsible stakeholders and strong political will to push through decarbonisation commitments. In an increasingly climate-conscious international market, reducing reliance on captive coal is a suitable pathway for carbon-intensive industries in Indonesia to maintain their competitive ground.

Chapter 5

Conclusion

Understanding the magnitude of existing captive coal generation is the very first step to address it. Ember’s earlier work set out two pathways for Indonesia’s captive use in the nickel industry: green opportunism (rapid, carbon-intensive growth) and green developmentalism (more decarbonised growth to leverage long-term competitiveness). We also find captive renewables, i.e. solar plus storage complemented by smart grids and demand flexibility to be a more sustainable route, one that draws on the country’s immense renewable potential, alongside clearer standards and regulations for operational captive coal and emission targets and technical measures such as industrial clustering, more energy-efficient industrial processes, grid connection, carbon capture and storage (CCS) and fuel switching.

Delivering the PR 112/2022 and bringing captive plants into the emissions trading system depends on up-to-date data, which in turn requires consistent emissions and operational reporting from companies. For industrial players, this should be beyond a compliance exercise. Moving away from coal is a chance to reposition their products in markets that reward lower-carbon supply.

This report’s contribution is to provide a comparable bottom-up perspective that complements the current top-down records from HEESI 2025, and to move the conversation to the resolution stage. By filling the data gap and providing an industry-specific baseline for captive coal generation, this report also taps the country’s immense captive renewable energy potential and paves the way for a more sustainable and competitive future for Indonesia’s industrial sector.

Supporting materials

Methodology

The estimation of Indonesia’s annual captive power generation is carried out by Ember, relying on three primary references: Indonesia’s JETP Report on Captive Power Study, GEM’s Coal and Oil & Gas Power Plants Trackers (updated in 01/2026) and Earthwise’s Indonesia Captive Coal Power Plants Database (updated in 01/2026). In general, we look into production outputs and activities of each industry to estimate captive power demand and break it down into different fuels based on the capacity and the shares from primary references. Full details are set out in our methodology.

Acknowledgements

Contributors

We would like to thank Katherine Hasan and colleagues from the Centre for Research on Energy and Clean Air (CREA) for the quote and review on the report. A special thanks to Abraham Octama Halim from the Institute of Essential Services Reform (IESR) for providing us insights and reviewing the report. We would also like to extend our gratitude to Earthwise Institute for generously providing their datasets and knowledge about the captive power sector.

The author would like to thank Ember’s colleagues for their valuable comments and contributions, including Tito Das, Lauren Orso, Ardhi Arsala Rahmani, Aditya Lolla, Dr Muyi Yang, Matt Ewen and Dody Setiawan.


Cover image

An open-pit mining site in Molawe, Sulawesi Tenggara, Indonesia, featuring exposed red earth and heavy excavation equipment. Two workers wearing hard hats and reflective safety gear observe the operation from an elevated vantage point, with dense forest and hills in the background.

Credit: ArtHouse Studio / Pexels

Share