Supporting materials
Downloads
Download the full report PDF.
Methodology
Least-cost optimisation framework
This study applies a least-cost optimisation framework to determine Thailand’s optimal power system expansion. The analysis uses OpenSolver as the optimisation engine, with the objective of minimising the net present value of system costs, including annualised capital expenditure, fixed and variable operation and maintenance costs, fuel expenses, and unserved energy. Capital costs are annualised using the discounted cashflow method with a weighted average cost of capital of 10%.
The planning horizon covers the period from 2024 to 2037, which aligns with the RPDP. To capture both seasonal and diurnal variations, the model is structured around four representative time slices: wet and dry seasons, and solar and off-solar hours. The optimal outputs are validated using PyPSA with hourly resolution (8,760 hours) for three snapshot years – 2024, 2030, and 2037 – to ensure the technical feasibility.
Technology scope and assumptions
The model considers both committed and optimisable technologies. Committed technologies include biomass and nuclear, as reflected in the RPDP. Coal and gas plants follow the retirement trajectory of the RPDP, without 2 GW of new gas added in 2035 and 2036, assuming the consistent decline of the gas fleet. Utility solar is assessed in this study. Distributed solar data of Thailand is not available, thus not within the scope of this report
Wind projects are assumed committed until 2030, while solar, wind (beyond 2030), domestic hydro, imported hydro, battery, and PSH are optimised within the least-cost optimisation framework. Both BESS and PSH are assumed to have round-trip efficiencies of 85%. Project lifetimes, emission intensities and heat rates assumed in this study are in the table below.
Demand and electric vehicle sales
Demand inputs, including energy demand and peak demand, are based on the base case of RPDP 2024 developed by EGAT. Hourly demand profiles for 2024 are also sourced from EGAT. Additional demand is introduced from data centres, estimated by the previous Ember report at 6 TWh by 2030, representing an annual growth rate of 8%, and kept constant thereafter.
Additional demand from EV charging is also incorporated into the system peak demand. We kept the energy demand from EV the same as the RPDP.
EV sales are projected following Thailand’s 30@30 policy, which targets 100% new EV sales by 2035, followed by a gradual 5% annual decline in growth as the market saturates. Sales between milestone years are interpolated exponentially. Historical sales data from 2020 to 2024 are drawn from the ASEAN Federation of Electric Vehicle Associations and adjusted with Statista data for motorcycles. The EV charging load is calculated based on the cumulative fleet and charging levels. The charging power level is computed as the average of the range defined by NSW Transport. In contrast to the RPDP, which assumes peak EV charging contributes only 40% of peak load in the normal case (5.5% of the fleet), this study applies a 50% assumption, adding roughly 3.3 GW to system peak demand by 2037. The charging level power (kW) and associated share of the three types of vehicles are in the table below.
Cost and technical data
Cost and technical input assumptions are drawn from multiple sources. Capital expenditure for coal, gas, solar, and wind is based on Bloomberg forecasts for Thailand, while values for other technologies, including battery, PSH, nuclear, and biomass, are taken from the Vietnam technology and storage catalogues 2023. Generator fixed and variable O&M costs are also drawn from these reports.
Coal fuel costs are based on the International Energy Agency’s World Energy Outlook 2022, averaged of Japan and China values, while gas costs are based on the IEA World Energy Outlook 2024 averaged across the EU, Japan, and China. Both followed the stated policy scenario. Milestone year values for 2030 and 2050 are interpolated exponentially across the study period. Biomass cost is assumed to be $32 USD/ton based on the ERIA report, with an energy content of 17 GJ/tonne with 5% CAGR throughout the planning horizon.
Renewable resource profiles are derived from a range of sources. Solar raw profiles are calculated using Atlite, assuming South-facing optimally tilted panels, and geographically weighted using Global Energy Monitor solar tracker data. It is bias-corrected using GIS and Ember monthly data. Wind is based on Renewables Ninja averages from two strong and two mainstream sites at 80 m and 120 m hub heights identified by the Global Wind Atlas in Thailand’s northeast and central regions. Domestic and import hydro capacity factors are constructed from historical seasonal data in the Ember Electricity Data, assuming all imports are hydro. Renewable potential is taken from the Agora study.
Constraints and validations
The optimisation is subject to technology availability, committed project constraints, project lifetimes, and reserve margin requirements. Firm capacity of solar is assumed to be zero, since peak demand occurs in the evening when solar is unavailable. The final results of the least-cost model include the cost-optimal capacity mix by technology and year, generation mix, storage operation, emissions trajectory, and system costs. These results are tested in the hourly dispatch validation of PyPSA to confirm technical feasibility. Our model generation for the base year 2024 is comparable to generation stated in RPDP, which enhances confidence model reliability.
Limitations
Like all models, ours has certain limitations. First, the temporal resolution is relatively coarse, with only four representative timestamps per year. While capacity expansion modelling often reduces runtime through methods such as chronological sampling or load duration curves, this level of aggregation may overlook important variations in load and renewable generation profiles. To address this, we apply the reliability-adjusted reserve margin approach and validate results using PyPSA. Meanwhile, the RPDP model uses the probabilistic reliability criterion of Loss of Load Expectation(LOLE) that requires higher resolution data and computational power. Second, the model does not incorporate nodal geography and transmission network topology. Including these features would be essential for future studies but lies beyond the scope of this report. Finally, operational constraints such as ramping and minimum stable levels are not modelled, and validation is limited to three snapshot years of the planning horizon.
Acknowledgement
Lead authors
Lam Pham, Dinita Setyawati
Contributors
Special thanks to Dr. Weerawat Chantanakome for his quotes, Agora Energiewende for their guidance and support in reviewing this study. Thanks to Jivan Zhen Thiru and Reynaldo Dizon for their contributions to the report’s illustrations. Thanks to Tito Das and Ardhi Arsala Rahmani for their communications support. Thanks to Aditya Lola, Neshwin Rodrigues, Matt Ewen, Sam Hawkins, Libby Copsey, and Giang Vu for conducting the internal review and providing valuable suggestions.
Cover image
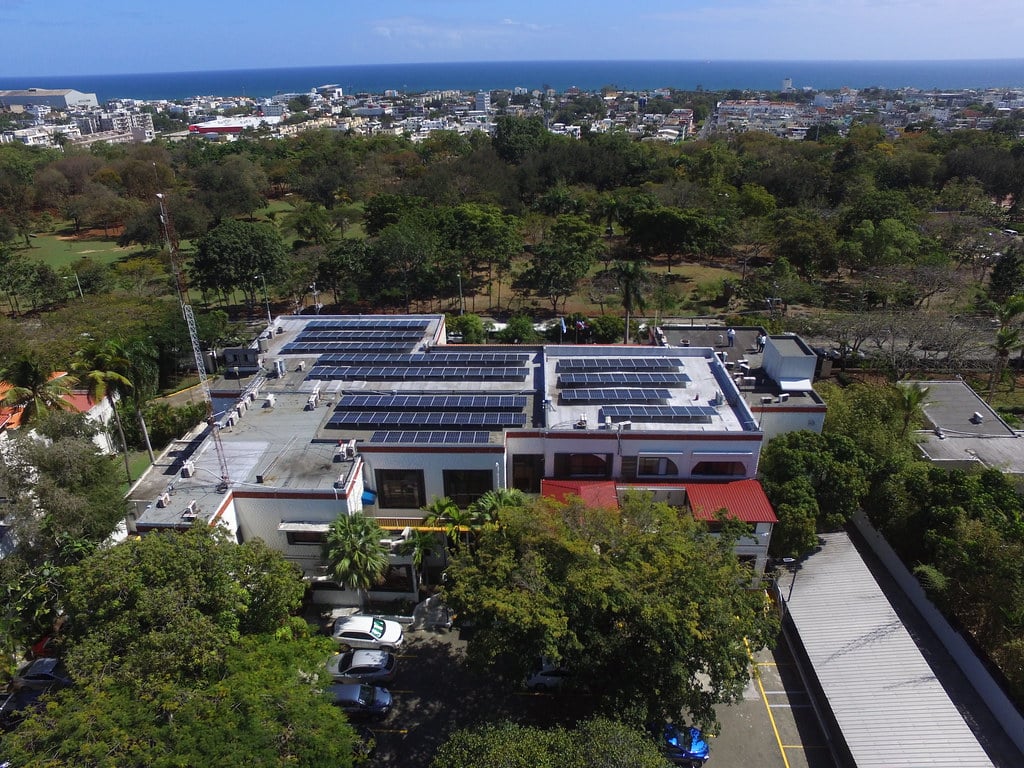
Photovoltaic solar panels set against a forest and mountain backdrop in Thailand.
Credit: Thinnapob / Getty Images Plus

Related Content